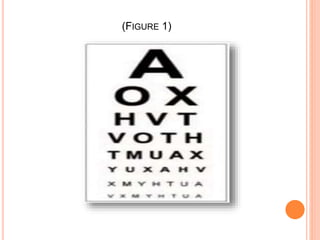
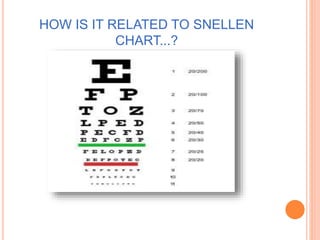
LOG MAR CHART
SLIDES PREPARED BY
OPTOM FASLU MUHAMMED
 The Snellen chart (fig 1), which traditionally has
been used to measure visual acuity is easily
recognized as one of the hallmarks of the
ophthalmologists consulting room. This has been in
use since 1862 and more recently a newer
LogMAR (fig 2) chart has been introduced into
clinical practice. Initially used as a research tool
because it is more accurate than other acuity
charts, this accuracy is also valuable in the clinical
setting and many eye departments now use it
routinely. This is particularly the case for children;
testing children’s acuity accurately is always a
challenge and the best charts available now are
those utilizing LogMAR
(FIGURE 1)
(FIGURE 2)
 The LogMAR chart is designed to enable more
accurate estimates of acuity as compared to other
acuity charts (e.g., the Snellen chart).
 Each line of the LogMAR chart comprises the
same number of test letters (effectively
standardizing the test across letter size)
 The Sloan font is used (Sloan letters are
approximately equally legible one from another);
letter size from line to line varies logarithmically, as
does the spacing between lines (making the chart
easy to use at nonstandard viewing distances).
 A LogMAR chart comprises rows of letters and is
used by ophthalmologists, optometrists and vision
scientists to estimate visual acuity. This chart was
designed to enable a more accurate estimate of
acuity than do other charts (e.g., the Snellen chart).
For this reason, the LogMAR chart is
recommended, particularly in a research setting.
 When using the LogMAR chart, visual acuity is
scored with reference to the Logarithm of
the Minimum Angle of Resolution, as the chart's
name suggests. An observer who can resolve
details as small as 1 minute of visual angle scores
LogMAR 0, since the base-10 logarithm of 1 is 0.
HOW IS IT RELATED TO SNELLEN
CHART...?
 The Snellen chart is also commonly used to estimate visual
acuity.
 A Snellen score of 6/6 (20/20), indicating that an observer can
resolve details as small as 1 minute of visual angle,
corresponds to a LogMAR of 0 (since the base-10 logarithm of
1 is 0);
 A Snellen score of 6/12 (20/40), indicating an observer can
resolve details as small 2 minutes of visual angle,
corresponds to a LogMAR of 0.3 (since the base-10 logarithm
of 2 is near-approximately 0.3), and so on.

 Each letter has a score value of 0.02 log units. Since there are
5 letters per line, the total score for a line on the LogMAR
chart represents a change of 0.1 log units. The formula used
in calculating the score is:
 LogMAR VA = 0.1 + LogMAR value of the best line read –
0.02 X (number of optotypes read)
 Given that each line has 5 optotypes, the equivalent
formula is:
 LogMAR VA = LogMAR value of the best line read
+ 0.02 X (number of optotypes missed)
POINTS TO BE NOTED..!!
 Zero LogMAR indicates standard vision.
 Positive values indicate poor vision.
 And negative values indicate good visions.
 This is less intuitive than other VA notations.
 However, LogMAR is actually a notation of vision
loss.
CONTENT PREPARED BY

Log mar chart

  • 1.
    LOG MAR CHART SLIDESPREPARED BY OPTOM FASLU MUHAMMED
  • 2.
     The Snellenchart (fig 1), which traditionally has been used to measure visual acuity is easily recognized as one of the hallmarks of the ophthalmologists consulting room. This has been in use since 1862 and more recently a newer LogMAR (fig 2) chart has been introduced into clinical practice. Initially used as a research tool because it is more accurate than other acuity charts, this accuracy is also valuable in the clinical setting and many eye departments now use it routinely. This is particularly the case for children; testing children’s acuity accurately is always a challenge and the best charts available now are those utilizing LogMAR
  • 3.
  • 4.
  • 5.
     The LogMARchart is designed to enable more accurate estimates of acuity as compared to other acuity charts (e.g., the Snellen chart).  Each line of the LogMAR chart comprises the same number of test letters (effectively standardizing the test across letter size)  The Sloan font is used (Sloan letters are approximately equally legible one from another); letter size from line to line varies logarithmically, as does the spacing between lines (making the chart easy to use at nonstandard viewing distances).
  • 6.
     A LogMARchart comprises rows of letters and is used by ophthalmologists, optometrists and vision scientists to estimate visual acuity. This chart was designed to enable a more accurate estimate of acuity than do other charts (e.g., the Snellen chart). For this reason, the LogMAR chart is recommended, particularly in a research setting.  When using the LogMAR chart, visual acuity is scored with reference to the Logarithm of the Minimum Angle of Resolution, as the chart's name suggests. An observer who can resolve details as small as 1 minute of visual angle scores LogMAR 0, since the base-10 logarithm of 1 is 0.
  • 7.
    HOW IS ITRELATED TO SNELLEN CHART...?
  • 8.
     The Snellenchart is also commonly used to estimate visual acuity.  A Snellen score of 6/6 (20/20), indicating that an observer can resolve details as small as 1 minute of visual angle, corresponds to a LogMAR of 0 (since the base-10 logarithm of 1 is 0);  A Snellen score of 6/12 (20/40), indicating an observer can resolve details as small 2 minutes of visual angle, corresponds to a LogMAR of 0.3 (since the base-10 logarithm of 2 is near-approximately 0.3), and so on.   Each letter has a score value of 0.02 log units. Since there are 5 letters per line, the total score for a line on the LogMAR chart represents a change of 0.1 log units. The formula used in calculating the score is:  LogMAR VA = 0.1 + LogMAR value of the best line read – 0.02 X (number of optotypes read)
  • 9.
     Given thateach line has 5 optotypes, the equivalent formula is:  LogMAR VA = LogMAR value of the best line read + 0.02 X (number of optotypes missed)
  • 10.
    POINTS TO BENOTED..!!  Zero LogMAR indicates standard vision.  Positive values indicate poor vision.  And negative values indicate good visions.  This is less intuitive than other VA notations.  However, LogMAR is actually a notation of vision loss.
  • 11.