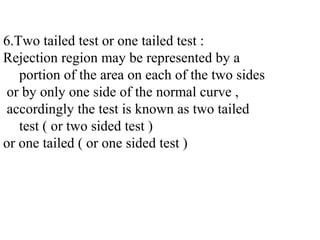
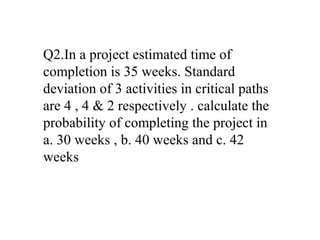
![4. level of significance :is the maximum probability
( α ) of making a Type I error i.e. : P [ Rejecting H0
when H0 is true ]
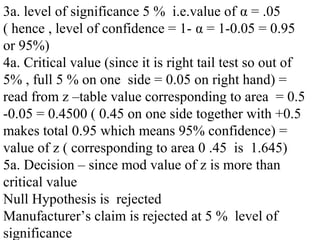
Probability of making correct decision is ( 1 - α )
Common level of significance 5 % ( .05 ) or 1 % ( .
01 )
For 5 % level of significance ( α = .05 ) , probability
of making a Type I error is 5 % or .05 i.e. : P
[ Rejecting H0 when H0 is true ] = .05
Or we are ( 1 - α or 1-0.05 = 95 % ) confidence that
a correct decision is made
When no level of significance is given we take α =
0.05](https://image.slidesharecdn.com/normaldistribution-uwsb-130610073552-phpapp02/85/Normal-distribution-Unitedworld-School-of-Business-19-320.jpg)
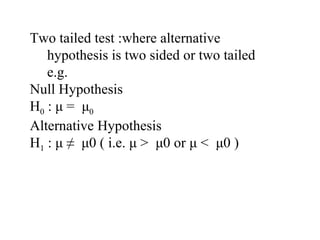
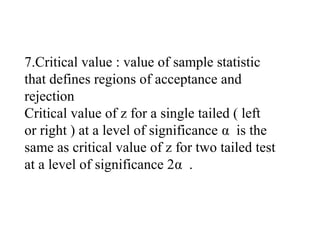
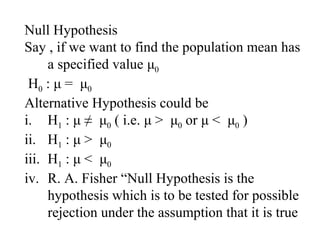
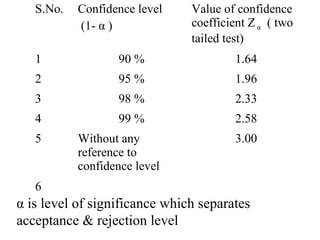
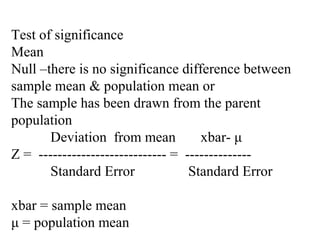
![Critical value
(Zα )
Level of significance
1 % 5 % 10 %
Two tailed test [Zα ] =
2.58
[Zα ] = 1.96 [Zα ] = 1.645
Right tailed
test
Zα = 2.33 Zα = 1.645 Zα= 1.28
Left tailed test Zα = -
2.33
Zα = -1.645 Zα = - 1.28](https://image.slidesharecdn.com/normaldistribution-uwsb-130610073552-phpapp02/85/Normal-distribution-Unitedworld-School-of-Business-26-320.jpg)

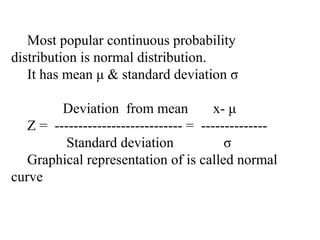
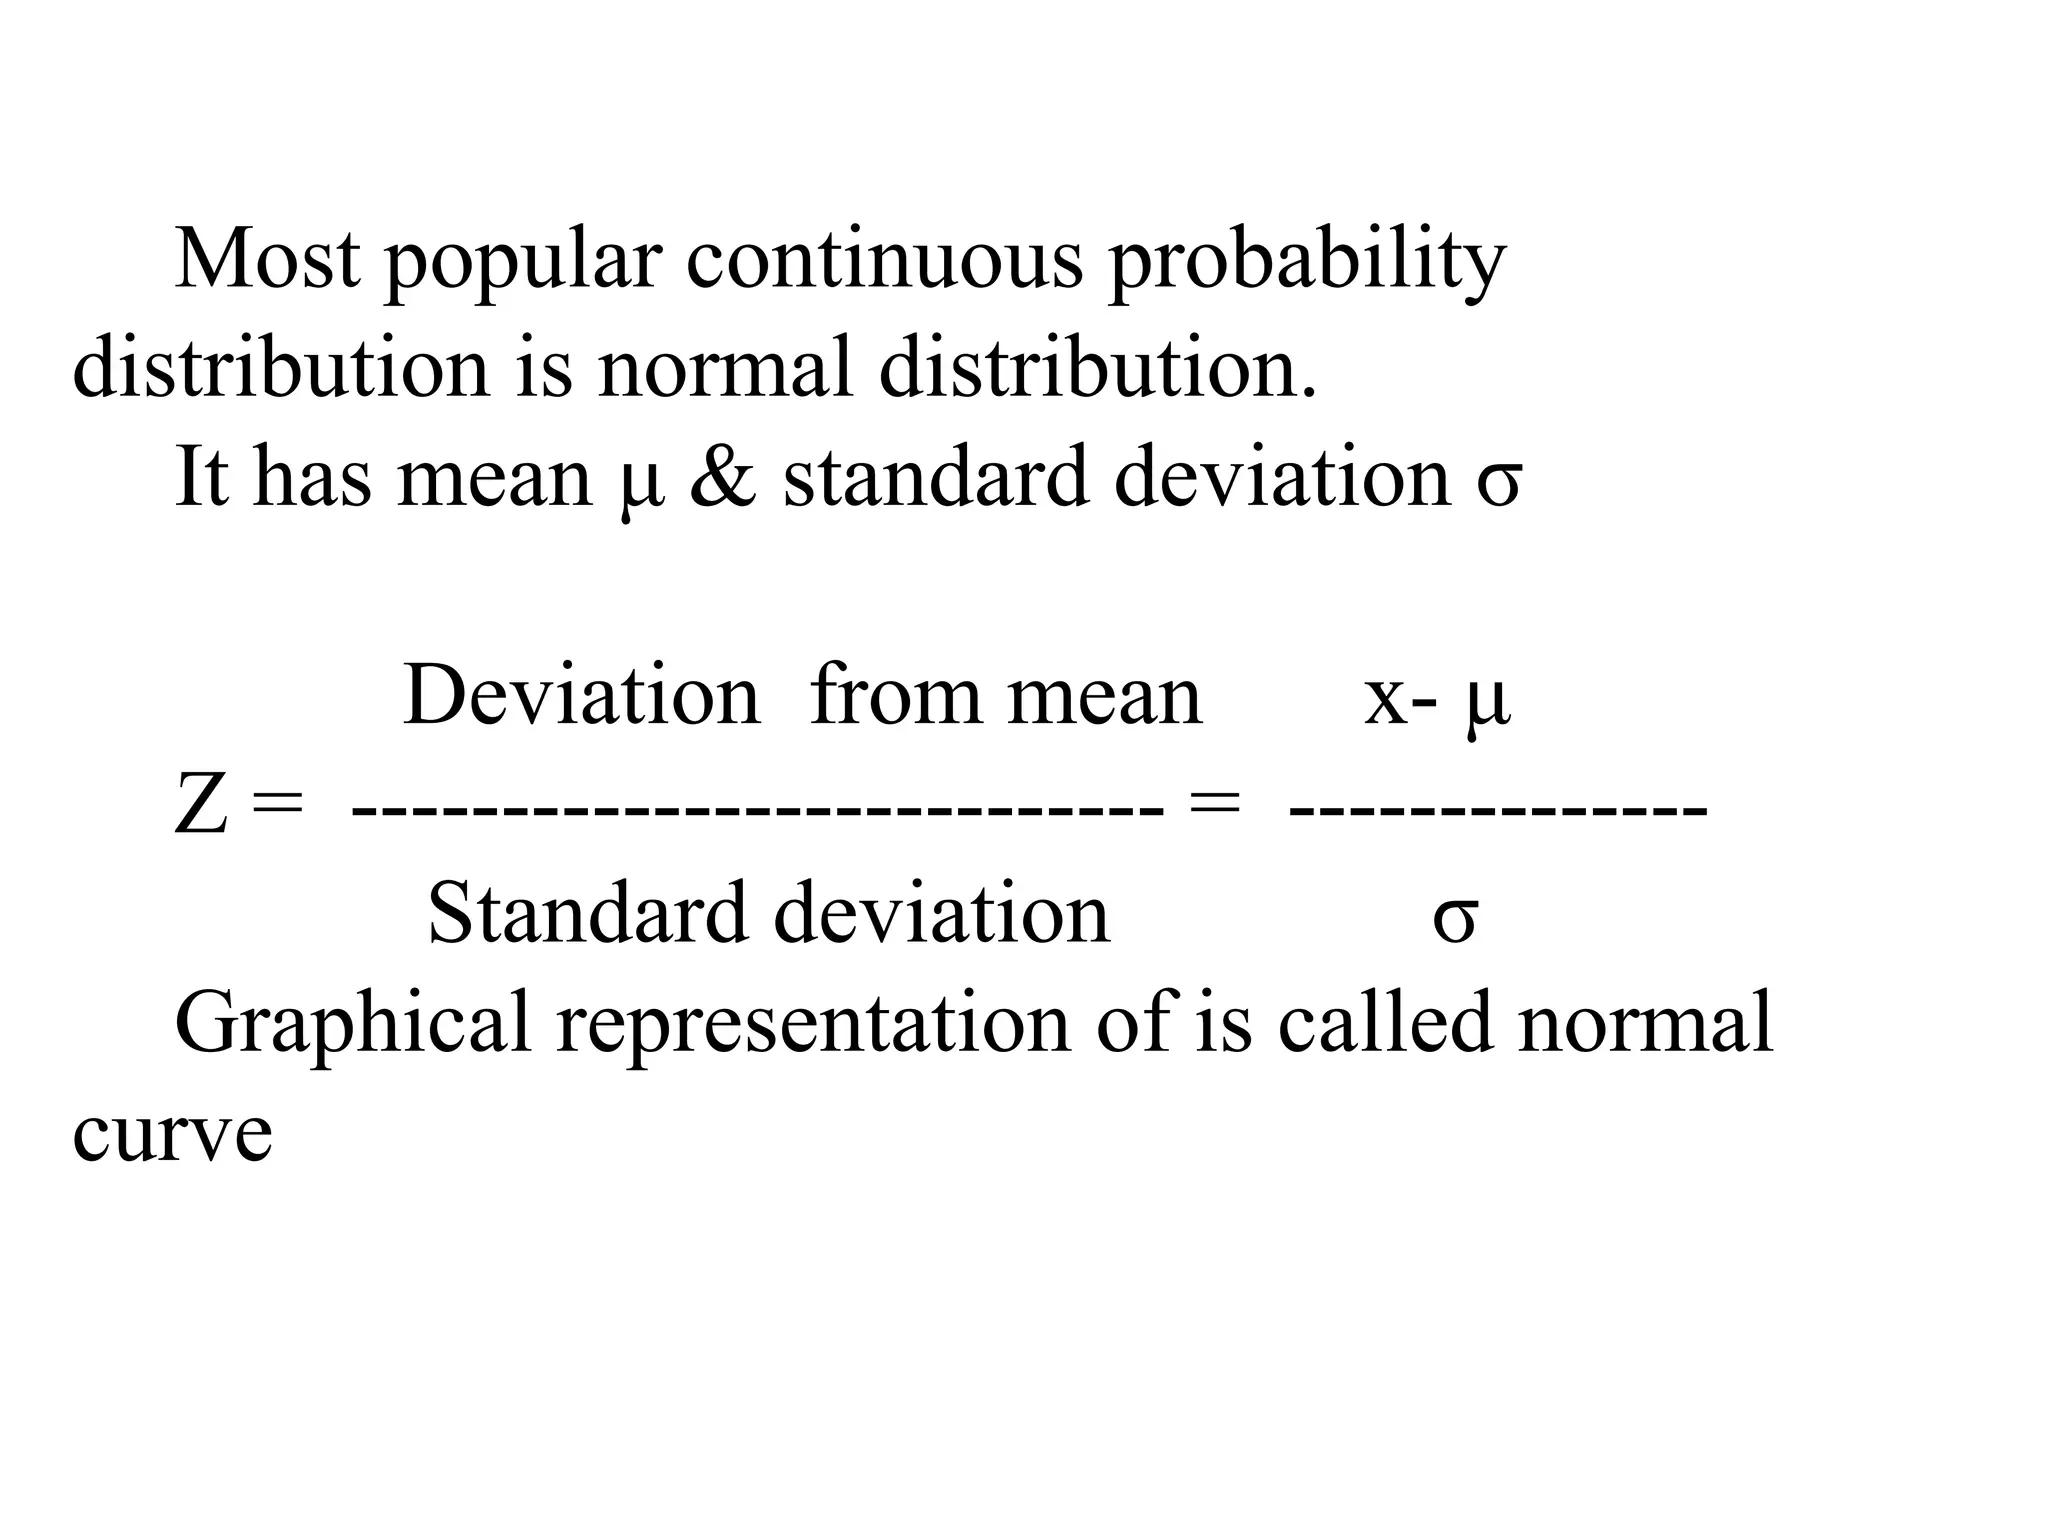
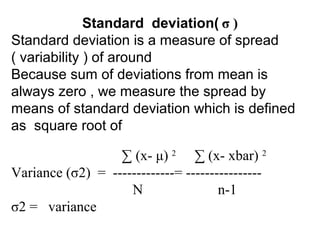
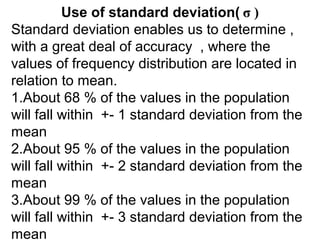
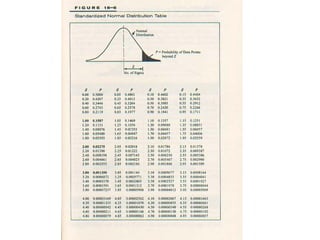
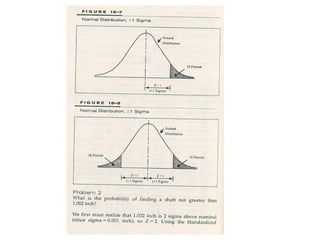
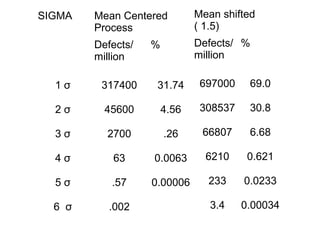
The document discusses the normal distribution and standard deviation. Some key points: 1. The normal distribution is the most common continuous probability distribution and is characterized by a mean (μ) and standard deviation (σ). It is graphically represented by a normal curve. 2. The standard deviation is a measure of how spread out values are from the mean. About 68% of values fall within 1 standard deviation of the mean, 95% within 2 standard deviations, and 99% within 3 standard deviations. 3. Standard deviation has various interpretations including a measure of variation in a population or a process's ability to meet requirements. It enables determining where values are located in relation to the mean with accuracy.


![Week7 Quiz Help 2009[1]](https://cdn.slidesharecdn.com/ss_thumbnails/week7quizhelp20091-091012152329-phpapp02-thumbnail.jpg?width=640&height=640&fit=bounds)


