Downloaded 197 times


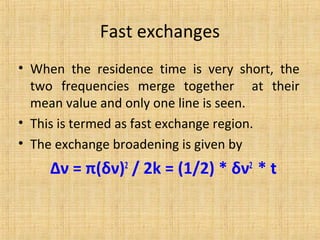
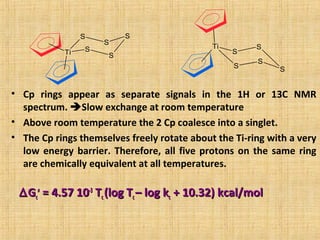
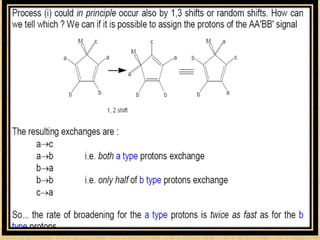
![Example 2 (Con’t)Example 2 (Con’t)
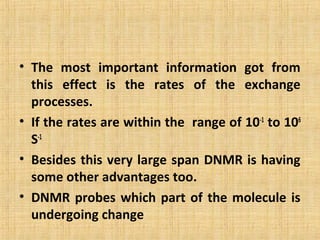
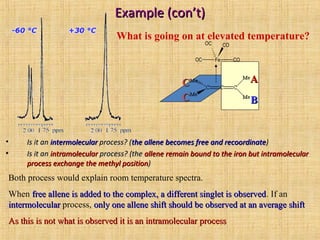
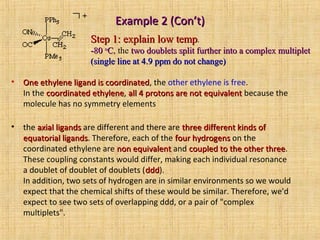
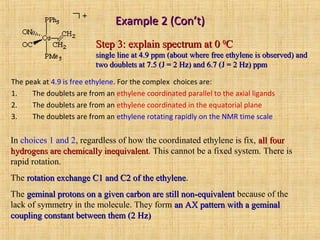
• Observed data is consistent with exchange with free ethylenewith exchange with free ethylene and
rapid rotation in the complexrapid rotation in the complex. We observe an averaged peak atan averaged peak at
6.0 ppm6.0 ppm.
There is an equimolar amount ofequimolar amount of complexcomplex andand free ethylenefree ethylene:
Complex: 2 H at 7.5 ppm, 2H at 6.7 ppm
Free ethylene: 4 H at 4.9 ppm.
The weighted average of these isThe weighted average of these is
[(2)(7.57.5) + 2(6.76.7) + 4(4.94.9)]/8 = 6.0 ppm, exactly where we see our6.0 ppm, exactly where we see our
peakpeak.
Step 2: explain high tempStep 2: explain high temp.
single sharp line at 6.0 ppmsingle sharp line at 6.0 ppm](https://image.slidesharecdn.com/san-nmr-dynamic-130928135145-phpapp02/85/Dynamic-NMR-50-320.jpg)


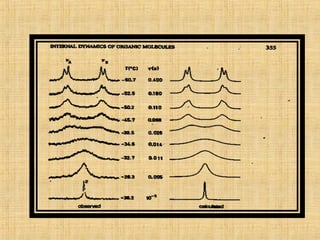
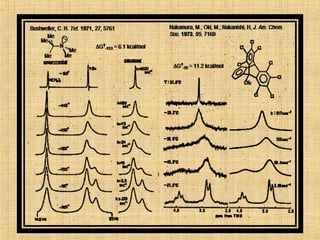
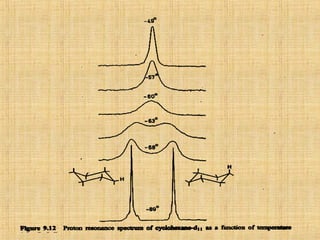
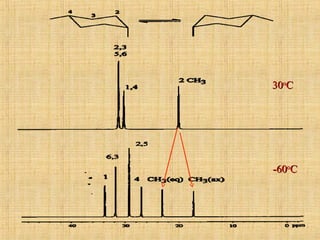
The document discusses dynamic NMR (DNMR), which deals with the effects of chemical environmental changes on NMR spectra. DNMR can provide information about exchange rates between sites with different chemical shifts or coupling constants. The timescale of NMR (10-1 to 10-9 seconds) makes it well-suited for studying molecular dynamics. DNMR techniques like variable temperature NMR can provide kinetic and thermodynamic information about exchange processes. Specific examples discussed include symmetrical and unsymmetrical two-site exchange, ring inversion, fluxional molecules, and inter-intramolecular exchanges.


![UV SPECTROSCOPY [ULTRA-VIOLET SPECTROSCOPY]](https://cdn.slidesharecdn.com/ss_thumbnails/40-191218142647-thumbnail.jpg?width=640&height=640&fit=bounds)


