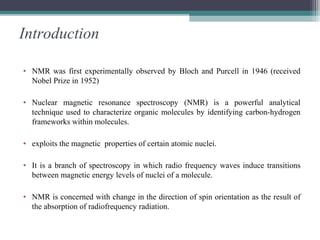
NMR spectroscopy exploits the magnetic properties of atomic nuclei to characterize organic molecules. It works by applying a strong magnetic field to align nuclear spins, and then applying a radiofrequency pulse to induce transitions between spin states. This allows identification of carbon-hydrogen frameworks within molecules. The NMR spectrum provides information on chemical environments and molecular structure through properties like chemical shift, spin-spin splitting, integration, and coupling constants. Developments include 2D NMR, deuterium labeling, and Fourier transform NMR for improved resolution and sensitivity.

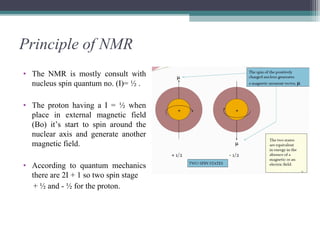
![If a nucleus having a magnetic moment is introduced into a magnetic field , B0, the
two energy levels become separate corresponding to mI = -1/2 and mI = +1/2
For a nucleus with I = 1/2, the energies E1 and E2 for the two states with mI = +1/2
and mI = -1/2 , respectively, are
E1 = -1/2 [ γ h / 2π ] B0
E2 = + 1/2 [ γ h / 2π ] B0
Gyromagnetic ratio, γ, is a constant for each nucleus (26,753 s-1
gauss-1
for H).
relationship:
ν = E2 – E1 / h
ν = 1/2 [ γ h / 2π ] B0 + 1/2 [ γ h / 2π] B0 / h ( or )
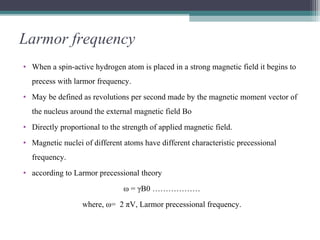
ν= γ / 2πB0
This is the Larmor equation](https://image.slidesharecdn.com/shahedanmr-180711184938/85/NMR-Nuclear-Magnetic-Resonance-5-320.jpg)