Downloaded 248 times


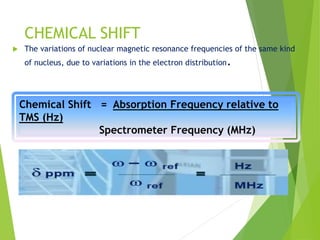
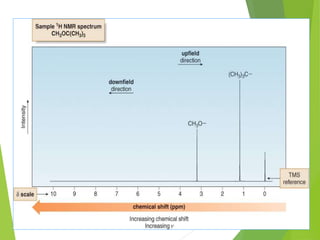
![ The relative energy of resonance of a particular nucleus resulting from its local
environment is called chemical shift.
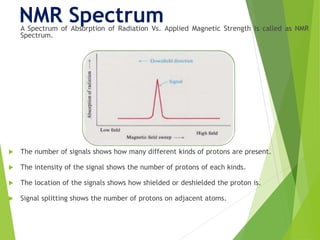
NMR spectra show applied field strength increasing from left to right, Left part
is downfield, the right is upfield.
Nuclei that absorb on upfield side are strongly shielded where nuclei that absorb
on downfield side is weakly shielded.
Chart calibrated versus a reference point, set as 0, tetramethylsilane [TMS].](https://image.slidesharecdn.com/nmr-181202082625/85/NMR-15-320.jpg)


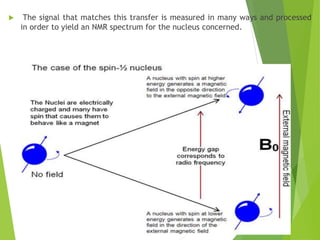
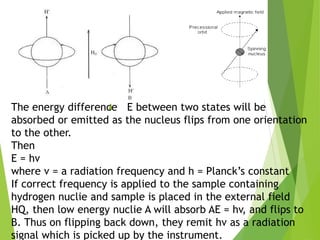
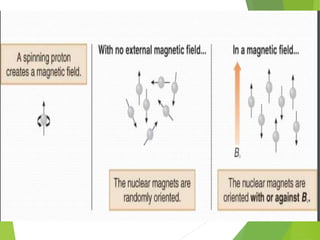
This document provides an overview of NMR spectroscopy. It begins by explaining the fundamental principles, including that NMR spectroscopy detects the absorption of radio waves by atomic nuclei placed in a magnetic field. It then discusses various aspects of interpreting NMR spectra such as chemical shifts, spin-spin coupling and integrals. The document also covers NMR techniques including Fourier transformation, 2D NMR, and relaxation processes. In summary, the document serves as an introduction to NMR spectroscopy and the principles behind analyzing NMR spectral data.


