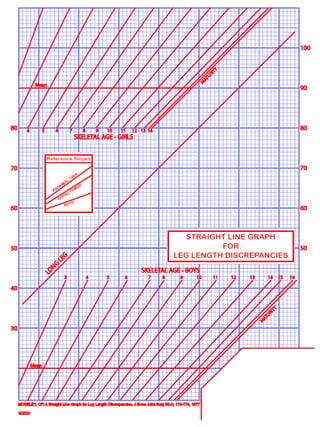
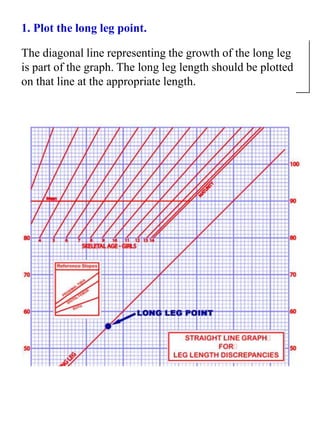
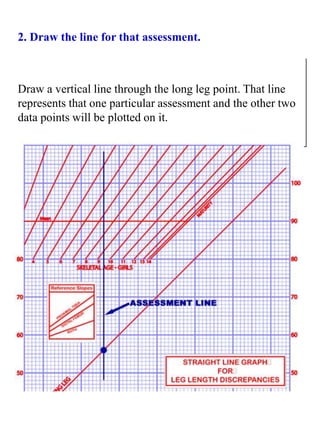
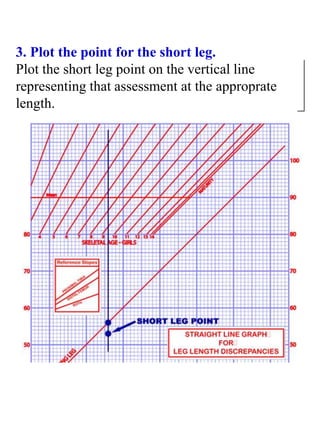
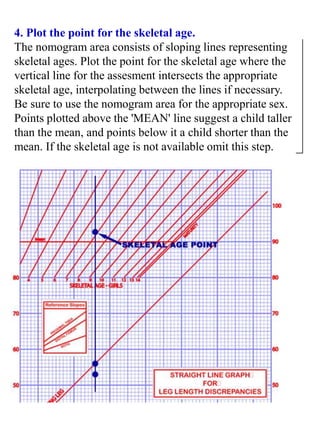
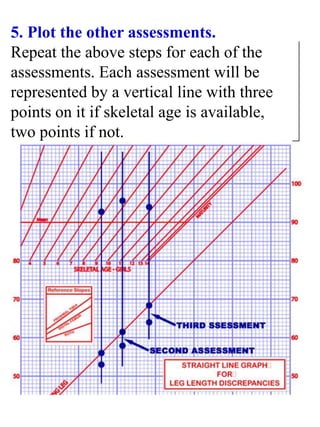
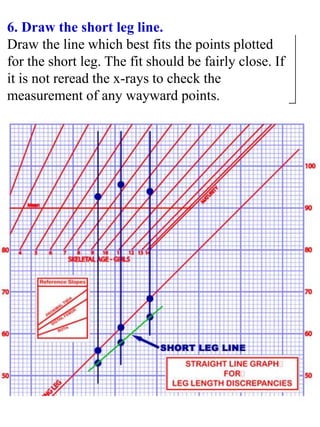
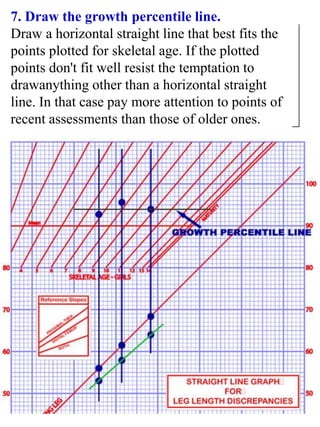
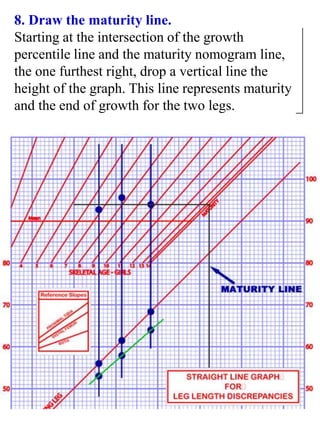
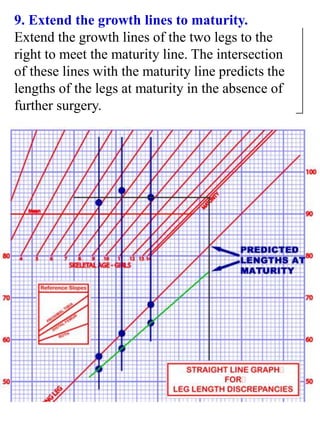
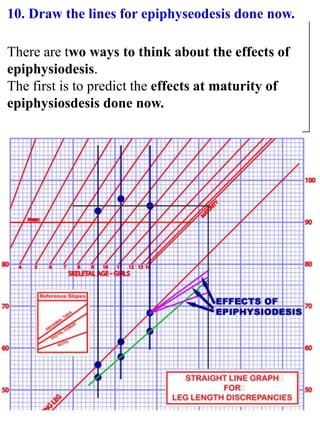
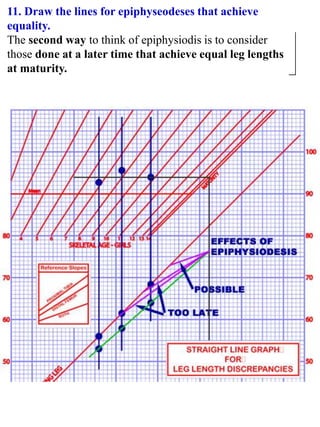
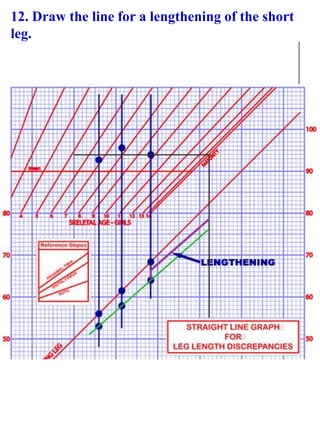
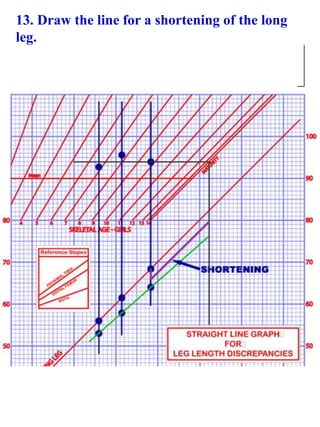
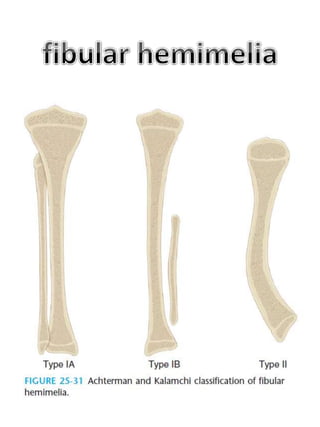
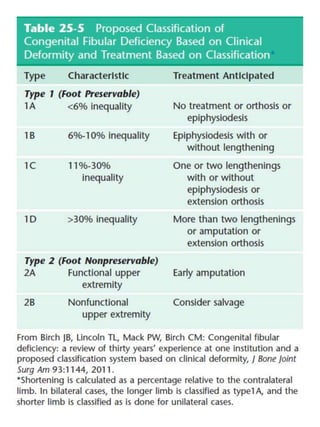
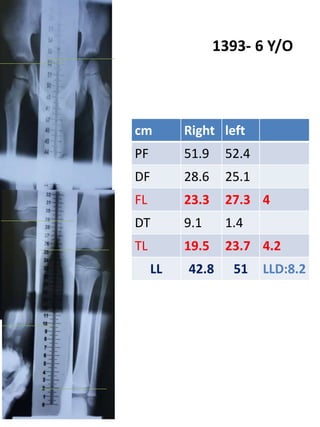
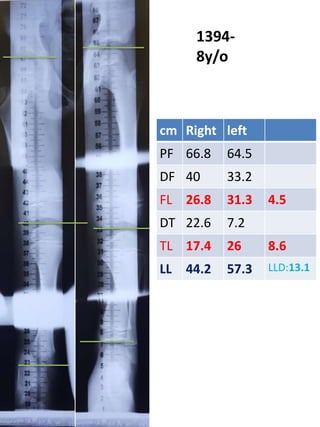
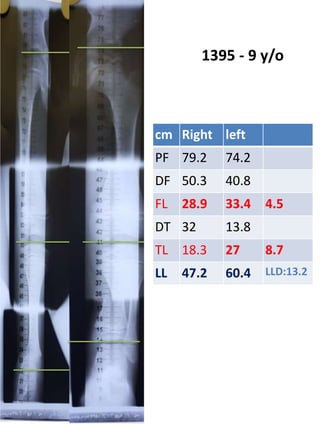
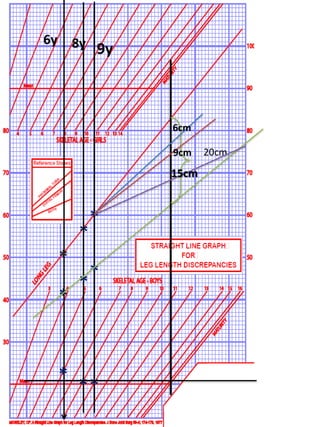
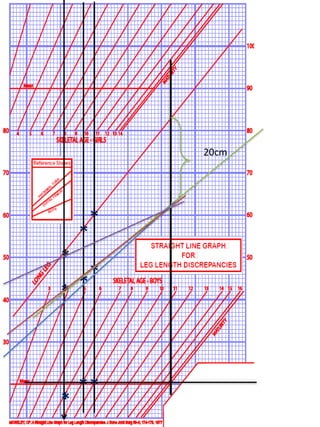
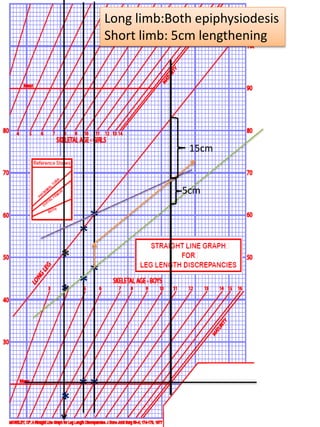
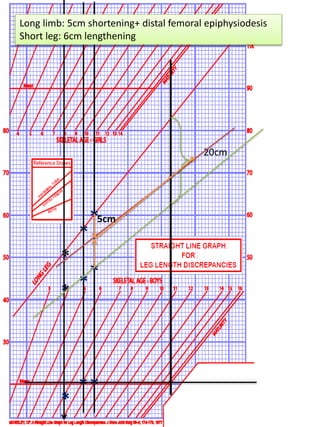
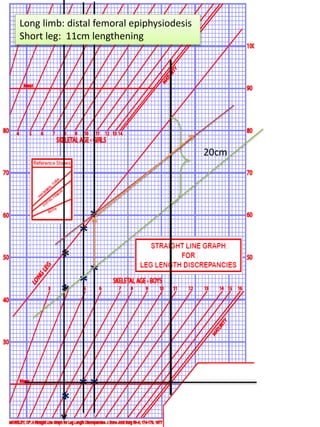
Dr. m. Dehnokhalaji
Orthopaedic surgeon
TUMS
• Advantages
• lower radiation exposure
• greater accuracy,
• less susceptibility to error if the patient is poorly
positioned,
• the ability to accommodate positioning difficulties
econdary to joint contractures or the presence of external
fixators.
• specifically indicated when the patient has a knee flexion
contracture or is in a circular external fixator .
• growth cessation to age 16 for
boys and age 14 for girls .
• Moseley in 1977 described a straight-
line graph method for calculating the
ultimate discrepancy in a skeletally
immature child and determining the
timing of long-leg epiphysiodesis to
correct leg length inequality.
• The purpose of Moseley’s graph was to
simplify and improve the accuracy of
calculations intended to estimate the
ultimate discrepancy in growing
children by incorporating into the
calculations skeletal maturation based
on hand-wrist bone films, growth
inhibition, and relative size.
1. Plot the long leg point.
The diagonal line representing the growth of the long leg
is part of the graph. The long leg length should be plotted
on that line at the appropriate length.
2. Draw the line for that assessment.
Draw a vertical line through the long leg point. That line
represents that one particular assessment and the other two
data points will be plotted on it.
3. Plot the point for the short leg.
Plot the short leg point on the vertical line
representing that assessment at the approprate
length.
4. Plot the point for the skeletal age.
The nomogram area consists of sloping lines representing
skeletal ages. Plot the point for the skeletal age where the
vertical line for the assesment intersects the appropriate
skeletal age, interpolating between the lines if necessary.
Be sure to use the nomogram area for the appropriate sex.
Points plotted above the 'MEAN' line suggest a child taller
than the mean, and points below it a child shorter than the
mean. If the skeletal age is not available omit this step.
5. Plot the other assessments.
Repeat the above steps for each of the
assessments. Each assessment will be
represented by a vertical line with three
points on it if skeletal age is available,
two points if not.
6. Draw the short leg line.
Draw the line which best fits the points plotted
for the short leg. The fit should be fairly close. If
it is not reread the x-rays to check the
measurement of any wayward points.
7. Draw the growth percentile line.
Draw a horizontal straight line that best fits the
points plotted for skeletal age. If the plotted
points don't fit well resist the temptation to
drawanything other than a horizontal straight
line. In that case pay more attention to points of
recent assessments than those of older ones.
8. Draw the maturity line.
Starting at the intersection of the growth
percentile line and the maturity nomogram line,
the one furthest right, drop a vertical line the
height of the graph. This line represents maturity
and the end of growth for the two legs.
9. Extend the growth lines to maturity.
Extend the growth lines of the two legs to the
right to meet the maturity line. The intersection
of these lines with the maturity line predicts the
lengths of the legs at maturity in the absence of
further surgery.
10. Draw the lines for epiphyseodesis done now.
There are two ways to think about the effects of
epiphysiodesis.
The first is to predict the effects at maturity of
epiphysiosdesis done now.
11. Draw the lines for epiphyseodeses that achieve
equality.
The second way to think of epiphysiodis is to consider
those done at a later time that achieve equal leg lengths
at maturity.
12. Draw the line for a lengthening of the short
leg.
13. Draw the line for a shortening of the long
leg.
Treatment
• Mild to Moderate Fibular Hemimelia
• Amputation or Limb Lengthening.
• depends on the degree of predicted shortening at
maturity and the condition of the foot and ankle of
the affected limb.
• The Birch classification is useful in planning
treatment.
• If the predicted discrepancy at maturity is 25 cm or
more and there is severe valgus of the ankle with a
deformed foot, the patient should be treated with a
Syme or Boyd amputation and prosthetic
management.
• If the patient has a predicted shortening of 8 cm or
less, a functional plantigrade foot with four or more
rays, and a stable and mobile ankle, he or she is a
good candidate for a lengthening procedure with or
without epiphysiodesis.
• The choice of amputation or lengthening for children
who fall in between the criteria identified earlier must
be made on an individual basis.
• Severe Fibular Hemimelia
• Amputation.
• Today, the consensus is that ankle
disarticulation is the best treatment
for more severe fibular hemimelia.
• modified Syme amputation , the
Boyd amputation
• The optimal time to perform the
amputation is when the child is just
starting to pull up to stand
(normally, 9 to 10 months of age).
• Limb Lengthening.
• Improved techniques have renewed
interest in limb lengthening procedures to
treat deformities and limb length inequality
in children with severe fibular hemimelia
• Patients whose discrepancies are less than
5 cm at birth and who do not have
significant foot deformities may be
suitable candidates;
• For patients whose limb length
discrepancies at birth are greater than 5
cm and who are predicted to have more
than 30% relative discrepancy, and for
those who have notable foot deformities,
we concur with Kruger and Birch that the
most appropriate treatment consists of
amputation and prosthetic management.
1393- 6 Y/O
cm Right left
PF 51.9 52.4
DF 28.6 25.1
FL 23.3 27.3 4
DT 9.1 1.4
TL 19.5 23.7 4.2
LL 42.8 51 LLD:8.2
cm Right left
PF 66.8 64.5
DF 40 33.2
FL 26.8 31.3 4.5
DT 22.6 7.2
TL 17.4 26 8.6
LL 44.2 57.3 LLD:13.1
1394-
8y/o
cm Right left
PF 79.2 74.2
DF 50.3 40.8
FL 28.9 33.4 4.5
DT 32 13.8
TL 18.3 27 8.7
LL 47.2 60.4 LLD:13.2
1395 - 9 y/o
*
*
*
*
*
*
*
*
*
20cm
6cm
9cm
15cm
6y 8y 9y
*
*
*
*
*
*
*
*
*
20cm
*
*
*
*
*
*
*
*
*
15cm
5cm
Long limb:Both epiphysiodesis
Short limb: 5cm lengthening
*
*
*
*
*
*
*
*
*
20cm
Long limb: 5cm shortening+ distal femoral epiphysiodesis
Short leg: 6cm lengthening
5cm
*
*
*
*
*
*
*
*
*
20cm
Long limb: distal femoral epiphysiodesis
Short leg: 11cm lengthening
limb length discrepancy

limb length discrepancy

  • 1.
  • 6.
    • Advantages • lowerradiation exposure • greater accuracy, • less susceptibility to error if the patient is poorly positioned, • the ability to accommodate positioning difficulties econdary to joint contractures or the presence of external fixators. • specifically indicated when the patient has a knee flexion contracture or is in a circular external fixator .
  • 10.
    • growth cessationto age 16 for boys and age 14 for girls .
  • 11.
    • Moseley in1977 described a straight- line graph method for calculating the ultimate discrepancy in a skeletally immature child and determining the timing of long-leg epiphysiodesis to correct leg length inequality. • The purpose of Moseley’s graph was to simplify and improve the accuracy of calculations intended to estimate the ultimate discrepancy in growing children by incorporating into the calculations skeletal maturation based on hand-wrist bone films, growth inhibition, and relative size.
  • 13.
    1. Plot thelong leg point. The diagonal line representing the growth of the long leg is part of the graph. The long leg length should be plotted on that line at the appropriate length.
  • 14.
    2. Draw theline for that assessment. Draw a vertical line through the long leg point. That line represents that one particular assessment and the other two data points will be plotted on it.
  • 15.
    3. Plot thepoint for the short leg. Plot the short leg point on the vertical line representing that assessment at the approprate length.
  • 16.
    4. Plot thepoint for the skeletal age. The nomogram area consists of sloping lines representing skeletal ages. Plot the point for the skeletal age where the vertical line for the assesment intersects the appropriate skeletal age, interpolating between the lines if necessary. Be sure to use the nomogram area for the appropriate sex. Points plotted above the 'MEAN' line suggest a child taller than the mean, and points below it a child shorter than the mean. If the skeletal age is not available omit this step.
  • 17.
    5. Plot theother assessments. Repeat the above steps for each of the assessments. Each assessment will be represented by a vertical line with three points on it if skeletal age is available, two points if not.
  • 18.
    6. Draw theshort leg line. Draw the line which best fits the points plotted for the short leg. The fit should be fairly close. If it is not reread the x-rays to check the measurement of any wayward points.
  • 19.
    7. Draw thegrowth percentile line. Draw a horizontal straight line that best fits the points plotted for skeletal age. If the plotted points don't fit well resist the temptation to drawanything other than a horizontal straight line. In that case pay more attention to points of recent assessments than those of older ones.
  • 20.
    8. Draw thematurity line. Starting at the intersection of the growth percentile line and the maturity nomogram line, the one furthest right, drop a vertical line the height of the graph. This line represents maturity and the end of growth for the two legs.
  • 21.
    9. Extend thegrowth lines to maturity. Extend the growth lines of the two legs to the right to meet the maturity line. The intersection of these lines with the maturity line predicts the lengths of the legs at maturity in the absence of further surgery.
  • 22.
    10. Draw thelines for epiphyseodesis done now. There are two ways to think about the effects of epiphysiodesis. The first is to predict the effects at maturity of epiphysiosdesis done now.
  • 23.
    11. Draw thelines for epiphyseodeses that achieve equality. The second way to think of epiphysiodis is to consider those done at a later time that achieve equal leg lengths at maturity.
  • 24.
    12. Draw theline for a lengthening of the short leg.
  • 25.
    13. Draw theline for a shortening of the long leg.
  • 29.
    Treatment • Mild toModerate Fibular Hemimelia • Amputation or Limb Lengthening. • depends on the degree of predicted shortening at maturity and the condition of the foot and ankle of the affected limb. • The Birch classification is useful in planning treatment. • If the predicted discrepancy at maturity is 25 cm or more and there is severe valgus of the ankle with a deformed foot, the patient should be treated with a Syme or Boyd amputation and prosthetic management. • If the patient has a predicted shortening of 8 cm or less, a functional plantigrade foot with four or more rays, and a stable and mobile ankle, he or she is a good candidate for a lengthening procedure with or without epiphysiodesis. • The choice of amputation or lengthening for children who fall in between the criteria identified earlier must be made on an individual basis.
  • 30.
    • Severe FibularHemimelia • Amputation. • Today, the consensus is that ankle disarticulation is the best treatment for more severe fibular hemimelia. • modified Syme amputation , the Boyd amputation • The optimal time to perform the amputation is when the child is just starting to pull up to stand (normally, 9 to 10 months of age).
  • 31.
    • Limb Lengthening. •Improved techniques have renewed interest in limb lengthening procedures to treat deformities and limb length inequality in children with severe fibular hemimelia • Patients whose discrepancies are less than 5 cm at birth and who do not have significant foot deformities may be suitable candidates; • For patients whose limb length discrepancies at birth are greater than 5 cm and who are predicted to have more than 30% relative discrepancy, and for those who have notable foot deformities, we concur with Kruger and Birch that the most appropriate treatment consists of amputation and prosthetic management.
  • 32.
    1393- 6 Y/O cmRight left PF 51.9 52.4 DF 28.6 25.1 FL 23.3 27.3 4 DT 9.1 1.4 TL 19.5 23.7 4.2 LL 42.8 51 LLD:8.2
  • 33.
    cm Right left PF66.8 64.5 DF 40 33.2 FL 26.8 31.3 4.5 DT 22.6 7.2 TL 17.4 26 8.6 LL 44.2 57.3 LLD:13.1 1394- 8y/o
  • 34.
    cm Right left PF79.2 74.2 DF 50.3 40.8 FL 28.9 33.4 4.5 DT 32 13.8 TL 18.3 27 8.7 LL 47.2 60.4 LLD:13.2 1395 - 9 y/o
  • 35.
  • 36.
  • 37.
  • 38.
    * * * * * * * * * 20cm Long limb: 5cmshortening+ distal femoral epiphysiodesis Short leg: 6cm lengthening 5cm
  • 39.
    * * * * * * * * * 20cm Long limb: distalfemoral epiphysiodesis Short leg: 11cm lengthening