Downloaded 210 times


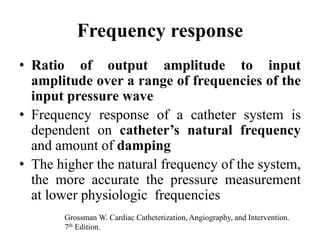


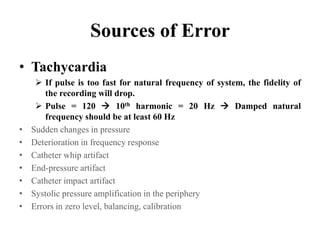


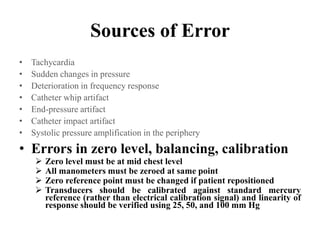


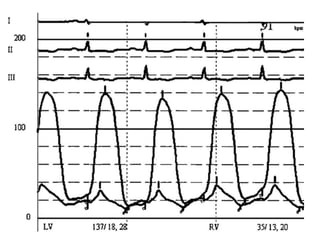
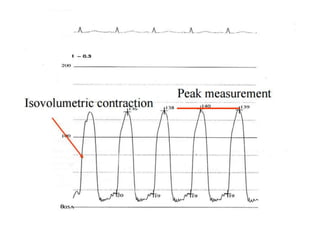


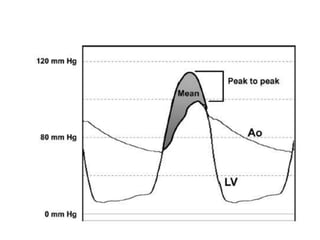


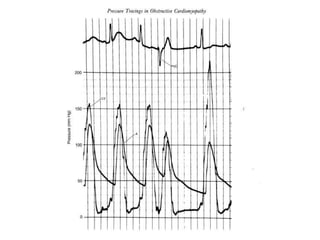
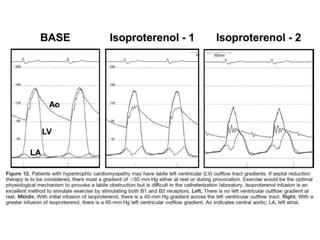


1) Pressure tracing of the left ventricle involves using fluid-filled catheters connected to pressure transducers to record intracardiac pressures. Factors such as catheter size, damping, and natural frequency determine recording quality. 2) Sources of error in pressure measurements include catheter whip, end-pressure artifacts, and deterioration of frequency response. Invasive monitoring is useful for evaluating conditions like aortic stenosis and mitral stenosis when noninvasive data is discrepant or unclear. 3) Distinguishing constrictive pericarditis from restrictive cardiomyopathy involves assessing ventricular interdependence, pulmonary pressures, and left ventricular pressure tracings. Hemodynamic data aids in diagnosis and management of many conditions.


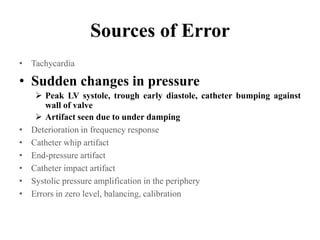
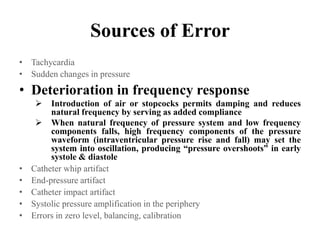
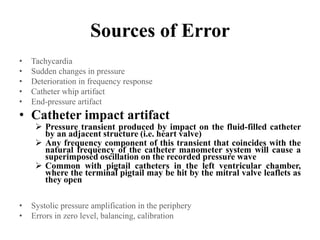
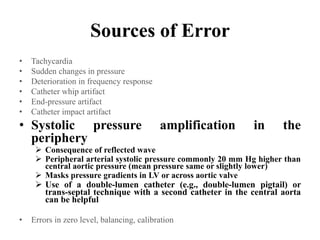
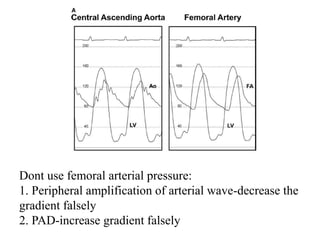
![PERI-PROSTHETIC FRACTURE NAIL-PLATE CONSTRUCT [NPC].pptx](https://cdn.slidesharecdn.com/ss_thumbnails/drarunkumardrmohamedashrafperiprostheticfrasturenail-plateconstructnpc-260209164459-7e9d15a1-thumbnail.jpg?width=640&height=640&fit=bounds)


