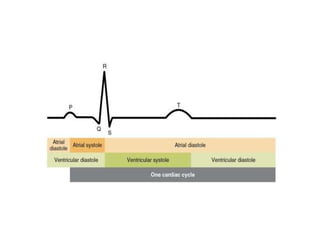
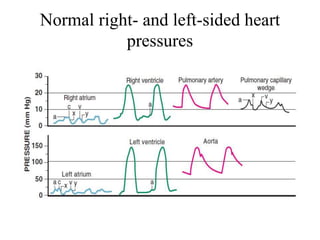
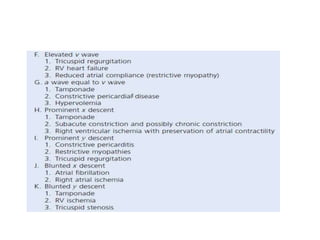
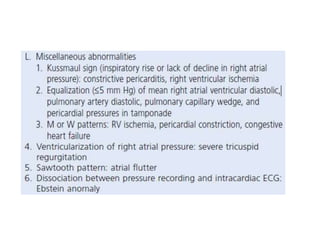
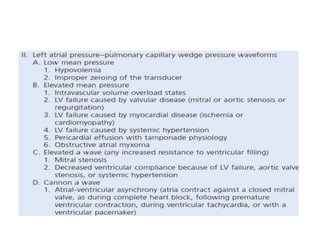
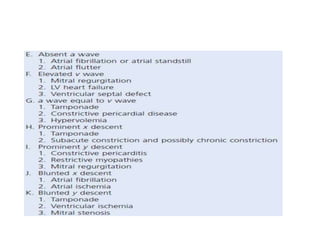
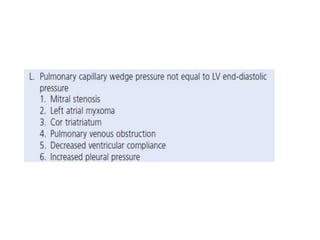
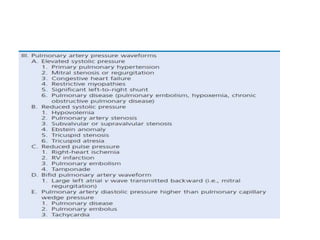
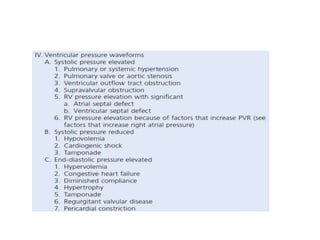
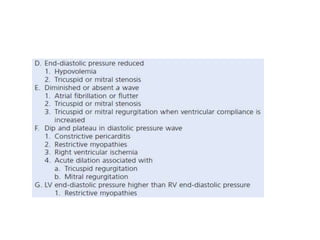
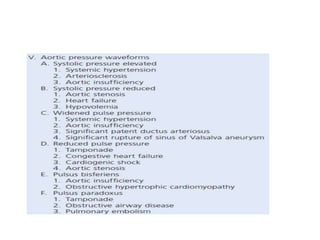
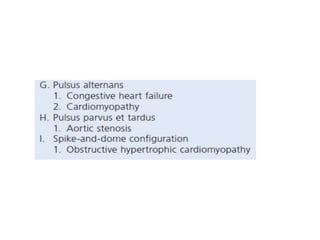
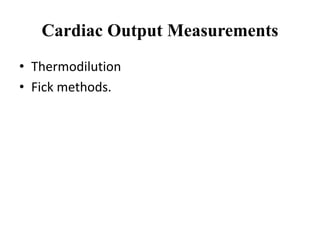
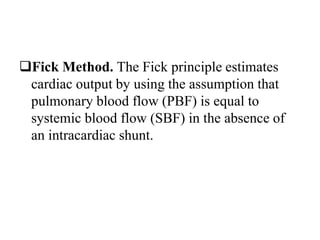
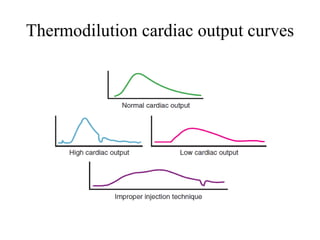
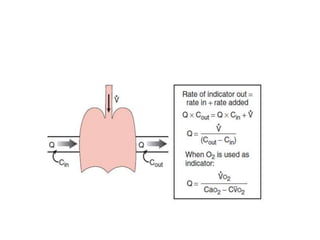
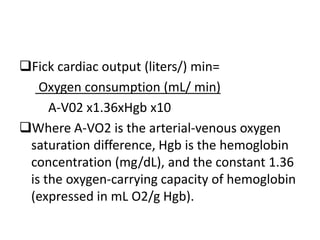
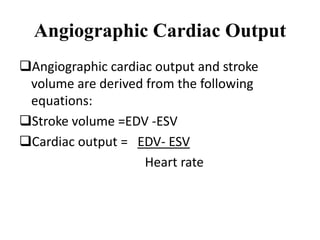
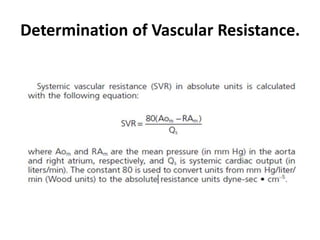
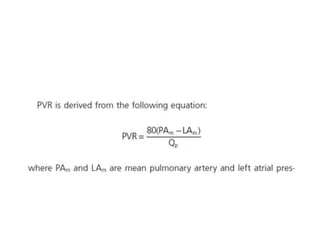
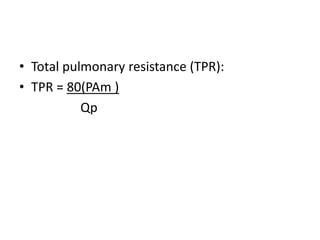
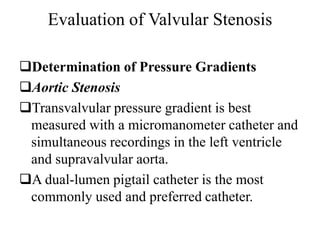
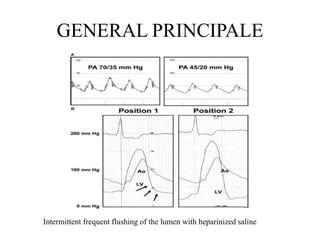
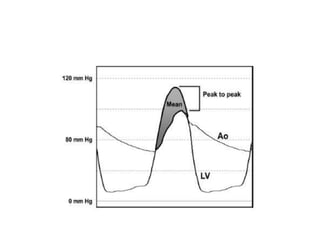
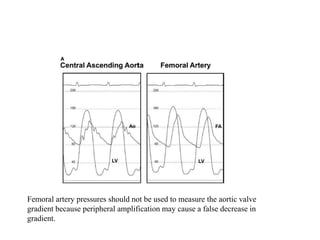
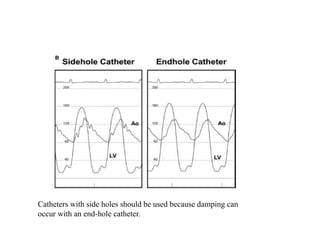
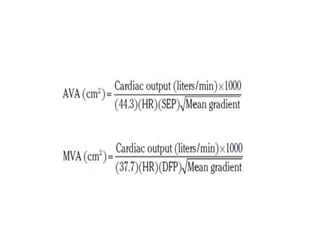
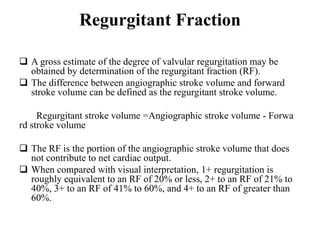
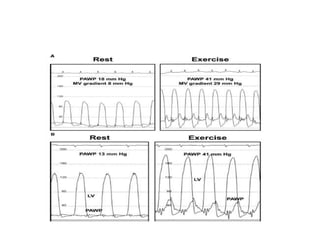
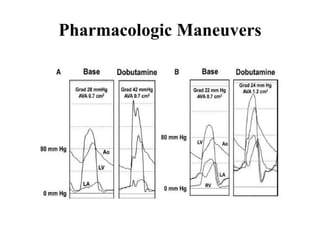
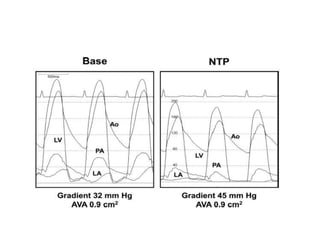
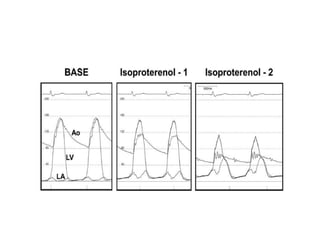
The document summarizes key aspects of cardiac catheterization and hemodynamic data collection. It describes the normal cardiac cycle, pressure measurement systems, normal pressure waveforms, methods to measure cardiac output like thermodilution and Fick, how to evaluate valvular stenosis and regurgitation, determine vascular resistance and shunts. Specific details are provided on assessing aortic stenosis, mitral stenosis, right-sided valves and quantifying regurgitant fractions. Oxygen saturation analysis and Fick principles are outlined for shunt determinations.
2. Cardiac cycle
• The first stage, " diastole," is when the semilunar
valves (the pulmonary valve and the aortic valve) close,
theatrioventricular (AV) valves (the mitral valve and the tricuspid
valve) open, and the whole heart is relaxed.
• The second stage, "atrial systole," is when the atrium contracts, and
blood flows from atrium to the ventricle.
• The third stage, "isovolumic contraction" is when the ventricles
begin to contract, the AV and semilunar valves close, and there is no
change in volume.
• The fourth stage, "ventricular ejection," is when the ventricles are
contracting and emptying, and the semilunar valves are open.
• During the fifth stage, "isovolumic relaxation time", pressure
decreases, no blood enters the ventricles, the ventricles stop
contracting and begin to relax, and the semilunar valves close due to
the pressure of blood in the aorta.
3.
4.
5.
6.
7. HEMODYNAMIC DATA
The hemodynamic component of the cardiac
catheterization procedure-
Pressure measurements
Measurement of flow (e.g., cardiac output, shunt
flow, flow across a stenotic orifice, regurgitant
flow, and coronary blood flow)
Determination of vascular resistance.
8. Pressure Measurement Systems
• Fluid-Filled Systems. Intravascular pressure is
typically measured with the use of a fluid-filled
catheter attached to a pressure transducer.
• The pressure wave is transmitted from the tip of
the catheter to the transducer by the fluid
column within the catheter.
• Most pressure transducers are disposable
electrical strain gauges. The pressure wave
distorts the diaphragm or wire within the
transducer. This energy
9. The pressure transducer must be calibrated
against a known pressure, and establishment of
a zero reference must be undertaken at the start
of the catheterization procedure.
To “zero” the transducer, the transducer is
placed at the level of the atria, which is
approximately midchest.
10. Micromanometer Catheters. Commercially
available high-fidelity micromanometer
systems have both an end hole and side holes
to allow over-the-wire insertion into the
circulation while also permitting angiography.
Catheters that have two transducers separated
by a short distance are useful for accurate
measurement of gradients across valvular
structures and within ventricular chambers.
13. Atrial Pressure
The right atrial pressure waveform has three positive
deflections, the a, c, and v waves.
The a wave is due to atrial systole and follows the P
wave on the ECG.
The height of the a wave depends on atrial contractility
and resistance to RV filling.
The x descent fo- represents relaxation of the atrium
and downward pulling of the tricuspid annulus by RV
contraction.
The x descent is interrupted by the c wave, which is a
small positive deflection caused by protrusion of the
closed tricuspid valve into the right atrium.
14. The v wave - represents RV systole.
The y descent occurs after the v wave and
reflects opening of the tricuspid valve and
emptying of the right atrium into the right
ventricle.
19. Ventricular Pressure
RV and LV waveforms are similar in morphology.
They differ mainly with respect to their
magnitudes.
The durations of systole and isovolumic
contraction and relaxation are longer and the
ejection period is shorter in the left than in the
right ventricle.
There may be a small (5 mm Hg) systolic gradient
between the right ventricle and pulmonary artery.
33. Fick Method. The Fick principle estimates
cardiac output by using the assumption that
pulmonary blood flow (PBF) is equal to
systemic blood flow (SBF) in the absence of
an intracardiac shunt.
36. Fick cardiac output (liters/) min=
Oxygen consumption (mL/ min)
A-V02 x1.36xHgb x10
Where A-VO2 is the arterial-venous oxygen
saturation difference, Hgb is the hemoglobin
concentration (mg/dL), and the constant 1.36
is the oxygen-carrying capacity of hemoglobin
(expressed in mL O2/g Hgb).
37. Angiographic Cardiac Output
Angiographic cardiac output and stroke
volume are derived from the following
equations:
Stroke volume =EDV -ESV
Cardiac output = EDV- ESV
Heart rate
41. Evaluation of Valvular Stenosis
Determination of Pressure Gradients
Aortic Stenosis
Transvalvular pressure gradient is best
measured with a micromanometer catheter and
simultaneous recordings in the left ventricle
and supravalvular aorta.
A dual-lumen pigtail catheter is the most
commonly used and preferred catheter.
44. Femoral artery pressures should not be used to measure the aortic valve
gradient because peripheral amplification may cause a false decrease in
gradient.
45. Catheters with side holes should be used because damping can
occur with an end-hole catheter.
46.
47. The peak-to-peak gradient measured in the
catheterization laboratory is generally lower
than the peak instantaneous gradient measured
in the echocardiography laboratory.
48. Patients with fixed obstruction (either valvular stenosis or fixed subvalvular
stenosis) will demonstrate a parvus and a tardus in the upstroke of the aortic
pressure,
Right, The left ventricular pressure also has a late peak because of the
mechanism of this dynamic obstruction. LA indicates left atrium.
49. Mitral Stenosis
The most accurate means of determining the mitral valve gradient is direct
measurement of left atrial pressure by the transseptal technique with
simultaneous measurement of LV pressure.
Pulmonary capillary wedge pressure is usually substituted for left atrial
pressure because it is more readily obtained.
Pulmonary wedge pressure may systematically overestimate left atrial
pressure by 2 to 3 mm Hg, thereby increasing the measured mitral valve
gradient.
Improperly wedged catheters resulting in damped pulmonary artery
pressure recordings further overestimate the severity of mitral stenosis.
If accurate positioning of the catheter in the wedge position is in doubt, the
position can be confirmed by slow withdrawal of blood for oximetric
analysis.
Oxygen saturation equal to that in the systemic circulation confirms the
wedge position.
50. Optimally performed with a large-bore end-hole catheter.
measurement.
Right, small-lumen thermodilution catheter. damped pulmonary
artery pressure.
51. The gradient using a pulmonary artery wedge pressure will frequently
overestimate the true transmitral gradient.
52.
53. Right-Sided Valvular Stenosis
In pulmonic stenosis, the valve gradient is
obtained by catheter pull-back from the
pulmonary artery to the right ventricle or by
placement of separate catheters in the right
ventricle and pulmonary artery.
Multi lumen catheters can also be used for
simultaneous pressure recordings.
Tricuspid valve gradients should be assessed with
simultaneous recording of right atrial and RV
pressure.
54.
55. Left, In this patient with restrictive cardiomyopathy, there is a drop in left
ventricular pressure and a drop in right ventricular pressure during inspiration
(Insp).
Right, In this patient with constrictive pericarditis, there is ventricular
discordance, with an increase in right ventricular pressure and a decrease in
left ventricular pressure during inspiration.
56.
57. Calculation of Stenotic Valve Orifice
Areas
Flow (F) and orifice area (A) are related by the fundamental formula
F=cAV
Hence,
A= F/cV =
The maximal discrepancy between the actual mitral valve area and
calculated values was just 0.2 cm2 when the constant 0.85 was used.
No data were obtained for aortic valves, a limitation noted by the
Gorlins, and a constant of 1.0 was assumed.
58.
59. Assessment of Valvular Regurgitation
According to ACC/AHA guidelines,
hemodynamic evaluation of either aortic or
mitral regurgitant lesions is recommended as
a class I indication when pulmonary artery
pressure is disproportionate.
60. Visual Assessment of Regurgitation
Valvular regurgitation may be assessed
visually by determination of the relative
amount of radiographic contrast medium that
opacifies the chamber proximal to its injection.
Estimation of regurgitation depends on the
volume of regurgitant, as well as on the size
and contractility of the proximal chamber.
62. Regurgitant Fraction
A gross estimate of the degree of valvular regurgitation may be
obtained by determination of the regurgitant fraction (RF).
The difference between angiographic stroke volume and forward
stroke volume can be defined as the regurgitant stroke volume.
Regurgitant stroke volume =Angiographic stroke volume - Forwa
rd stroke volume
The RF is the portion of the angiographic stroke volume that does
not contribute to net cardiac output.
When compared with visual interpretation, 1+ regurgitation is
roughly equivalent to an RF of 20% or less, 2+ to an RF of 21% to
40%, 3+ to an RF of 41% to 60%, and 4+ to an RF of greater than
60%.
63. Shunt Determinations
Normally, PBF and SBF are equal.
Unexplained pulmonary artery oxygen saturation exceeding
80% should raise suspicion for a left-to-right shunt,
Unexplained arterial desaturation (<93%) may indicate a
right-to-left shunt.
Arterial desaturation commonly results from alveolar
hypoventilation and associated “physiologic shunting,”
causes of which include oversedation from premedication,
pulmonary disease, pulmonary venous congestion,
pulmonary edema, and cardiogenic shock.
If arterial desaturation persists after the patient takes several
deep breaths or after administration of 100% oxygen, a
right-to-left shunt is likely.
64. Oximetric Method
The oximetric method is based on blood sampling
from various cardiac chambers for determination
of oxygen saturation.
If the difference in oxygen saturation between
these samples is 8% or greater, a left-to-right
shunt may be present.
Oxygen saturation in the IVC is higher than in the
SVC because the kidneys have lower oxygen
extraction relative to their blood flow than other
organs do.
65. A full saturation run obtains samples from the
high and low IVC; high and low SVC; high,
middle, and low right atrium; RV inflow and
outflow tracts and midcavity; main pulmonary
artery; left or right pulmonary artery;
pulmonary vein and left atrium, if possible;
left ventricle; and distal aorta.
67. If a pulmonary vein is not sampled, systemic
arterial oxygen saturation may be substituted,
assuming that it is 95% or greater.
If systemic arterial saturation is less than 93%, a
right-to-left shunt may be present.
If arterial desaturation is present but not
secondary to a right-to-left shunt, systemic
arterial oxygen content is used.
If a right-to-left shunt is present, pulmonary
venous oxygen content is calculated as 98% of the
oxygen capacity.
68.
69.
70. A ratio of less than 1.5 indicates a small left-
to-right shunt.
A ratio of 1.5 to 2.0, a moderate-sized shunt.
A ratio of 2.0 or higher indicates a large left-
to-right shunt.
A flow ratio of less than 1.0 indicates a net
right-to-left shunt.
The cardiac cycle and phases of diastole. AC = aortic closure; AO = aortic opening; MC = mitral closure; MO = mitral opening; RA = right atrium; RV = right ventricle.
Flow through a blood vessel is determined by the pressure difference within the vessel
vascular resistance as described by Ohm’s law: Q = ΔP/R.
A, Optimal timing and arterial waveforms with an IABP. A systemic arterial pressure waveform is shown from a patient with a normally functioning IABP device that is programmed to inflate during every other cardiac cycle (commonly referred to as 1 : 2 inflation). With the first beat, aortic systolic and end-diastolic pressures are shown without IABP support and are therefore unassisted. With the second beat, the balloon inflates with the appearance of the dicrotic notch, and peak-augmented diastolic pressure is inscribed. With balloon deflation, assisted end-diastolic pressure and assisted systolic pressure are observed. To confirm that the IABP is producing maximal hemodynamic benefit, the peak diastolic augmentation should be greater than the unassisted systolic pressure, and the two assisted pressures should be less than the unassisted values. B, Systemic arterial pressure waveform from a subject in whom balloon inflation occurs too early, before aortic valve closure. Consequently, the left ventricle is forced to empty against an inflated balloon; the corresponding increase in afterload may increase myocardial oxygen demand and worsen systolic function. C, Systemic arterial pressure waveform from a patient in whom balloon inflation occurs too late, well after the beginning of diastole, thereby minimizing diastolic pressure augmentation. D, Systemic arterial pressure waveform from a patient in whom balloon deflation occurs too early, before the end of diastole. This may shorten the period of diastolic pressure augmentation. A corresponding transient decrease in aortic pressure may promote retrograde arterial flow from the carotid or coronary arteries and possibly induce cerebral or myocardial ischemia.
E, Systemic arterial pressure waveform from a subject in whom balloon deflation occurs too late, after the end of diastole, thereby producing the same deleterious consequences as early balloon inflation (increased LV afterload with a resultant increase in myocardial oxygen demand and worsening of systolic function).
Thermodilution cardiac output curves. A normal curve has a sharp upstroke after an injection of saline. A smooth curve with a mildly prolonged downslope occurs until it is back to baseline. The area under the curve is inversely related to cardiac output. At low cardiac output, a prolonged period is required to return to baseline. Therefore the area under the curve is larger. In a high cardiac output state, the cooler saline injectate moves faster through the right side of the heart, and temperature returns to baseline more quickly. The area under the curve is smaller and the output is higher.
Schematic illustration showing measurement of flow by the Fick principle. Fluid containing a known concentration of an indicator (Cin) enters a system at flow rate Q. As the fluid passes through the system, indicator is continuously added at rate V, thereby raising the concentration in the outflow to Cout. In a steady state the rate of indicator leaving the system (QCout ) must equal the rate at which it enters (QCin) plus the rate at which it is added (V). When oxygen is used as the indicator, cardiac output can be determined by measuring oxygen consumption (VO2), arterial oxygen content (CaO2), and mixed venous oxygen content (CvO2). (
Although it is convenient to measure the gradient between the left ventricle and the femoral artery through the sheath, downstream augmentation of the pressure signal and delay in transmission of pressure between the proximal aorta and femoral artery may alter the pressure waveform substantially and introduce errors into the measured gradient. The LV–femoral arterial pressure gradient may not always be relied on in the calculation of valve orifice area in patients with moderate valve gradients. If the side port of the arterial introducing sheath is used to monitor femoral pressure, the inner diameter of the sheath should be at least 1F larger than the outer diameter of the LV catheter. A careful single catheter pull-back from the left ventricle to the aorta can be preferable to simultaneous measurement of LV and femoral artery pressure.
It is necessary to assess pressure contours continually throughout the catheterization procedure to identify pressure artifacts
that may occur and lead to erroneous pressure measurements. A, The initial pulmonary artery (PA) pressure in this patient undergoing
evaluation of pulmonary hypertension is 70/35 mm Hg (left). However, during the procedure, it was noted that the pulmonary artery
pressure fell to 45/20 mm Hg in the absence of any other hemodynamic changes (right). This was due to the formation of a small
thrombus in the small distal lumen of a thermodilution catheter. This pressure artifact should be avoided by meticulous technique,
which includes constant monitoring of the pressure contour and intermittent frequent flushing of the lumen with heparinized saline.
Using larger-bore catheters may be necessary to overcome this problem if damping of pressures continues despite the use of these
techniques. B, In this patient with aortic stenosis, there is a pigtail catheter in the left ventricle (LV) and a separate catheter in the
ascending aorta (Ao). In position 1, the contour of the left ventricular pressure is abnormal, with a marked delay in the fall of pressure
during early diastole. This is due to some of the multiple side holes in the pigtail catheter straddling the aortic valve, resulting in a
fusion of left ventricular and aortic pressure. Because the abnormal contour is recognized, the catheter is placed further distally so that
all recording holes are in the left ventricle, as shown in position 2.
Simultaneous left ventricular (LV) and central aortic
(Ao) pressures in a patient with aortic stenosis. The optimal way
to measure the gradient in a patient with aortic stenosis is to
use these simultaneous pressures. The peak-to-peak gradient is
the difference between the peak left ventricular and peak aortic
pressures, which is a nonphysiological measurement because
the peak pressures occur at different points in time. The mean
pressure gradient (the integrated gradient between the left ventricular
and aortic pressure throughout the entire systolic ejection
period) should be used to determine the severity of the aortic
stenosis.
The optimal method to measure
the transaortic gradient in a patient with
aortic stenosis is a simultaneous left ventricular
(LV) pressure and central aortic
(Ao) pressure with side-hole catheters.
Shown are examples in which alternative
methods are used to obtain the pressures,
which produce erroneous results.
A, The simultaneous left ventricular and
femoral artery (FA) pressures should not
be used to measure the aortic valve gradient
because peripheral amplification
may cause a false decrease in gradient
and peripheral artery stenosis may cause
a false increase in gradient. There is also
a temporal delay when a femoral artery
pressure is used that will affect the calculation
of the mean gradient. In this
patient, the use of a femoral artery pressure
would significantly underestimate the
peak-to-peak gradient as a result of peripheral
amplification of the pressure.
B,
In the measurement of left ventricular and
aortic pressures, catheters with side holes
should be used because damping can
occur with an end-hole catheter (ie, coronary
artery catheters). Shown is the typical
damping that may occur in the aortic
pressure when an end-hole catheter
(right) is used compared with a side-hole
catheter (left).
Various methods of describing an aortic transvalvular gradient. The peak-to-peak gradient (47 mm Hg) is the difference between maximal pressure in the aorta (Ao) and maximal pressure in the left ventricle (LV). The peak instantaneous gradient (100 mm Hg) is the maximal pressure difference between the Ao and LV when the pressures are measured at the same moment (usually during early systole). The mean gradient (green shaded area) is the integral of the pressure difference between the LV and Ao during systole (60 mm Hg).
A visual assessment of the contour of
the aortic (Ao) and left ventricular (LV) pressures is
important during cardiac catheterization. Left,
Patients with fixed obstruction (either valvular stenosis
or fixed subvalvular stenosis) will demonstrate
a parvus and a tardus in the upstroke of the
aortic pressure, beginning at the time of aortic
valve opening. Right, In patients with a dynamic
obstruction (such as that found in hypertrophic
cardiomyopathy), the aortic pressure will rise rapidly
at the onset of aortic valve opening and then
develop a spike-and-dome contour as the obstruction
occurs in late systole. The left ventricular
pressure also has a late peak because of the
mechanism of this dynamic obstruction. LA indicates
left atrium.
The pulmonary artery wedge
pressure (PAWP) must be obtained meticulously
during cardiac catheterization,
optimally performed with a large-bore
end-hole catheter. Confirmation of the
pulmonary artery wedge pressure examining
the pressure contour for respiratory
variation and a 95% saturation is recommended
to ensure an accurate pressure
measurement. Left, Pulmonary artery
wedge pressure was taken with a largebore
7F balloon wedge catheter with a
98% saturation confirmation. There is
appropriate respiratory variation and a
proper contour of the pulmonary artery
wedge pressure. Right, The attempt at
pulmonary artery wedge pressure was
done with a small-lumen thermodilution
catheter. This most likely represents a
damped pulmonary artery pressure. Confirmation
by saturation was not
performed.
Measurement of the transmitral
gradient by cardiac catheterization is frequently
made with a simultaneous pulmonary
artery wedge pressure (PAWP) and
left ventricular (LV) pressure. However, as
a result of the delay in transmission of the
change in pressure contour and a phase
shift, the gradient using a pulmonary
artery wedge pressure will frequently
overestimate the true transmitral gradient.
Left, Simultaneous left ventricular and
pulmonary artery wedge pressure in a
patient with mitral stenosis. The measured
mean gradient is 15 mm Hg. Right,
In the same patient, the transmitral gradient
is measured with a left ventricular and
direct left atrial (LA) pressure. The true
mean transmitral gradient is only 6 mm Hg. Measurement of the transmitral
gradient by cardiac catheterization is frequently
made with a simultaneous pulmonary
artery wedge pressure (PAWP) and
left ventricular (LV) pressure. However, as
a result of the delay in transmission of the
change in pressure contour and a phase
shift, the gradient using a pulmonary
artery wedge pressure will frequently
overestimate the true transmitral gradient.
Left, Simultaneous left ventricular and
pulmonary artery wedge pressure in a
patient with mitral stenosis. The measured
mean gradient is 15 mm Hg. Right,
In the same patient, the transmitral gradient
is measured with a left ventricular and
direct left atrial (LA) pressure. The true
mean transmitral gradient is only 6 mm Hg.
Pressure gradient in a patient with mitral stenosis. Pressure in the left atrium (LA) exceeds pressure in the left ventricle (LV) during diastole, thereby producing a diastolic pressure gradient (green shaded area).
High-fidelity manometer-tipped catheters
in the left ventricle (LV) and right ventricle (RV)
during the respiratory cycle. Left, In this patient
with restrictive cardiomyopathy, there is a drop in
left ventricular pressure and a drop in right ventricular
pressure during inspiration (Insp). This indicates
that the elevation of ventricular filling pressures
is due to a myocardial restrictive disease.
Right, In this patient with constrictive pericarditis,
there is ventricular discordance, with an increase
in right ventricular pressure and a decrease in left
ventricular pressure during inspiration. This is due
to the enhancement of ventricular interaction and
dissociation of intrathoracic and intracardiac pressures.
Exp indicates expiration.
Response of the aortic pressure
after a long pause is useful in differentiating
between the fixed obstruction of valvular
aortic (Ao) stenosis and the dynamic
obstruction of hypertrophic cardiomyopathy.
A, In this patient with valvular aortic
stenosis, the beat after the premature
ventricular contraction (PVC) has an
increase in pulse pressure (P-P). B, In this
patient with hypertrophic cardiomyopathy,
there is a reduction in the pulse pressure
on the beat after the premature ventricular
contraction. LV indicates left ventricle;
LA, left atrium.
Where V is velocity of flow
c is a constant accounting for central streaming of fluid through an orifice, which tends to reduce the effective orifice size.
Velocity is related to the pressure gradient through the relationship V kg P= ()212 , where k is a constant accounting for frictional energy loss, g is acceleration as a result of gravity (980 cm/sec2), and ΔP is the mean pressure gradient (mm Hg). Substituting for V in the orifice area equation and combining c and k into one constant C,
LV and RV high-fidelity manometer pressure traces from two patients during expiration and inspiration. Both patients have early rapid filling and elevation and end-equalization of LV and RV pressure at end-expiration. A, Patient with surgically documented constrictive pericarditis. During inspiration there is an increase in the area of the RV pressure curve (pink shaded area) relative to expiration. The area of the LV pressure curve (green shaded area) decreases during inspiration in comparison to expiration. B, Patient with restrictive myocardial disease documented by endomyocardial biopsy. During inspiration there is a decrease in the area of the RV pressure curve (pink shaded area) relative to expiration. The area of the LV pressure curve (green shaded area) is unchanged during inspiration in comparison to expiration.
Exercise is frequently helpful in the cardiac catheterization laboratory to determine the cause of dyspnea in patients who do
not have marked abnormalities of pressures in the resting state. A, In this patient with mitral stenosis, the mean resting gradient was
only 8 mm Hg and the pulmonary artery wedge pressure (PAWP) was only 18 mm Hg. This patient had significant symptoms out of
proportion to the resting hemodynamics. With supine bicycle exercise, the mean gradient rose to 29 mm Hg and the pulmonary artery
wedge pressure rose to 41 mm Hg, indicating that the mitral stenosis was hemodynamically significant and causing the severe symptoms.
B, This patient had no significant valve disease, normal left ventricular (LV) systolic function, but significant dyspnea on exertion.
In the resting state, the pulmonary artery wedge pressure was only 13 mm Hg. However, at a low level of supine bicycle exercise, there
was a marked increase in pulmonary artery wedge pressure to 41 mm Hg with a large V wave. There was not significant mitral regurgitation
by simultaneous echocardiography, indicating that these symptoms were due to noncompliance of the left atrium and left ventricle.
MV indicates mitral valve.
In patients in whom there is a low-output, low-gradient (Grad) state, it may be necessary to perform dobutamine stimulation
to normalize cardiac output. This can be used to differentiate between patients with true aortic (Ao) stenosis and those with pseudo–
aortic stenosis. A, With dobutamine stimulation, the gradient increases from 28 to 42 mm Hg and the valve area remains small at 0.7
cm2. This indicates that there is severe fixed valvular stenosis in this patient. B, In this patient with similar resting hemodynamics, dobutamine
infusion does not change the gradient remaining at 24 mm Hg. The valve area increases to 1.2 cm2. This is an example of
pseudo–aortic stenosis in which the valve area is small at baseline owing to the lack of momentum from a ventricle to fully open a
mildly stenotic aortic valve. AVA indicates aortic valve area; LV, left ventricle; RV, right ventricle; and LA, left atrium.
Low-output, low-gradient state may also be seen in patients with preserved ejection fraction. In these patients, a high additional
afterload resulting from a noncompliant aortic system further contributes to the low cardiac output. Through lowering of the peripheral
resistance with a vasodilator such as nitroprusside (NTP), patients with true aortic stenosis may be able to be identified by
demonstrating an increase in aortic valve gradient and a fixed valve area. LV indicates left ventricular; AO, central aortic; PA, pulmonary
artery; LA, left atrium; and AVA, aortic valve area.
Patients with hypertrophic cardiomyopathy may have labile left ventricular (LV) outflow tract gradients. If septal reduction
therapy is to be considered, there must a gradient of 50 mm Hg either at rest or during provocation. Exercise would be the optimal
physiological mechanism to provoke a labile obstruction but is difficult in the catheterization laboratory. Isoproterenol infusion is an
excellent method to simulate exercise by stimulating both B1 and B2 receptors. Left, There is no left ventricular outflow gradient at
rest. Middle, With initial infusion of isoproterenol, there is a 40-mm Hg gradient across the left ventricular outflow tract. Right, With a
greater infusion of isoproterenol, there is a 65-mm Hg left ventricular outflow gradient. Ao indicates central aortic; LA, left atrial.