
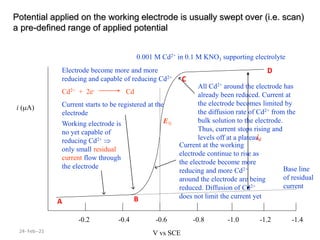
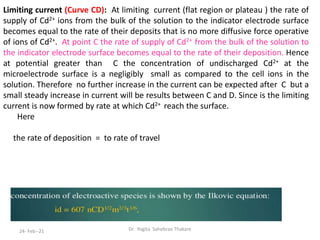
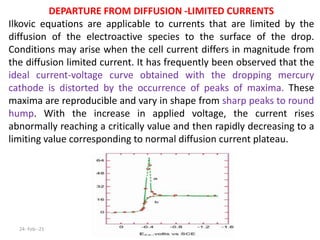
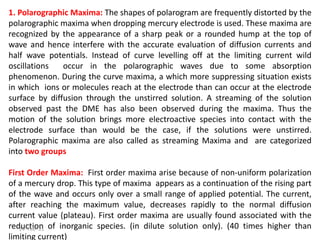
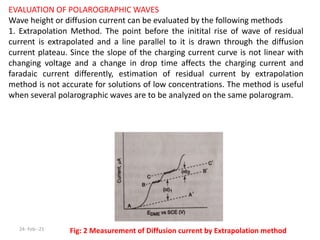
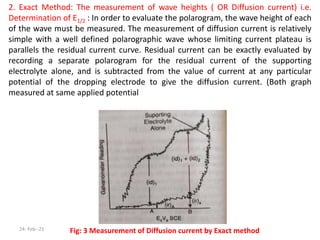
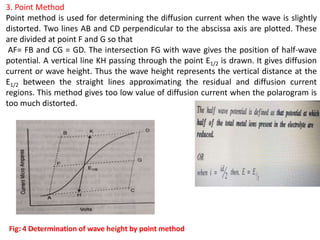
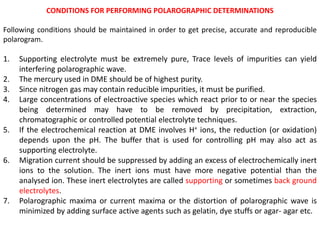

This document discusses polarographic maxima and their interpretation. It begins by explaining how polarography works, involving sweeping the potential of a working electrode and measuring the resulting current. Two types of polarographic maxima are described - first order maxima arising from non-uniform mercury drop polarization, and second order maxima associated with organic compounds that occur over a wider potential range. Methods for removing maxima using suppressors like gelatin are also outlined. The document then discusses factors that can cause non-additive and mixed currents, and provides an example of an anodic wave involving the oxidation of Fe2+. It concludes by describing methods for evaluating diffusion currents from polarographic waves.


![Polarography[1]](https://cdn.slidesharecdn.com/ss_thumbnails/polarography1-210816031327-thumbnail.jpg?width=640&height=640&fit=bounds)


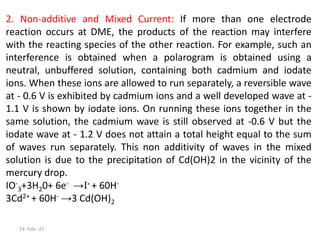
![POLARGRAY_by_Shabnam_Faiz,_R.No_06[1].pptx](https://cdn.slidesharecdn.com/ss_thumbnails/polargraybyshabnamfaizr-220606070420-1e408d1d-thumbnail.jpg?width=640&height=640&fit=bounds)


