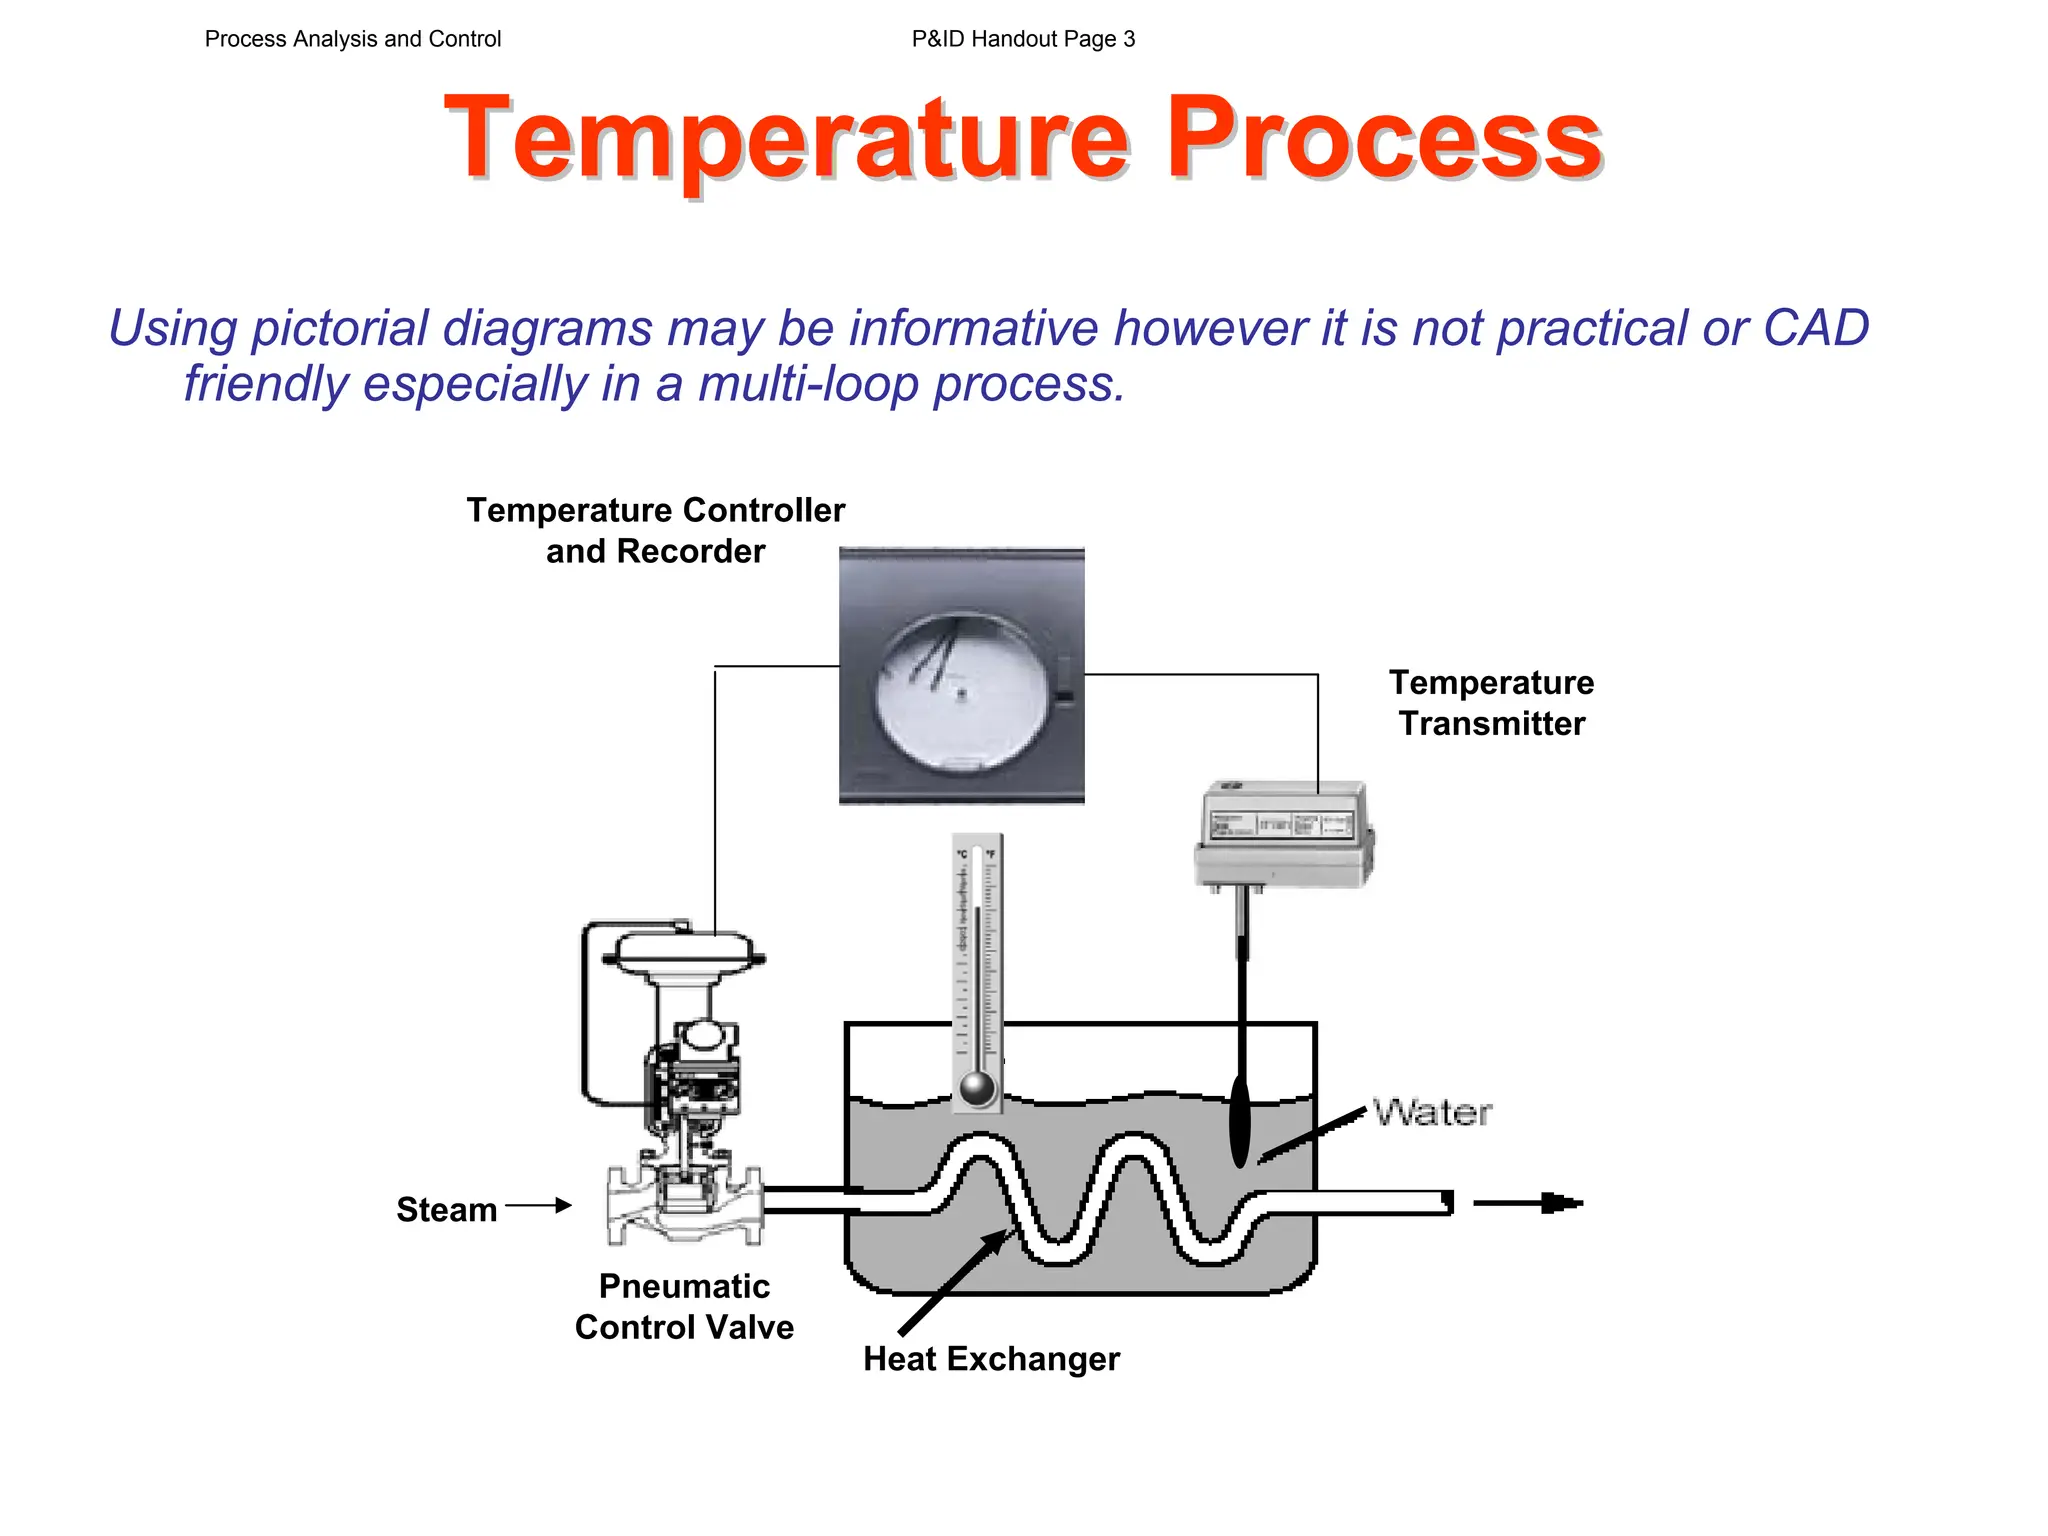
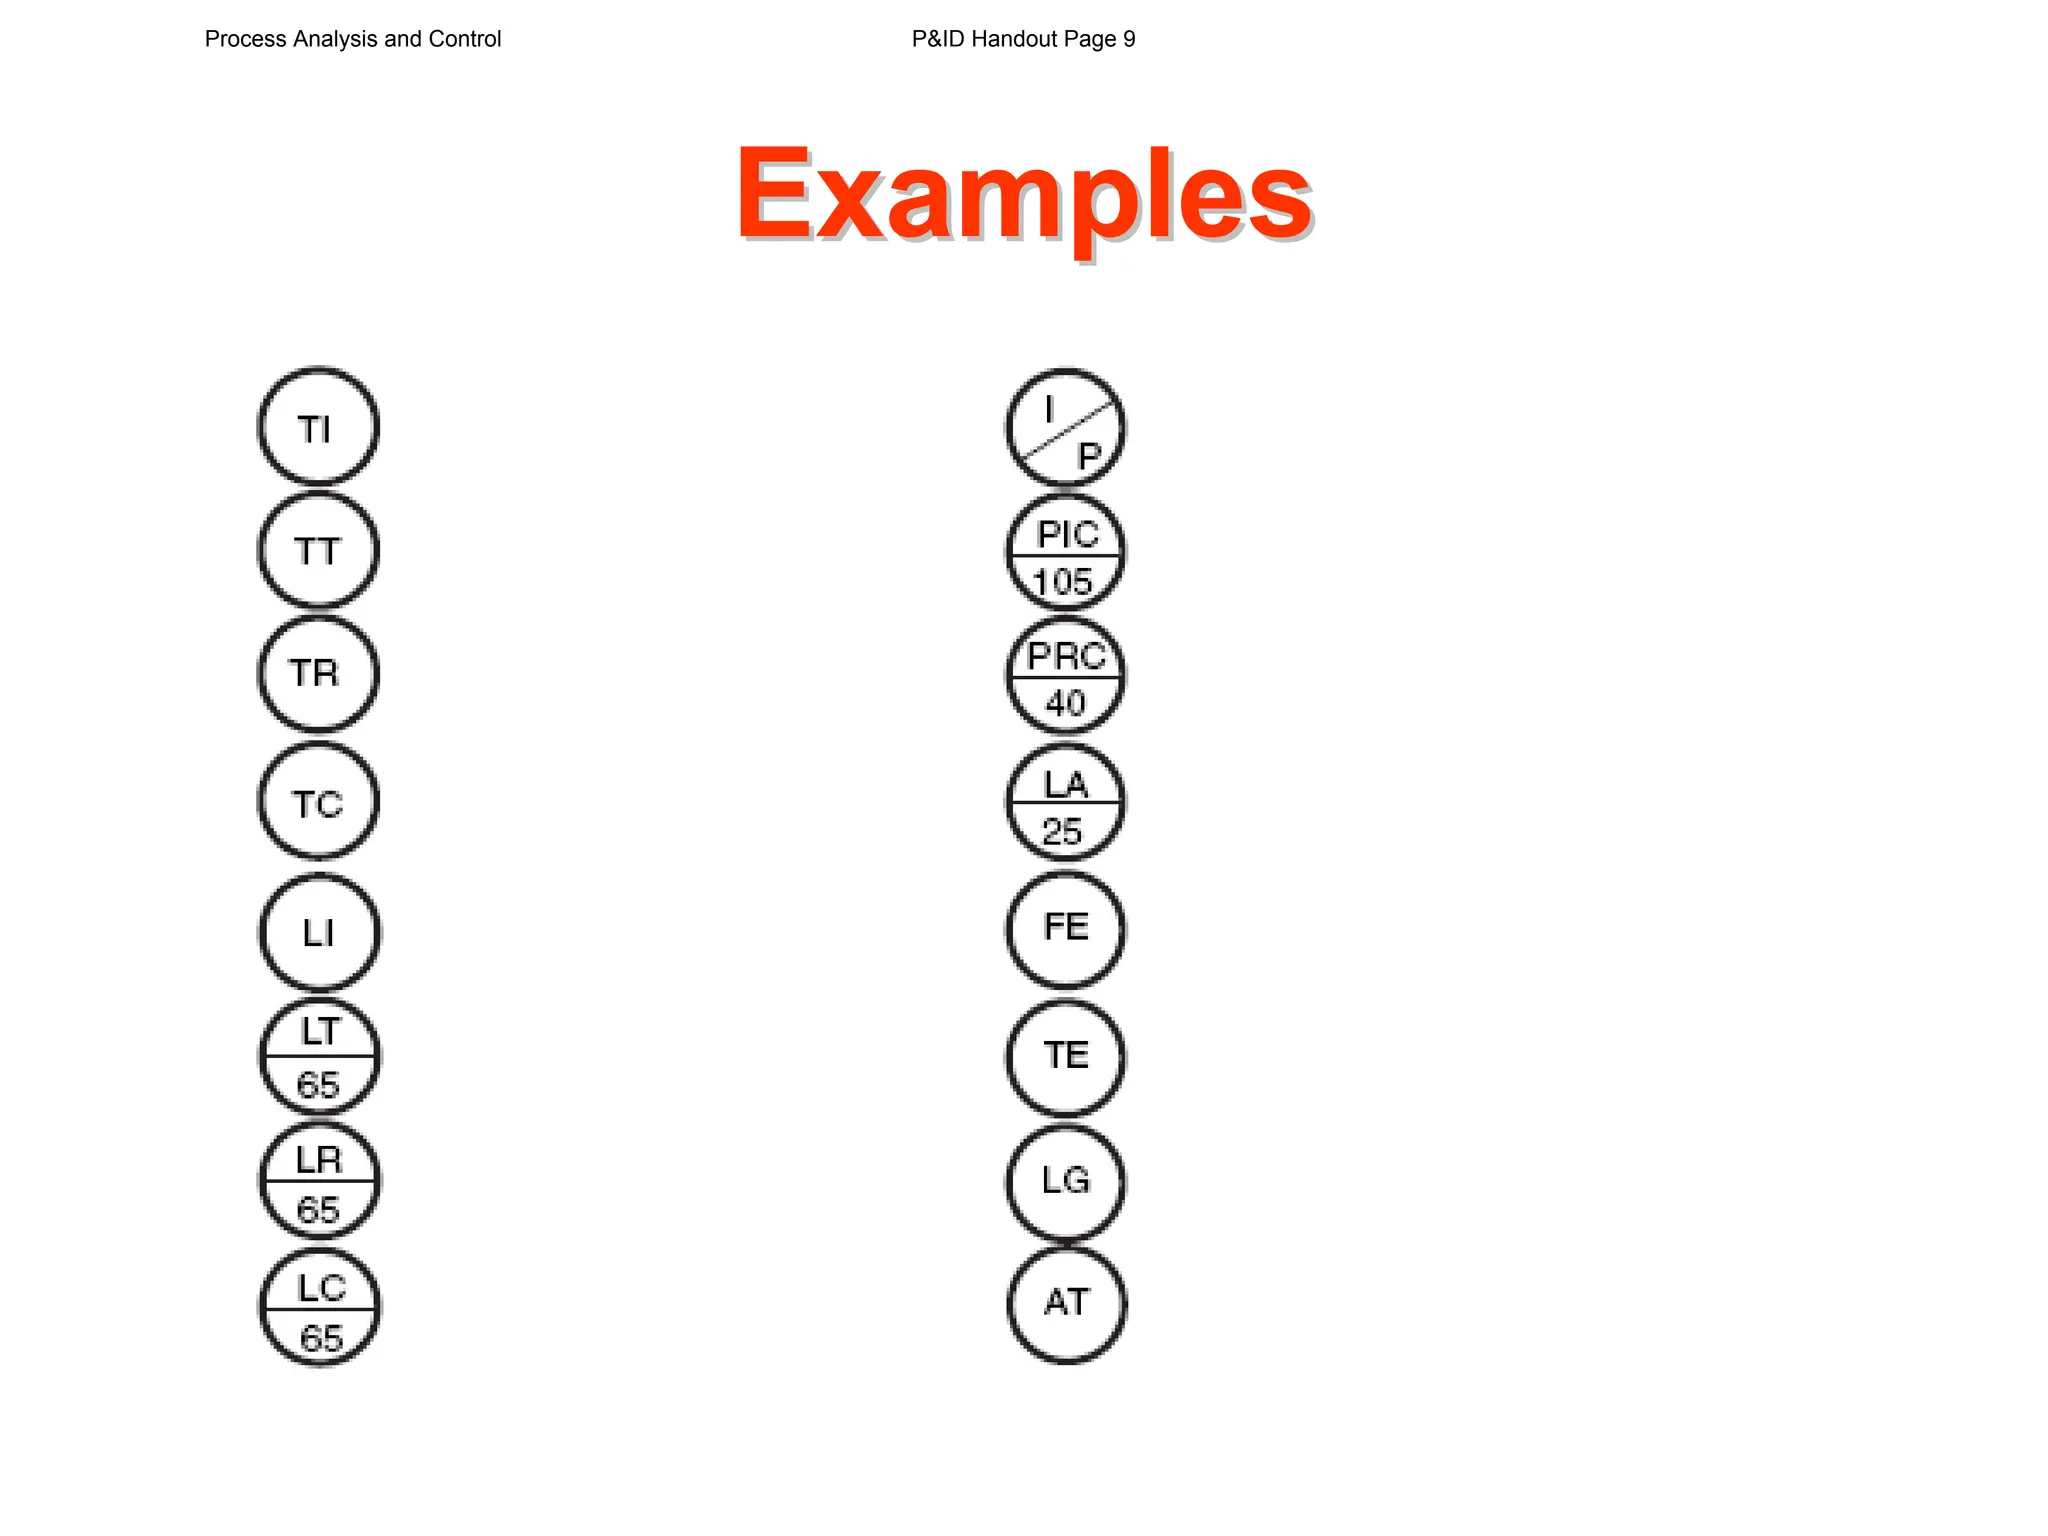
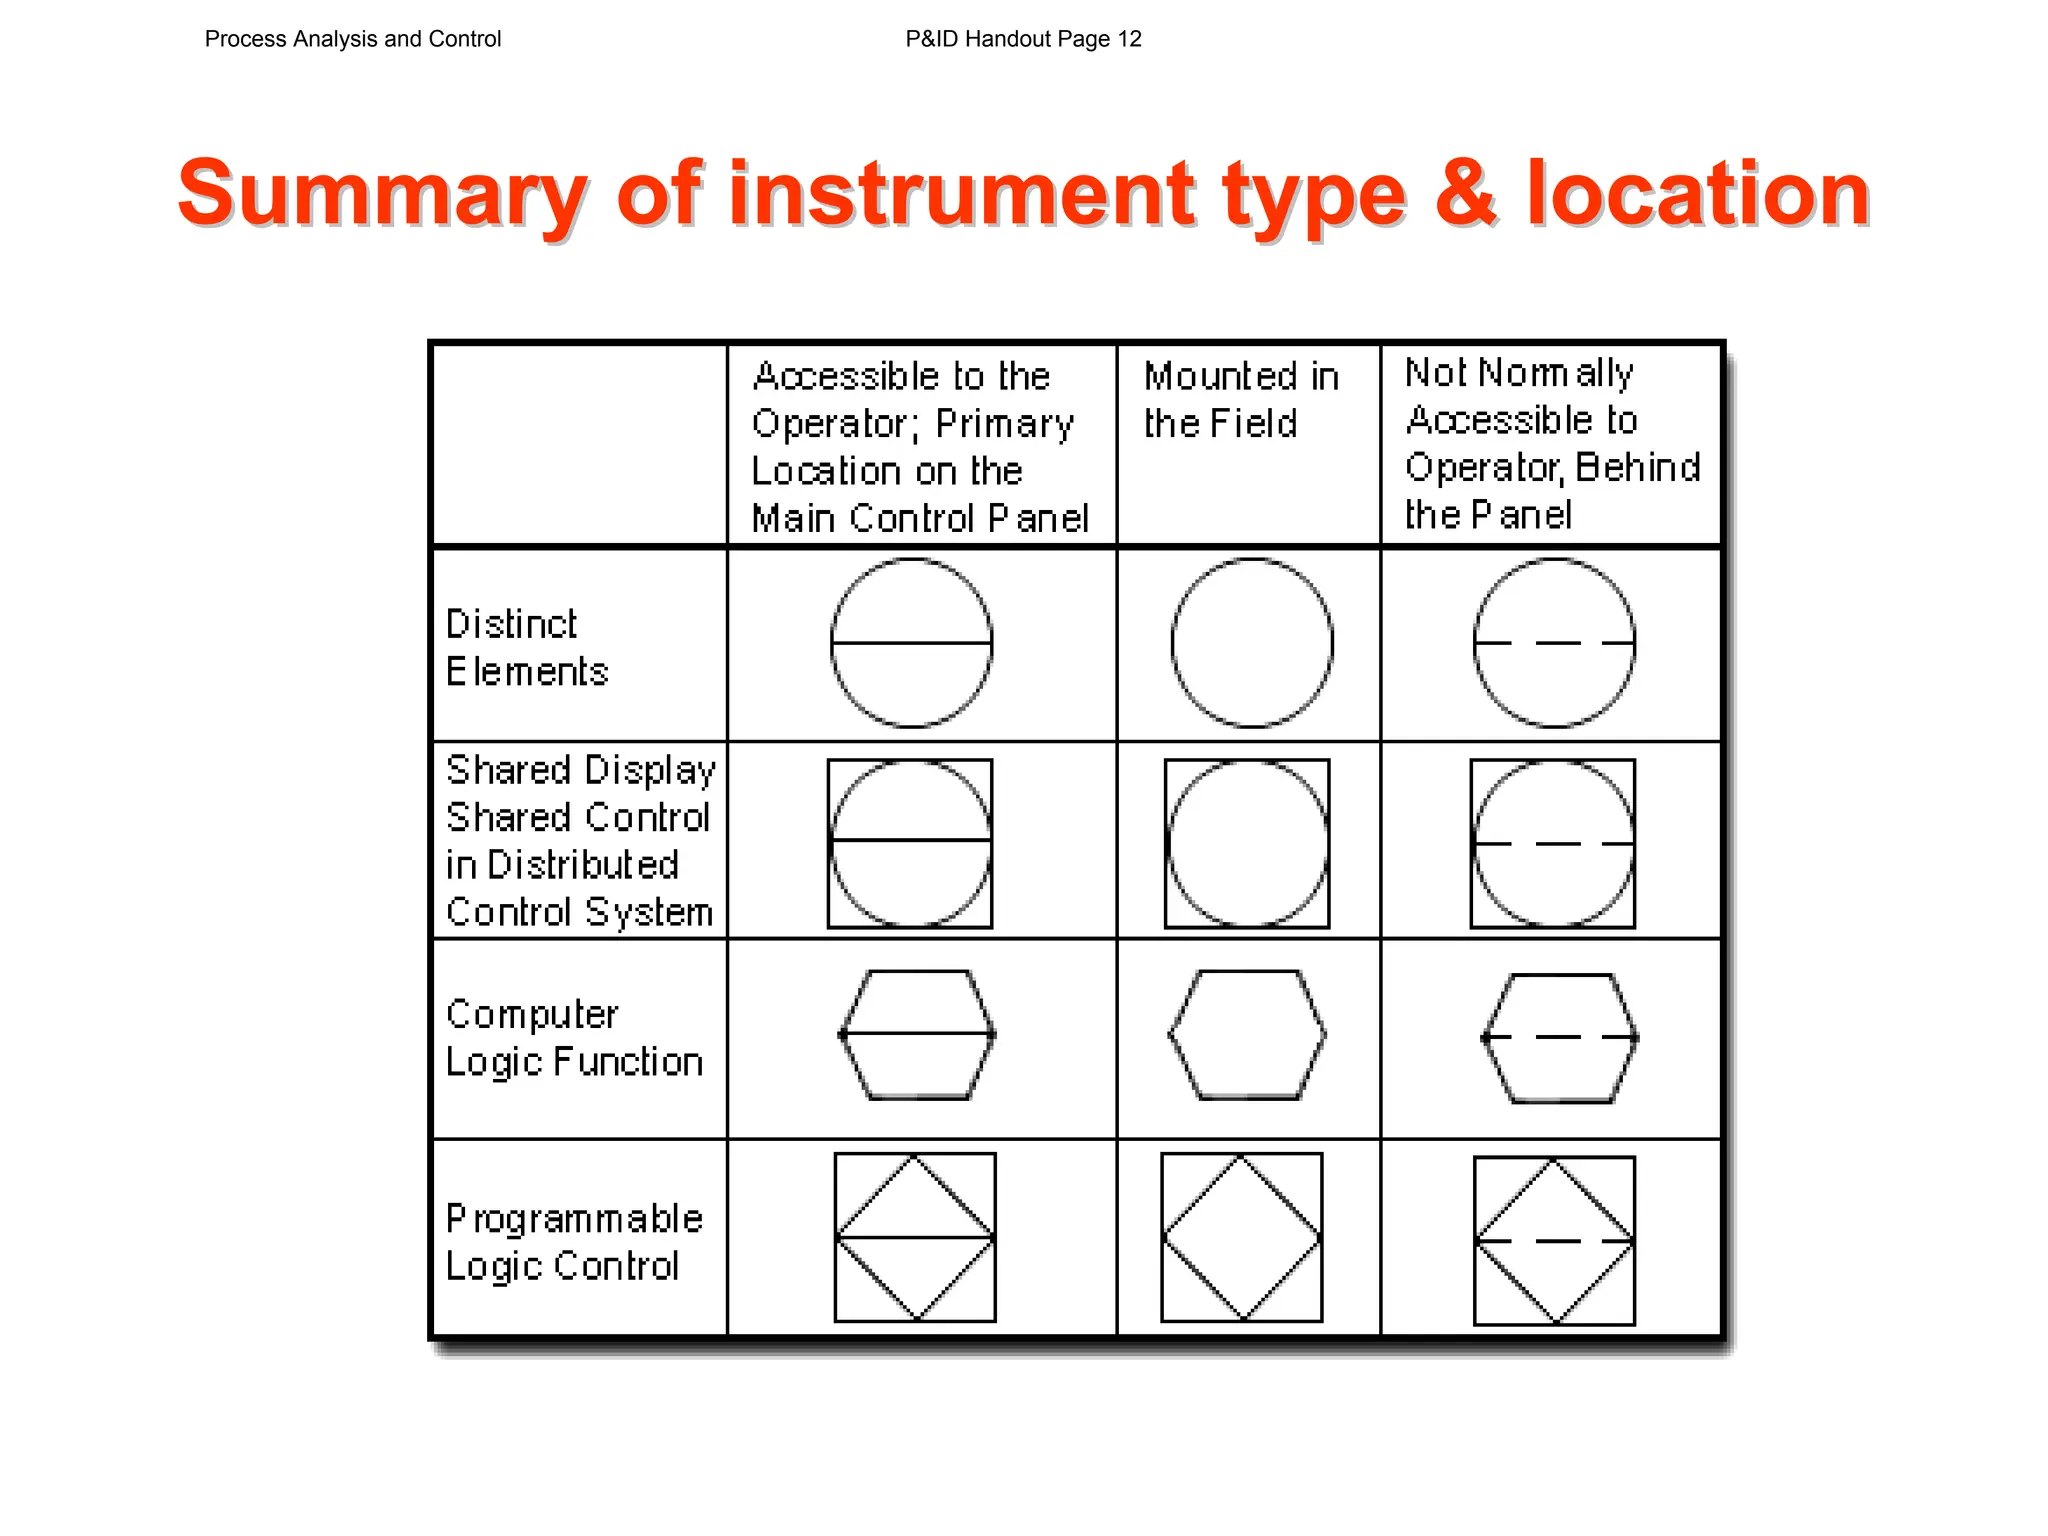
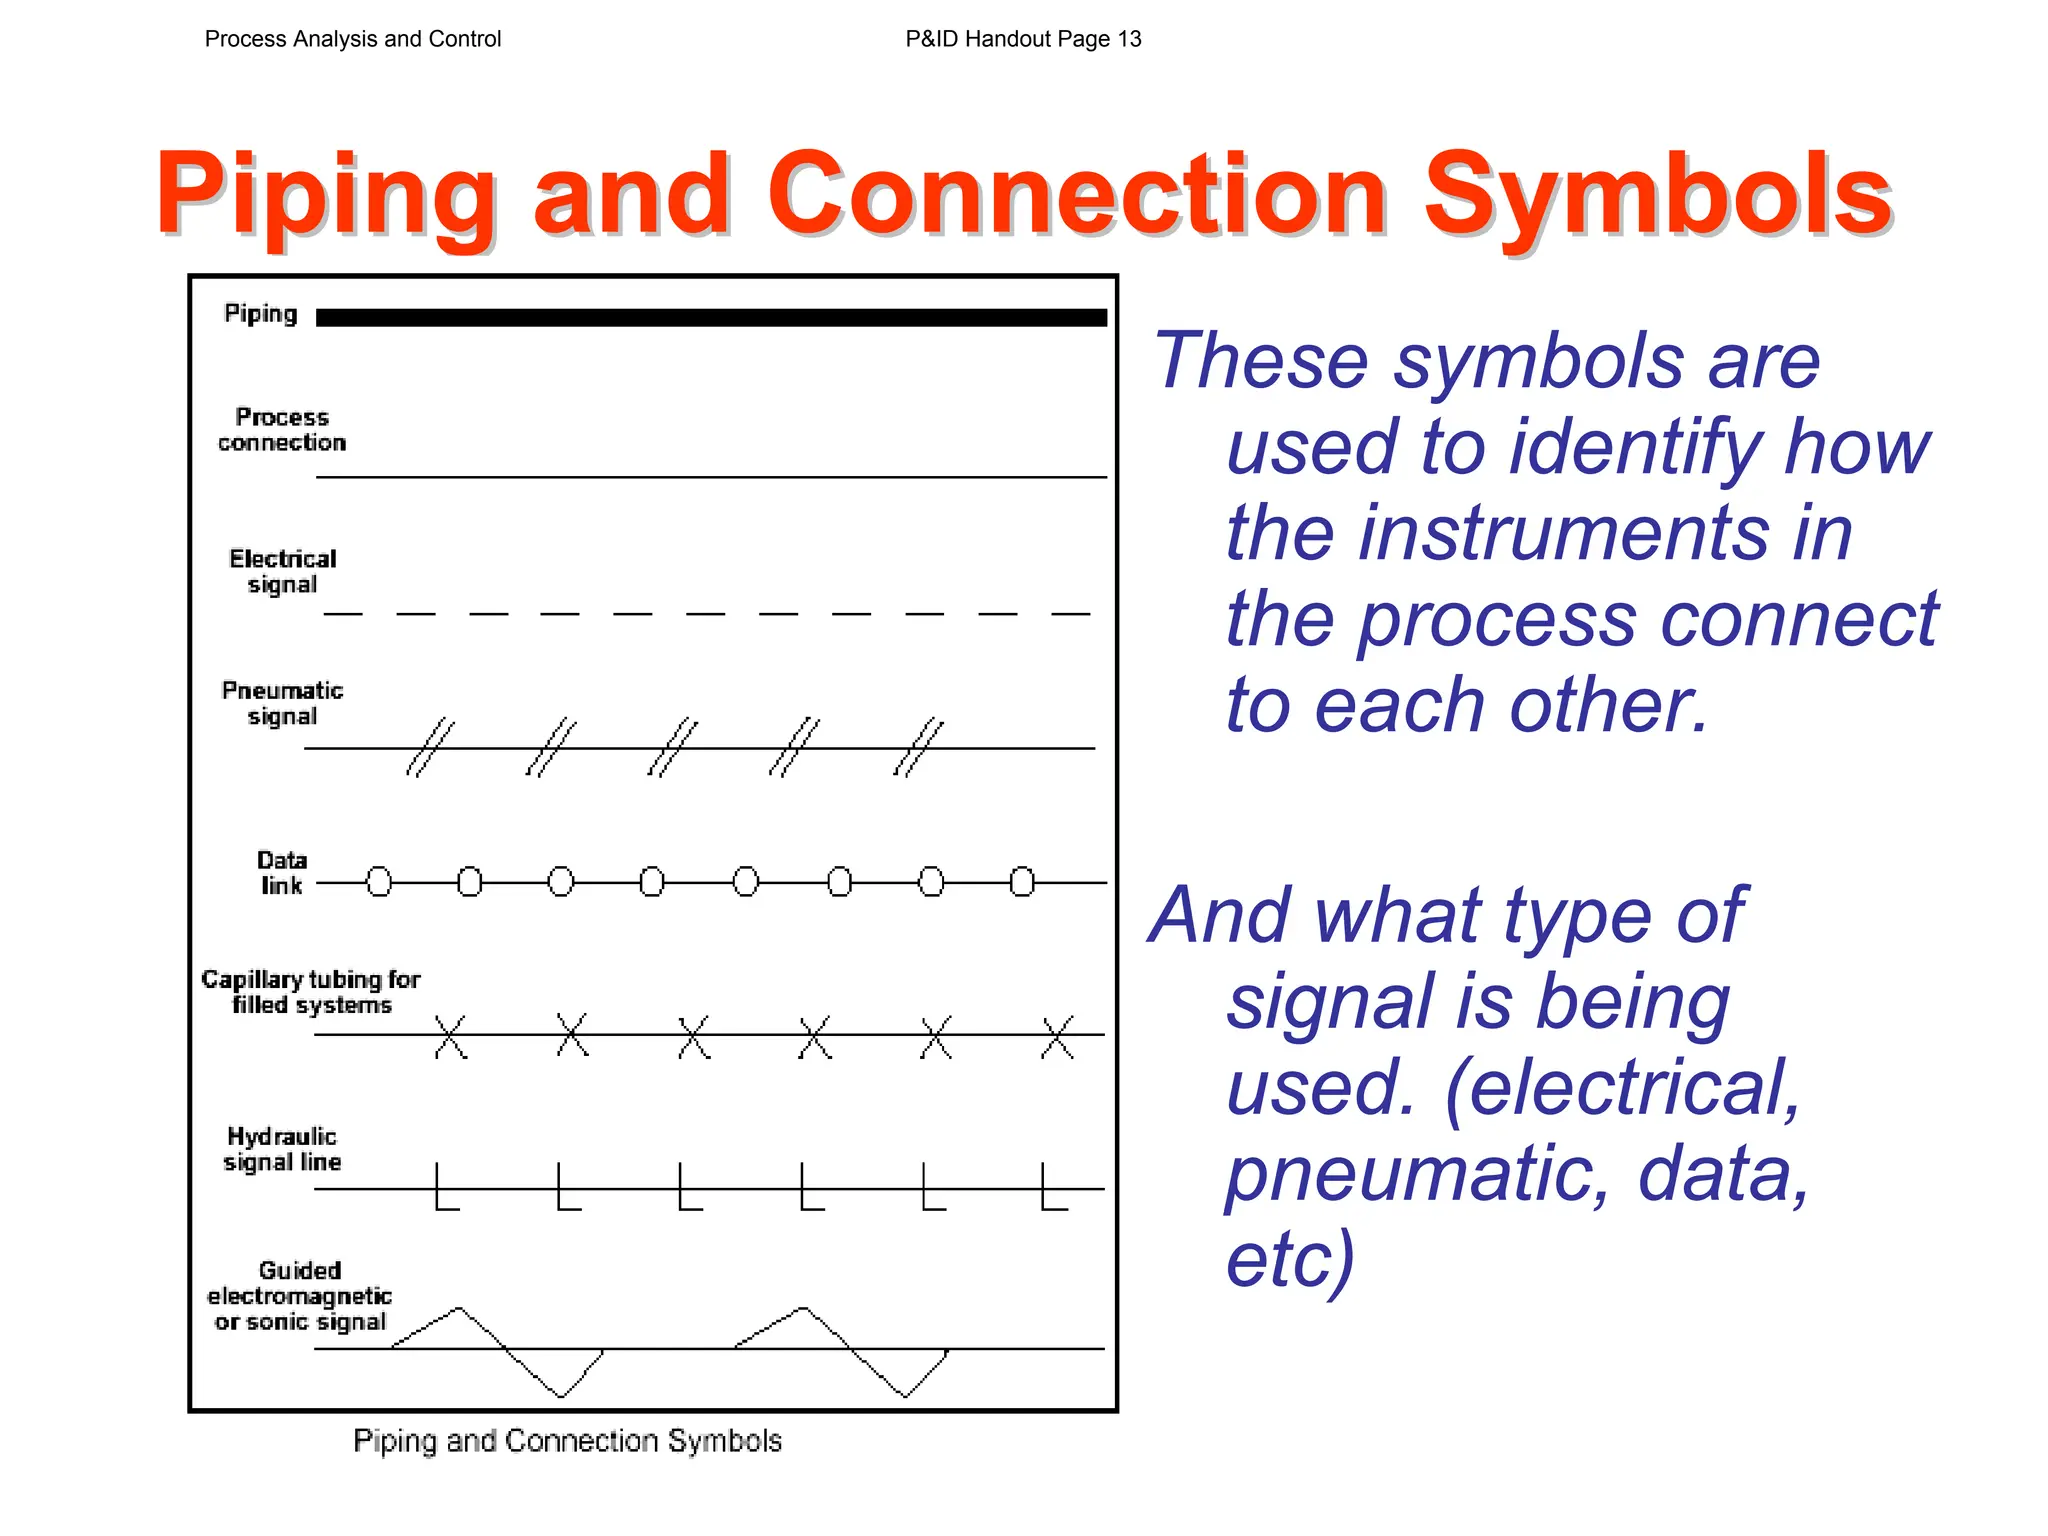
P&ID SYMBOLS
P&ID SYMBOLS
ISA Symbols and Loop Diagrams
Process Analysis and Control P&ID Handout Page 1
P&IDs
• Piping & Instrumentation Drawing (original)
• Process & Instrumentation Diagram (also used)
• Process Flow Diagram – PFD (simplified version of
the P&ID)
Most industries have standardized the symbols according to the
ISA Standard S5.1 Instrumentation Symbol Specification.
Piping and Instrumentation Diagrams or simply P&IDs are the “schematics”
used in the field of instrumentation and control (Automation)
The P&ID is used to by field techs, engineers, and operators to better
understand the process and how the instrumentation is inter connected.
Process Analysis and Control P&ID Handout Page 2
Temperature Process
Temperature Process
Using pictorial diagrams may be informative however it is not practical or CAD
friendly especially in a multi-loop process.
Steam
Temperature Controller
and Recorder
Temperature
Transmitter
Pneumatic
Control Valve
Heat Exchanger
Process Analysis and Control P&ID Handout Page 3
Building the P&ID
Building the P&ID
The P&ID will use symbols and circles to
represent each instrument and how they are
inter-connected in the process.
Thermometer
Temperature
Sensing Bulb
Temperature
Transmitter
Temperature Controller
and Recorder
Pneumatic
Control
Valve
Process Analysis and Control P&ID Handout Page 4
Tag Numbers
Tag Numbers
Tag “numbers” are letters and numbers
placed within or near the instrument to
identify the type and function of the device.
Temperature
Sensing Bulb
TRC
206
FCV
206
TT
206
TI
206
Process Analysis and Control P&ID Handout Page 5
The first letter is used to designate
the measured variable
Tag Descriptors
Tag Descriptors
123
X Y Z
The succeeding letter(s) are
used to designate the function
of the component, or to modify
the meaning of the first letter.
Pressure
Level
Flow
Temperature
Indicator
Recorder
Controller
Transmitter
Process Analysis and Control P&ID Handout Page 6
Tag Numbers
Tag Numbers
Tag “numbers” are letters and numbers
placed within or near the instrument to
identify the type and function of the device.
Temperature
Sensing Bulb
TRC
206
FCV
206
TT
206
TI
206
Temperature Recording Controller
Temperature Transmitter
Temperature Indicator
Process Analysis and Control P&ID Handout Page 7
ISA S5.1 Identification Letters
Process Analysis and Control P&ID Handout Page 8
Examples
Examples
Process Analysis and Control P&ID Handout Page 9
Instrument Location
Instrument Location
The presence or absence of a line determines the location of the physical
device. For example no line means the instrument is installed in the field
near the process.
123
X Y Z
123
X Y Z
123
X Y Z
No Line
The instrument is
mounted in the field
near the process,
(close to the operator)
Solid Line
The instrument is
mounted in the
control room
(accessible to the
operator)
No Line
The instrument is
mounted out of sight
(not accessible to the
operator)
Process Analysis and Control P&ID Handout Page 10
Shared Displays/Shared Control
Some instruments are part of a Distributed Control
System (DCS) where a specific controller or indicator
can be selected from many others but shown in one
location (like a terminal screen)
In the control room In the plant Not accessible
Process Analysis and Control P&ID Handout Page 11
Summary of instrument type & location
Process Analysis and Control P&ID Handout Page 12
Piping and Connection Symbols
These symbols are
used to identify how
the instruments in
the process connect
to each other.
And what type of
signal is being
used. (electrical,
pneumatic, data,
etc)
Process Analysis and Control P&ID Handout Page 13
Valve Symbols
Valve Symbols
Process Analysis and Control P&ID Handout Page 14
P&ID Example
P&ID Example
Steam
Temperature Controller
and Recorder
Temperature
Transmitter
Pneumatic
Control Valve
Heat Exchanger
TRC
206
S
T T
206
TI
206
TCV
206
Process Analysis and Control P&ID Handout Page 15
P&ID Exercise
P&ID Exercise
FIC
TIC
YIC
TY
FT
TT
1
2
3
2
3
1
Process Analysis and Control P&ID Handout Page 16
P&ID Exercise
P&ID Exercise
FIC –
Flow Indicating Controller
TIC
Temperature Indicating Cont.
YIC
PLC Indicating Controller
TY
Temperature Computer
Output
FT
Flow Transmitter
TT
Temperature Transmitter
Process Analysis and Control P&ID Handout Page 17
Process Flow Diagram - PFD
A PFD shows less detail than a P&ID and is
used only to understand how the process
works
Process Analysis and Control P&ID Handout Page 18

Basic Piping and Instrument Design Handout

  • 1.
    P&ID SYMBOLS P&ID SYMBOLS ISASymbols and Loop Diagrams Process Analysis and Control P&ID Handout Page 1
  • 2.
    P&IDs • Piping &Instrumentation Drawing (original) • Process & Instrumentation Diagram (also used) • Process Flow Diagram – PFD (simplified version of the P&ID) Most industries have standardized the symbols according to the ISA Standard S5.1 Instrumentation Symbol Specification. Piping and Instrumentation Diagrams or simply P&IDs are the “schematics” used in the field of instrumentation and control (Automation) The P&ID is used to by field techs, engineers, and operators to better understand the process and how the instrumentation is inter connected. Process Analysis and Control P&ID Handout Page 2
  • 3.
    Temperature Process Temperature Process Usingpictorial diagrams may be informative however it is not practical or CAD friendly especially in a multi-loop process. Steam Temperature Controller and Recorder Temperature Transmitter Pneumatic Control Valve Heat Exchanger Process Analysis and Control P&ID Handout Page 3
  • 4.
    Building the P&ID Buildingthe P&ID The P&ID will use symbols and circles to represent each instrument and how they are inter-connected in the process. Thermometer Temperature Sensing Bulb Temperature Transmitter Temperature Controller and Recorder Pneumatic Control Valve Process Analysis and Control P&ID Handout Page 4
  • 5.
    Tag Numbers Tag Numbers Tag“numbers” are letters and numbers placed within or near the instrument to identify the type and function of the device. Temperature Sensing Bulb TRC 206 FCV 206 TT 206 TI 206 Process Analysis and Control P&ID Handout Page 5
  • 6.
    The first letteris used to designate the measured variable Tag Descriptors Tag Descriptors 123 X Y Z The succeeding letter(s) are used to designate the function of the component, or to modify the meaning of the first letter. Pressure Level Flow Temperature Indicator Recorder Controller Transmitter Process Analysis and Control P&ID Handout Page 6
  • 7.
    Tag Numbers Tag Numbers Tag“numbers” are letters and numbers placed within or near the instrument to identify the type and function of the device. Temperature Sensing Bulb TRC 206 FCV 206 TT 206 TI 206 Temperature Recording Controller Temperature Transmitter Temperature Indicator Process Analysis and Control P&ID Handout Page 7
  • 8.
    ISA S5.1 IdentificationLetters ISA S5.1 Identification Letters Process Analysis and Control P&ID Handout Page 8
  • 9.
    Examples Examples Process Analysis andControl P&ID Handout Page 9
  • 10.
    Instrument Location Instrument Location Thepresence or absence of a line determines the location of the physical device. For example no line means the instrument is installed in the field near the process. 123 X Y Z 123 X Y Z 123 X Y Z No Line The instrument is mounted in the field near the process, (close to the operator) Solid Line The instrument is mounted in the control room (accessible to the operator) No Line The instrument is mounted out of sight (not accessible to the operator) Process Analysis and Control P&ID Handout Page 10
  • 11.
    Shared Displays/Shared Control SharedDisplays/Shared Control Some instruments are part of a Distributed Control System (DCS) where a specific controller or indicator can be selected from many others but shown in one location (like a terminal screen) In the control room In the plant Not accessible Process Analysis and Control P&ID Handout Page 11
  • 12.
    Summary of instrumenttype & location Summary of instrument type & location Process Analysis and Control P&ID Handout Page 12
  • 13.
    Piping and ConnectionSymbols Piping and Connection Symbols These symbols are used to identify how the instruments in the process connect to each other. And what type of signal is being used. (electrical, pneumatic, data, etc) Process Analysis and Control P&ID Handout Page 13
  • 14.
    Valve Symbols Valve Symbols ProcessAnalysis and Control P&ID Handout Page 14
  • 15.
    P&ID Example P&ID Example Steam TemperatureController and Recorder Temperature Transmitter Pneumatic Control Valve Heat Exchanger TRC 206 S T T 206 TI 206 TCV 206 Process Analysis and Control P&ID Handout Page 15
  • 16.
  • 17.
    P&ID Exercise P&ID Exercise FIC– Flow Indicating Controller TIC Temperature Indicating Cont. YIC PLC Indicating Controller TY Temperature Computer Output FT Flow Transmitter TT Temperature Transmitter Process Analysis and Control P&ID Handout Page 17
  • 18.
    Process Flow Diagram- PFD A PFD shows less detail than a P&ID and is used only to understand how the process works Process Analysis and Control P&ID Handout Page 18