SlideShare a Scribd company logo
28-Jul-15
1
Histograms, Frequency
Polygons, and Ogives
Section 2.3
Objectives
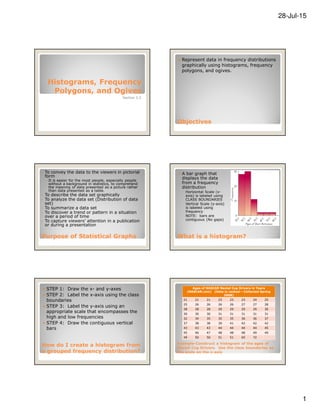
Represent data in frequency distributions
graphically using histograms, frequency
polygons, and ogives.
Purpose of Statistical Graphs
• To convey the data to the viewers in pictorial
form
– It is easier for the most people, especially people
without a background in statistics, to comprehend
the meaning of data presented as a picture rather
than data presented as a table.
• To describe the data set graphically
• To analyze the data set (Distribution of data
set)
• To summarize a data set
• To discover a trend or pattern in a situation
over a period of time
• To capture viewers’ attention in a publication
or during a presentation
What is a histogram?
A bar graph that
displays the data
from a frequency
distribution
◦ Horizontal Scale (x-
axis) is labeled using
CLASS BOUNDARIES
◦ Vertical Scale (y-axis)
is labeled using
frequency
◦ NOTE: bars are
contiguous (No gaps)
How do I create a histogram from
a grouped frequency distribution?
STEP 1: Draw the x- and y-axes
STEP 2: Label the x-axis using the class
boundaries
STEP 3: Label the y-axis using an
appropriate scale that encompasses the
high and low frequencies
STEP 4: Draw the contiguous vertical
bars
Example-Construct a histogram of the ages of
Nextel Cup Drivers. Use the class boundaries as
the scale on the x-axis
Ages of NASCAR Nextel Cup Drivers in Years
(NASCAR.com) (Data is ranked---Collected Spring
2008)
21 21 21 23 23 23 24 25
25 26 26 26 26 27 27 28
28 28 28 29 29 29 29 30
30 30 30 31 31 31 31 31
32 34 35 35 35 36 36 37
37 38 38 39 41 42 42 42
43 43 43 44 44 44 44 45
45 46 47 48 48 48 49 49
49 50 50 51 51 65 72
28-Jul-15
2
NASCAR Nextel Cup Drivers’ Ages
Class Limits
(Ages in Years)
Class
Boundaries
Frequencies
20-29 19.5-29.5 23
30-39 29.5-39.5 21
40-49 39.5-49.5 21
50-59 49.5-59.5 4
60-69 59.5-69.5 1
70-79 69.5-79.5 1
Frequency Polygon
Line graph
(rather than a
bar graph)
Uses class
midpoints rather
than class
boundaries on x-
axis
Ogive (Cumulative Frequency
Polygon)
• Line graph (rather
than a bar graph)
• Uses class boundaries
on x-axis
• Uses cumulative
frequencies (total as
you go) rather than
individual class
frequencies
• Used to visually
represent how many
values are below a
specified upper class
boundary
Another possibility
• We can use the
percentage (relative
frequency) rather
than the “tallies”
(frequency) on the x-
axis.
– Relative Frequency
Histogram
– Relative Frequency
Polygon
– Relative Frequency
Ogive
• Used when a
comparison between
two data sets is
desired, especially if
the data sets are two
different sizes
• Overall shape
(distribution) of
graph is the same,
but we use a % on
the y-axis scale
Important Characteristics of Data
Center: a representative or average value
that indicates where the middle of the data
set is located (Chapter 3)
Variation: a measure of the amount that the
values vary among themselves
Distribution: the nature or shape of the
distribution of data (such as bell-shaped,
uniform, or skewed)
Outliers: Sample values that lie very far
away from the majority of other sample
values
Time: Changing characteristics of data over
time
Distribution
The nature or shape of the distribution
can be determined by viewing the
histogram or other graphs.
Knowing the shape of the distribution
helps to determine the appropriate
statistical methods to use when analyzing
the data.
Distributions are most often not perfectly
shaped, so focus on the overall pattern,
not the exact shape
28-Jul-15
3
Common Distribution Shapes
(p. 56)
Bell-shaped (Normal) has a
single peak and tapers at
either end
Uniform is basically flat
or rectangular
J-shaped has few data on the
left and increases as you
move to the right
Reverse J-shaped has a lot of
data on the left and decreases
as you move to the right
Right Skewed peaks on the left and
tapers on the right
Left Skewed peaks on the
right and tapers on the left
Bimodal has two peaks of
same height
U-shaped peaks on left and
right with dip in center
Distribution Decision Making
When you analyze histograms, look at the
shape of the curve and ask yourself:
◦ Does it have one peak or two peaks?
◦ Is it relatively flat?
◦ Is it relatively U-shaped?
◦ Are the data values spread out on the graph?
◦ Are the data values clustered around the center?
◦ Are the data values clustered on the right or left
ends?
◦ Are there data values in the extreme ends?
(outliers)

More Related Content

What's hot

Bar Graphs And Histograms
Bar Graphs And HistogramsBar Graphs And Histograms
Bar Graphs And Histogramsmmeddin
 
Basic Descriptive Statistics
Basic Descriptive StatisticsBasic Descriptive Statistics
Basic Descriptive Statisticssikojp
 
Types of graphs
Types of graphsTypes of graphs
Types of graphsbweldon
 
What is Statistics
What is StatisticsWhat is Statistics
What is Statisticssidra-098
 
Descriptive statistics
Descriptive statisticsDescriptive statistics
Descriptive statisticsAbhinav yadav
 
2.3 Histogram/Frequency Polygon/Ogives
2.3 Histogram/Frequency Polygon/Ogives2.3 Histogram/Frequency Polygon/Ogives
2.3 Histogram/Frequency Polygon/Ogivesmlong24
 
Descriptive statistics
Descriptive statisticsDescriptive statistics
Descriptive statisticsmercy rani
 
Introduction to Statistics (Part -I)
Introduction to Statistics (Part -I)Introduction to Statistics (Part -I)
Introduction to Statistics (Part -I)YesAnalytics
 
Descriptive statistics
Descriptive statisticsDescriptive statistics
Descriptive statisticsAttaullah Khan
 
Data presentation Lecture
Data presentation Lecture Data presentation Lecture
Data presentation Lecture AB Rajar
 
Ppt central tendency measures
Ppt central tendency measuresPpt central tendency measures
Ppt central tendency measuresMtMt37
 
Data collection and presentation
Data collection and presentationData collection and presentation
Data collection and presentationferdaus44
 
Data Analysis, Presentation and Interpretation of Data
Data Analysis, Presentation and Interpretation of DataData Analysis, Presentation and Interpretation of Data
Data Analysis, Presentation and Interpretation of DataRoqui Malijan
 
Stem and-leaf plots
Stem and-leaf plotsStem and-leaf plots
Stem and-leaf plotsValPatton
 
03.data presentation(2015) 2
03.data presentation(2015) 203.data presentation(2015) 2
03.data presentation(2015) 2Mmedsc Hahm
 
Introduction to Statistics
Introduction to StatisticsIntroduction to Statistics
Introduction to StatisticsRobert Tinaro
 

What's hot (20)

Bar Graphs And Histograms
Bar Graphs And HistogramsBar Graphs And Histograms
Bar Graphs And Histograms
 
Basic Descriptive Statistics
Basic Descriptive StatisticsBasic Descriptive Statistics
Basic Descriptive Statistics
 
Types of graphs
Types of graphsTypes of graphs
Types of graphs
 
What is Statistics
What is StatisticsWhat is Statistics
What is Statistics
 
Descriptive statistics
Descriptive statisticsDescriptive statistics
Descriptive statistics
 
2.3 Histogram/Frequency Polygon/Ogives
2.3 Histogram/Frequency Polygon/Ogives2.3 Histogram/Frequency Polygon/Ogives
2.3 Histogram/Frequency Polygon/Ogives
 
Descriptive statistics
Descriptive statisticsDescriptive statistics
Descriptive statistics
 
Histograms
HistogramsHistograms
Histograms
 
Introduction to Statistics (Part -I)
Introduction to Statistics (Part -I)Introduction to Statistics (Part -I)
Introduction to Statistics (Part -I)
 
Descriptive statistics
Descriptive statisticsDescriptive statistics
Descriptive statistics
 
Data presentation Lecture
Data presentation Lecture Data presentation Lecture
Data presentation Lecture
 
Ppt central tendency measures
Ppt central tendency measuresPpt central tendency measures
Ppt central tendency measures
 
Data collection and presentation
Data collection and presentationData collection and presentation
Data collection and presentation
 
Data Analysis, Presentation and Interpretation of Data
Data Analysis, Presentation and Interpretation of DataData Analysis, Presentation and Interpretation of Data
Data Analysis, Presentation and Interpretation of Data
 
Stem and-leaf plots
Stem and-leaf plotsStem and-leaf plots
Stem and-leaf plots
 
Basics of SPSS, Part 1
Basics of SPSS, Part 1Basics of SPSS, Part 1
Basics of SPSS, Part 1
 
03.data presentation(2015) 2
03.data presentation(2015) 203.data presentation(2015) 2
03.data presentation(2015) 2
 
Descriptive statistics
Descriptive statisticsDescriptive statistics
Descriptive statistics
 
Introduction to Descriptive Statistics
Introduction to Descriptive StatisticsIntroduction to Descriptive Statistics
Introduction to Descriptive Statistics
 
Introduction to Statistics
Introduction to StatisticsIntroduction to Statistics
Introduction to Statistics
 

Viewers also liked

Histograms and polygons
Histograms and polygonsHistograms and polygons
Histograms and polygonsshivang1999
 
Drawing Frequency Histogram Polygon
Drawing Frequency Histogram PolygonDrawing Frequency Histogram Polygon
Drawing Frequency Histogram PolygonMoonie Kim
 
Cumulative Frequency Curves
Cumulative Frequency CurvesCumulative Frequency Curves
Cumulative Frequency Curveskeithpeter
 
Frequency Distributions and Graphs
Frequency Distributions and GraphsFrequency Distributions and Graphs
Frequency Distributions and Graphsmonritche
 
Chapter 2: Frequency Distribution and Graphs
Chapter 2: Frequency Distribution and GraphsChapter 2: Frequency Distribution and Graphs
Chapter 2: Frequency Distribution and GraphsMong Mara
 
Displaying quantitative data with graphs
 Displaying quantitative data with graphs Displaying quantitative data with graphs
Displaying quantitative data with graphsKimmie Patricio
 
Lecture 15 monkey banana problem
Lecture 15 monkey banana problemLecture 15 monkey banana problem
Lecture 15 monkey banana problemHema Kashyap
 
Step by Step Guide to Constructing Ogives
Step by Step Guide to Constructing OgivesStep by Step Guide to Constructing Ogives
Step by Step Guide to Constructing OgivesEdTechonGC Mallett
 
Notes and-formulae-mathematics
Notes and-formulae-mathematicsNotes and-formulae-mathematics
Notes and-formulae-mathematicsAh Ching
 
Drawing Cumulative Frequency Histogram Polygon
Drawing Cumulative Frequency Histogram PolygonDrawing Cumulative Frequency Histogram Polygon
Drawing Cumulative Frequency Histogram PolygonMoonie Kim
 
Features of gaussian distribution curve
Features of gaussian distribution curveFeatures of gaussian distribution curve
Features of gaussian distribution curvefarzeen javaid
 
Cumulative frequency
Cumulative frequencyCumulative frequency
Cumulative frequencyMrGarvey
 
Normal Distribution
Normal DistributionNormal Distribution
Normal Distributionmathscontent
 
Types and models of assessment
Types and models of assessmentTypes and models of assessment
Types and models of assessmentGil Buella Remoral
 
Chapter 2 250110 083240
Chapter 2 250110 083240Chapter 2 250110 083240
Chapter 2 250110 083240guest25d353
 

Viewers also liked (20)

Histograms and polygons
Histograms and polygonsHistograms and polygons
Histograms and polygons
 
Histogram
HistogramHistogram
Histogram
 
Drawing Frequency Histogram Polygon
Drawing Frequency Histogram PolygonDrawing Frequency Histogram Polygon
Drawing Frequency Histogram Polygon
 
Cumulative Frequency Curves
Cumulative Frequency CurvesCumulative Frequency Curves
Cumulative Frequency Curves
 
Frequency Distributions and Graphs
Frequency Distributions and GraphsFrequency Distributions and Graphs
Frequency Distributions and Graphs
 
Chapter 2: Frequency Distribution and Graphs
Chapter 2: Frequency Distribution and GraphsChapter 2: Frequency Distribution and Graphs
Chapter 2: Frequency Distribution and Graphs
 
Presentation of data
Presentation of dataPresentation of data
Presentation of data
 
Displaying quantitative data with graphs
 Displaying quantitative data with graphs Displaying quantitative data with graphs
Displaying quantitative data with graphs
 
Histograms explained
Histograms explainedHistograms explained
Histograms explained
 
Statistics
StatisticsStatistics
Statistics
 
Lecture 15 monkey banana problem
Lecture 15 monkey banana problemLecture 15 monkey banana problem
Lecture 15 monkey banana problem
 
Step by Step Guide to Constructing Ogives
Step by Step Guide to Constructing OgivesStep by Step Guide to Constructing Ogives
Step by Step Guide to Constructing Ogives
 
Notes and-formulae-mathematics
Notes and-formulae-mathematicsNotes and-formulae-mathematics
Notes and-formulae-mathematics
 
Drawing Cumulative Frequency Histogram Polygon
Drawing Cumulative Frequency Histogram PolygonDrawing Cumulative Frequency Histogram Polygon
Drawing Cumulative Frequency Histogram Polygon
 
Displaying data
Displaying dataDisplaying data
Displaying data
 
Features of gaussian distribution curve
Features of gaussian distribution curveFeatures of gaussian distribution curve
Features of gaussian distribution curve
 
Cumulative frequency
Cumulative frequencyCumulative frequency
Cumulative frequency
 
Normal Distribution
Normal DistributionNormal Distribution
Normal Distribution
 
Types and models of assessment
Types and models of assessmentTypes and models of assessment
Types and models of assessment
 
Chapter 2 250110 083240
Chapter 2 250110 083240Chapter 2 250110 083240
Chapter 2 250110 083240
 

Similar to Histograms, frequency polygons, and ogives

2. AAdata presentation edited edited tutor srudents(1).pptx
2. AAdata presentation edited edited tutor srudents(1).pptx2. AAdata presentation edited edited tutor srudents(1).pptx
2. AAdata presentation edited edited tutor srudents(1).pptxssuser504dda
 
Graphs(Biostatistics and Research Methodology) B.pharmacy(8th sem.)
Graphs(Biostatistics and Research Methodology) B.pharmacy(8th sem.)Graphs(Biostatistics and Research Methodology) B.pharmacy(8th sem.)
Graphs(Biostatistics and Research Methodology) B.pharmacy(8th sem.)Pranjal Saxena
 
Data visualization.pptx
Data visualization.pptxData visualization.pptx
Data visualization.pptxnaveen shyam
 
Displaying quantitative data
Displaying quantitative dataDisplaying quantitative data
Displaying quantitative dataUlster BOCES
 
DATA GRAPHICS 8th Sem.pdf
DATA GRAPHICS 8th Sem.pdfDATA GRAPHICS 8th Sem.pdf
DATA GRAPHICS 8th Sem.pdfRavinandan A P
 
graphic representations in statistics
 graphic representations in statistics graphic representations in statistics
graphic representations in statisticsUnsa Shakir
 
135. Graphic Presentation
135. Graphic Presentation135. Graphic Presentation
135. Graphic PresentationLAKSHMANAN S
 
Aed1222 lesson 6
Aed1222 lesson 6Aed1222 lesson 6
Aed1222 lesson 6nurun2010
 
Aed1222 lesson 6 2nd part
Aed1222 lesson 6 2nd partAed1222 lesson 6 2nd part
Aed1222 lesson 6 2nd partnurun2010
 
Different Types of Graphs.ppt
Different Types of Graphs.pptDifferent Types of Graphs.ppt
Different Types of Graphs.pptlevi0417
 
Graphical representation of Data in Research.pdf
Graphical representation of Data in Research.pdfGraphical representation of Data in Research.pdf
Graphical representation of Data in Research.pdfsoniasehrawat5
 
Visualization Techniques- Box plot, Line Chart, Scatter plot, Bar chart.
Visualization Techniques- Box plot, Line Chart, Scatter plot, Bar chart.Visualization Techniques- Box plot, Line Chart, Scatter plot, Bar chart.
Visualization Techniques- Box plot, Line Chart, Scatter plot, Bar chart.Megha Sharma
 
Graphs, charts, and tables ppt @ bec doms
Graphs, charts, and tables ppt @ bec domsGraphs, charts, and tables ppt @ bec doms
Graphs, charts, and tables ppt @ bec domsBabasab Patil
 
PG STAT 531 Lecture 3 Graphical and Diagrammatic Representation of Data
PG STAT 531 Lecture 3 Graphical and Diagrammatic Representation of DataPG STAT 531 Lecture 3 Graphical and Diagrammatic Representation of Data
PG STAT 531 Lecture 3 Graphical and Diagrammatic Representation of DataAashish Patel
 
Frequency Distributions
Frequency DistributionsFrequency Distributions
Frequency Distributionsjasondroesch
 

Similar to Histograms, frequency polygons, and ogives (20)

Presentation of data ppt
Presentation of data pptPresentation of data ppt
Presentation of data ppt
 
2. AAdata presentation edited edited tutor srudents(1).pptx
2. AAdata presentation edited edited tutor srudents(1).pptx2. AAdata presentation edited edited tutor srudents(1).pptx
2. AAdata presentation edited edited tutor srudents(1).pptx
 
Graphs(Biostatistics and Research Methodology) B.pharmacy(8th sem.)
Graphs(Biostatistics and Research Methodology) B.pharmacy(8th sem.)Graphs(Biostatistics and Research Methodology) B.pharmacy(8th sem.)
Graphs(Biostatistics and Research Methodology) B.pharmacy(8th sem.)
 
Data visualization.pptx
Data visualization.pptxData visualization.pptx
Data visualization.pptx
 
Displaying quantitative data
Displaying quantitative dataDisplaying quantitative data
Displaying quantitative data
 
DATA GRAPHICS 8th Sem.pdf
DATA GRAPHICS 8th Sem.pdfDATA GRAPHICS 8th Sem.pdf
DATA GRAPHICS 8th Sem.pdf
 
graphic representations in statistics
 graphic representations in statistics graphic representations in statistics
graphic representations in statistics
 
STATISTICS.pptx
STATISTICS.pptxSTATISTICS.pptx
STATISTICS.pptx
 
135. Graphic Presentation
135. Graphic Presentation135. Graphic Presentation
135. Graphic Presentation
 
Aed1222 lesson 6
Aed1222 lesson 6Aed1222 lesson 6
Aed1222 lesson 6
 
Aed1222 lesson 6 2nd part
Aed1222 lesson 6 2nd partAed1222 lesson 6 2nd part
Aed1222 lesson 6 2nd part
 
Presentation1.pptx
Presentation1.pptxPresentation1.pptx
Presentation1.pptx
 
Data Representation.pptx
Data Representation.pptxData Representation.pptx
Data Representation.pptx
 
Different Types of Graphs.ppt
Different Types of Graphs.pptDifferent Types of Graphs.ppt
Different Types of Graphs.ppt
 
Graphical representation of Data in Research.pdf
Graphical representation of Data in Research.pdfGraphical representation of Data in Research.pdf
Graphical representation of Data in Research.pdf
 
Visualization Techniques- Box plot, Line Chart, Scatter plot, Bar chart.
Visualization Techniques- Box plot, Line Chart, Scatter plot, Bar chart.Visualization Techniques- Box plot, Line Chart, Scatter plot, Bar chart.
Visualization Techniques- Box plot, Line Chart, Scatter plot, Bar chart.
 
Graphs, charts, and tables ppt @ bec doms
Graphs, charts, and tables ppt @ bec domsGraphs, charts, and tables ppt @ bec doms
Graphs, charts, and tables ppt @ bec doms
 
data collection.pptx
data collection.pptxdata collection.pptx
data collection.pptx
 
PG STAT 531 Lecture 3 Graphical and Diagrammatic Representation of Data
PG STAT 531 Lecture 3 Graphical and Diagrammatic Representation of DataPG STAT 531 Lecture 3 Graphical and Diagrammatic Representation of Data
PG STAT 531 Lecture 3 Graphical and Diagrammatic Representation of Data
 
Frequency Distributions
Frequency DistributionsFrequency Distributions
Frequency Distributions
 

Recently uploaded

Potato Flakes Manufacturing Plant Project Report.pdf
Potato Flakes Manufacturing Plant Project Report.pdfPotato Flakes Manufacturing Plant Project Report.pdf
Potato Flakes Manufacturing Plant Project Report.pdfhostl9518
 
Memorandum Of Association Constitution of Company.ppt
Memorandum Of Association Constitution of Company.pptMemorandum Of Association Constitution of Company.ppt
Memorandum Of Association Constitution of Company.pptseri bangash
 
Creative Ideas for Interactive Team Presentations
Creative Ideas for Interactive Team PresentationsCreative Ideas for Interactive Team Presentations
Creative Ideas for Interactive Team PresentationsSlidesAI
 
Event Report - IBM Think 2024 - It is all about AI and hybrid
Event Report - IBM Think 2024 - It is all about AI and hybridEvent Report - IBM Think 2024 - It is all about AI and hybrid
Event Report - IBM Think 2024 - It is all about AI and hybridHolger Mueller
 
8 Questions B2B Commercial Teams Can Ask To Help Product Discovery
8 Questions B2B Commercial Teams Can Ask To Help Product Discovery8 Questions B2B Commercial Teams Can Ask To Help Product Discovery
8 Questions B2B Commercial Teams Can Ask To Help Product DiscoveryDesmond Leo
 
RMD24 | Retail media: hoe zet je dit in als je geen AH of Unilever bent? Heid...
RMD24 | Retail media: hoe zet je dit in als je geen AH of Unilever bent? Heid...RMD24 | Retail media: hoe zet je dit in als je geen AH of Unilever bent? Heid...
RMD24 | Retail media: hoe zet je dit in als je geen AH of Unilever bent? Heid...BBPMedia1
 
Unleash Data Power with EnFuse Solutions' Comprehensive Data Management Servi...
Unleash Data Power with EnFuse Solutions' Comprehensive Data Management Servi...Unleash Data Power with EnFuse Solutions' Comprehensive Data Management Servi...
Unleash Data Power with EnFuse Solutions' Comprehensive Data Management Servi...Rahul Bedi
 
Team-Spandex-Northern University-CS1035.
Team-Spandex-Northern University-CS1035.Team-Spandex-Northern University-CS1035.
Team-Spandex-Northern University-CS1035.smalmahmud11
 
LinkedIn Masterclass Techweek 2024 v4.1.pptx
LinkedIn Masterclass Techweek 2024 v4.1.pptxLinkedIn Masterclass Techweek 2024 v4.1.pptx
LinkedIn Masterclass Techweek 2024 v4.1.pptxSymbio Agency Ltd
 
Falcon Invoice Discounting Setup for Small Businesses
Falcon Invoice Discounting Setup for Small BusinessesFalcon Invoice Discounting Setup for Small Businesses
Falcon Invoice Discounting Setup for Small BusinessesFalcon investment
 
USA classified ads posting – best classified sites in usa.pdf
USA classified ads posting – best classified sites in usa.pdfUSA classified ads posting – best classified sites in usa.pdf
USA classified ads posting – best classified sites in usa.pdfsuperbizness1227
 
falcon-invoice-discounting-a-premier-platform-for-investors-in-india
falcon-invoice-discounting-a-premier-platform-for-investors-in-indiafalcon-invoice-discounting-a-premier-platform-for-investors-in-india
falcon-invoice-discounting-a-premier-platform-for-investors-in-indiaFalcon Invoice Discounting
 
chapter 10 - excise tax of transfer and business taxation
chapter 10 - excise tax of transfer and business taxationchapter 10 - excise tax of transfer and business taxation
chapter 10 - excise tax of transfer and business taxationAUDIJEAngelo
 
BeMetals Presentation_May_22_2024 .pdf
BeMetals Presentation_May_22_2024   .pdfBeMetals Presentation_May_22_2024   .pdf
BeMetals Presentation_May_22_2024 .pdfDerekIwanaka1
 
Pitch Deck Teardown: Terra One's $7.5m Seed deck
Pitch Deck Teardown: Terra One's $7.5m Seed deckPitch Deck Teardown: Terra One's $7.5m Seed deck
Pitch Deck Teardown: Terra One's $7.5m Seed deckHajeJanKamps
 
The Inspiring Personality To Watch In 2024.pdf
The Inspiring Personality To Watch In 2024.pdfThe Inspiring Personality To Watch In 2024.pdf
The Inspiring Personality To Watch In 2024.pdfinsightssuccess2
 
sales plan presentation by mckinsey alum
sales plan presentation by mckinsey alumsales plan presentation by mckinsey alum
sales plan presentation by mckinsey alumzyqmx62fgm
 
New Product Development.kjiy7ggbfdsddggo9lo
New Product Development.kjiy7ggbfdsddggo9loNew Product Development.kjiy7ggbfdsddggo9lo
New Product Development.kjiy7ggbfdsddggo9logalbokkahewagenitash
 
Luxury Artificial Plants Dubai | Plants in KSA, UAE | Shajara
Luxury Artificial Plants Dubai | Plants in KSA, UAE | ShajaraLuxury Artificial Plants Dubai | Plants in KSA, UAE | Shajara
Luxury Artificial Plants Dubai | Plants in KSA, UAE | ShajaraShajara Artificial Plants
 
TriStar Gold Corporate Presentation May 2024
TriStar Gold Corporate Presentation May 2024TriStar Gold Corporate Presentation May 2024
TriStar Gold Corporate Presentation May 2024Adnet Communications
 

Recently uploaded (20)

Potato Flakes Manufacturing Plant Project Report.pdf
Potato Flakes Manufacturing Plant Project Report.pdfPotato Flakes Manufacturing Plant Project Report.pdf
Potato Flakes Manufacturing Plant Project Report.pdf
 
Memorandum Of Association Constitution of Company.ppt
Memorandum Of Association Constitution of Company.pptMemorandum Of Association Constitution of Company.ppt
Memorandum Of Association Constitution of Company.ppt
 
Creative Ideas for Interactive Team Presentations
Creative Ideas for Interactive Team PresentationsCreative Ideas for Interactive Team Presentations
Creative Ideas for Interactive Team Presentations
 
Event Report - IBM Think 2024 - It is all about AI and hybrid
Event Report - IBM Think 2024 - It is all about AI and hybridEvent Report - IBM Think 2024 - It is all about AI and hybrid
Event Report - IBM Think 2024 - It is all about AI and hybrid
 
8 Questions B2B Commercial Teams Can Ask To Help Product Discovery
8 Questions B2B Commercial Teams Can Ask To Help Product Discovery8 Questions B2B Commercial Teams Can Ask To Help Product Discovery
8 Questions B2B Commercial Teams Can Ask To Help Product Discovery
 
RMD24 | Retail media: hoe zet je dit in als je geen AH of Unilever bent? Heid...
RMD24 | Retail media: hoe zet je dit in als je geen AH of Unilever bent? Heid...RMD24 | Retail media: hoe zet je dit in als je geen AH of Unilever bent? Heid...
RMD24 | Retail media: hoe zet je dit in als je geen AH of Unilever bent? Heid...
 
Unleash Data Power with EnFuse Solutions' Comprehensive Data Management Servi...
Unleash Data Power with EnFuse Solutions' Comprehensive Data Management Servi...Unleash Data Power with EnFuse Solutions' Comprehensive Data Management Servi...
Unleash Data Power with EnFuse Solutions' Comprehensive Data Management Servi...
 
Team-Spandex-Northern University-CS1035.
Team-Spandex-Northern University-CS1035.Team-Spandex-Northern University-CS1035.
Team-Spandex-Northern University-CS1035.
 
LinkedIn Masterclass Techweek 2024 v4.1.pptx
LinkedIn Masterclass Techweek 2024 v4.1.pptxLinkedIn Masterclass Techweek 2024 v4.1.pptx
LinkedIn Masterclass Techweek 2024 v4.1.pptx
 
Falcon Invoice Discounting Setup for Small Businesses
Falcon Invoice Discounting Setup for Small BusinessesFalcon Invoice Discounting Setup for Small Businesses
Falcon Invoice Discounting Setup for Small Businesses
 
USA classified ads posting – best classified sites in usa.pdf
USA classified ads posting – best classified sites in usa.pdfUSA classified ads posting – best classified sites in usa.pdf
USA classified ads posting – best classified sites in usa.pdf
 
falcon-invoice-discounting-a-premier-platform-for-investors-in-india
falcon-invoice-discounting-a-premier-platform-for-investors-in-indiafalcon-invoice-discounting-a-premier-platform-for-investors-in-india
falcon-invoice-discounting-a-premier-platform-for-investors-in-india
 
chapter 10 - excise tax of transfer and business taxation
chapter 10 - excise tax of transfer and business taxationchapter 10 - excise tax of transfer and business taxation
chapter 10 - excise tax of transfer and business taxation
 
BeMetals Presentation_May_22_2024 .pdf
BeMetals Presentation_May_22_2024   .pdfBeMetals Presentation_May_22_2024   .pdf
BeMetals Presentation_May_22_2024 .pdf
 
Pitch Deck Teardown: Terra One's $7.5m Seed deck
Pitch Deck Teardown: Terra One's $7.5m Seed deckPitch Deck Teardown: Terra One's $7.5m Seed deck
Pitch Deck Teardown: Terra One's $7.5m Seed deck
 
The Inspiring Personality To Watch In 2024.pdf
The Inspiring Personality To Watch In 2024.pdfThe Inspiring Personality To Watch In 2024.pdf
The Inspiring Personality To Watch In 2024.pdf
 
sales plan presentation by mckinsey alum
sales plan presentation by mckinsey alumsales plan presentation by mckinsey alum
sales plan presentation by mckinsey alum
 
New Product Development.kjiy7ggbfdsddggo9lo
New Product Development.kjiy7ggbfdsddggo9loNew Product Development.kjiy7ggbfdsddggo9lo
New Product Development.kjiy7ggbfdsddggo9lo
 
Luxury Artificial Plants Dubai | Plants in KSA, UAE | Shajara
Luxury Artificial Plants Dubai | Plants in KSA, UAE | ShajaraLuxury Artificial Plants Dubai | Plants in KSA, UAE | Shajara
Luxury Artificial Plants Dubai | Plants in KSA, UAE | Shajara
 
TriStar Gold Corporate Presentation May 2024
TriStar Gold Corporate Presentation May 2024TriStar Gold Corporate Presentation May 2024
TriStar Gold Corporate Presentation May 2024
 

Histograms, frequency polygons, and ogives

  • 1. 28-Jul-15 1 Histograms, Frequency Polygons, and Ogives Section 2.3 Objectives Represent data in frequency distributions graphically using histograms, frequency polygons, and ogives. Purpose of Statistical Graphs • To convey the data to the viewers in pictorial form – It is easier for the most people, especially people without a background in statistics, to comprehend the meaning of data presented as a picture rather than data presented as a table. • To describe the data set graphically • To analyze the data set (Distribution of data set) • To summarize a data set • To discover a trend or pattern in a situation over a period of time • To capture viewers’ attention in a publication or during a presentation What is a histogram? A bar graph that displays the data from a frequency distribution ◦ Horizontal Scale (x- axis) is labeled using CLASS BOUNDARIES ◦ Vertical Scale (y-axis) is labeled using frequency ◦ NOTE: bars are contiguous (No gaps) How do I create a histogram from a grouped frequency distribution? STEP 1: Draw the x- and y-axes STEP 2: Label the x-axis using the class boundaries STEP 3: Label the y-axis using an appropriate scale that encompasses the high and low frequencies STEP 4: Draw the contiguous vertical bars Example-Construct a histogram of the ages of Nextel Cup Drivers. Use the class boundaries as the scale on the x-axis Ages of NASCAR Nextel Cup Drivers in Years (NASCAR.com) (Data is ranked---Collected Spring 2008) 21 21 21 23 23 23 24 25 25 26 26 26 26 27 27 28 28 28 28 29 29 29 29 30 30 30 30 31 31 31 31 31 32 34 35 35 35 36 36 37 37 38 38 39 41 42 42 42 43 43 43 44 44 44 44 45 45 46 47 48 48 48 49 49 49 50 50 51 51 65 72
  • 2. 28-Jul-15 2 NASCAR Nextel Cup Drivers’ Ages Class Limits (Ages in Years) Class Boundaries Frequencies 20-29 19.5-29.5 23 30-39 29.5-39.5 21 40-49 39.5-49.5 21 50-59 49.5-59.5 4 60-69 59.5-69.5 1 70-79 69.5-79.5 1 Frequency Polygon Line graph (rather than a bar graph) Uses class midpoints rather than class boundaries on x- axis Ogive (Cumulative Frequency Polygon) • Line graph (rather than a bar graph) • Uses class boundaries on x-axis • Uses cumulative frequencies (total as you go) rather than individual class frequencies • Used to visually represent how many values are below a specified upper class boundary Another possibility • We can use the percentage (relative frequency) rather than the “tallies” (frequency) on the x- axis. – Relative Frequency Histogram – Relative Frequency Polygon – Relative Frequency Ogive • Used when a comparison between two data sets is desired, especially if the data sets are two different sizes • Overall shape (distribution) of graph is the same, but we use a % on the y-axis scale Important Characteristics of Data Center: a representative or average value that indicates where the middle of the data set is located (Chapter 3) Variation: a measure of the amount that the values vary among themselves Distribution: the nature or shape of the distribution of data (such as bell-shaped, uniform, or skewed) Outliers: Sample values that lie very far away from the majority of other sample values Time: Changing characteristics of data over time Distribution The nature or shape of the distribution can be determined by viewing the histogram or other graphs. Knowing the shape of the distribution helps to determine the appropriate statistical methods to use when analyzing the data. Distributions are most often not perfectly shaped, so focus on the overall pattern, not the exact shape
  • 3. 28-Jul-15 3 Common Distribution Shapes (p. 56) Bell-shaped (Normal) has a single peak and tapers at either end Uniform is basically flat or rectangular J-shaped has few data on the left and increases as you move to the right Reverse J-shaped has a lot of data on the left and decreases as you move to the right Right Skewed peaks on the left and tapers on the right Left Skewed peaks on the right and tapers on the left Bimodal has two peaks of same height U-shaped peaks on left and right with dip in center Distribution Decision Making When you analyze histograms, look at the shape of the curve and ask yourself: ◦ Does it have one peak or two peaks? ◦ Is it relatively flat? ◦ Is it relatively U-shaped? ◦ Are the data values spread out on the graph? ◦ Are the data values clustered around the center? ◦ Are the data values clustered on the right or left ends? ◦ Are there data values in the extreme ends? (outliers)