Download to read offline


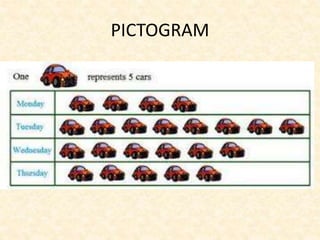
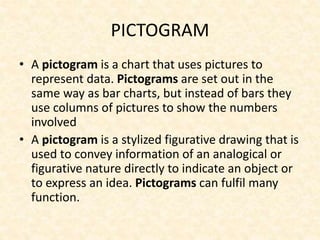
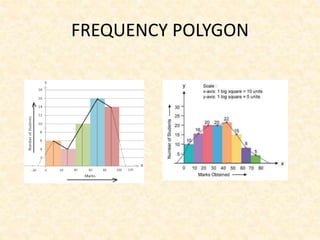
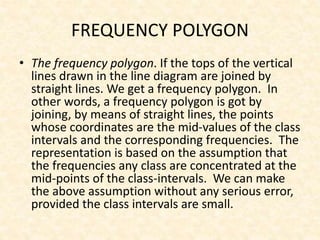
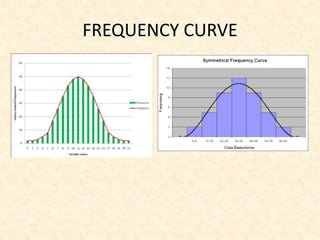
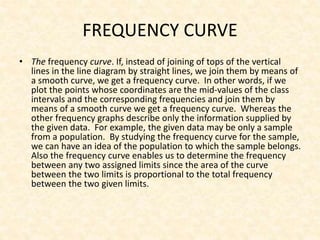
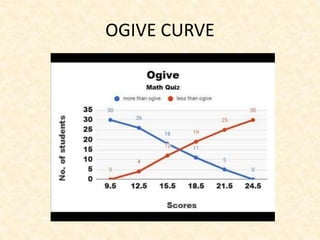
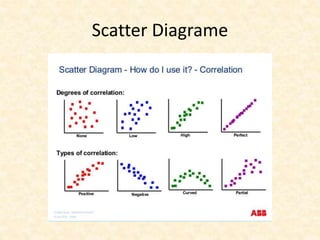
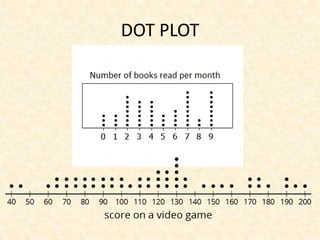
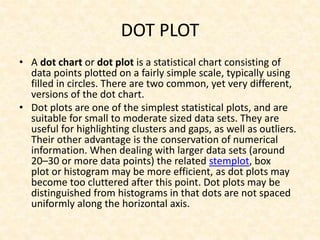
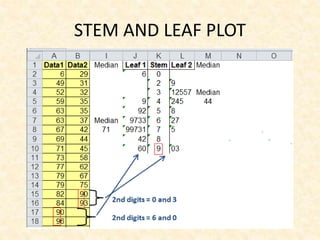
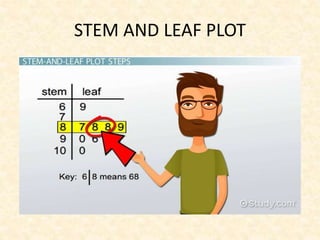
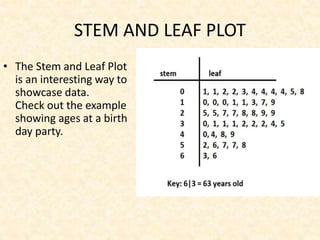
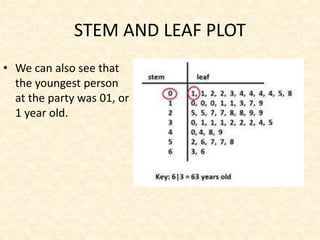
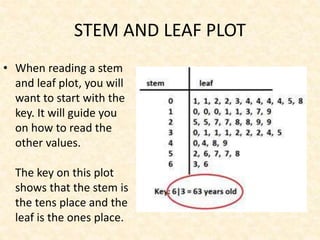
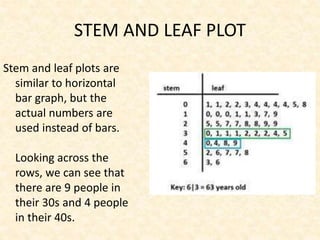
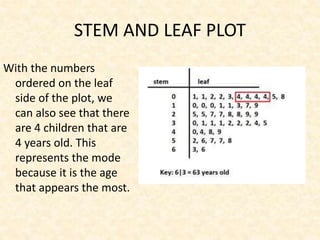
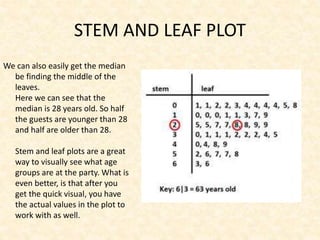
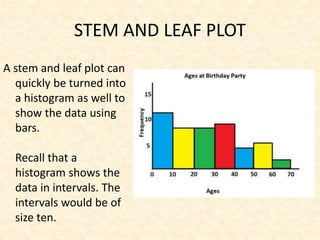
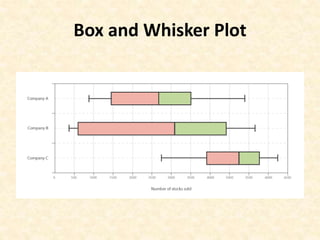
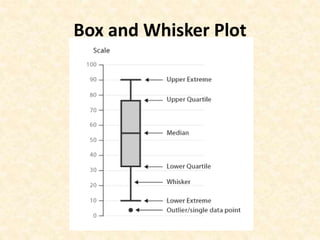


The document discusses various types of statistical diagrams and graphs that can be used to represent numerical data in a visual format. It describes line diagrams, bar diagrams, component bar diagrams, percentage bar diagrams, pie charts, pictograms, frequency graphs including histograms, frequency polygons, frequency curves and ogives. It also covers scatter diagrams, dot plots, stem-and-leaf plots, box-and-whisker plots and their uses in visually representing data distributions.