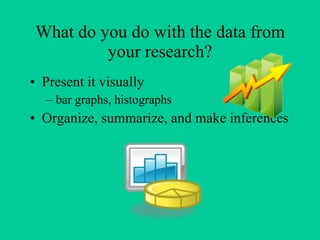
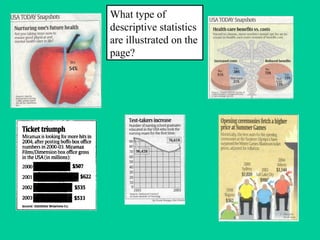
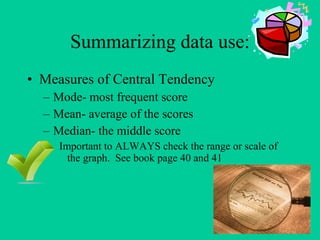
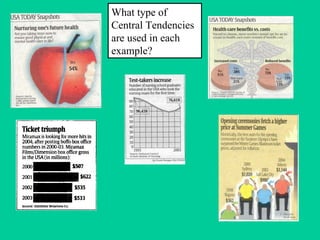
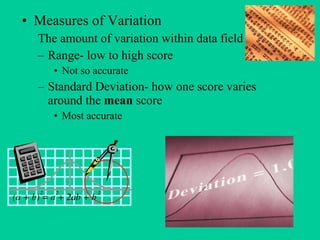
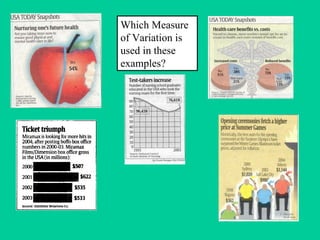
Descriptive Statistics
What do you do with the data from your research? Present it visually bar graphs, histographs Organize, summarize, and make inferences
What type of descriptive statistics are illustrated on the page?
Summarizing data use: Measures of Central Tendency Mode- most frequent score Mean- average of the scores Median- the middle score Important to ALWAYS check the range or scale of the graph.  See book page 40 and 41
What type of Central Tendencies are used in each example?
Measures of Variation The amount of variation within data field Range- low to high score Not so accurate Standard Deviation- how one score varies around the  mean  score Most accurate
Which Measure of Variation is used in these examples?
How do I know that any difference is reliable? Know what population is sampled Look for consistency More population the better
How do I know if there is a Statistical Difference? Are the sample averages reliable? Is the difference between them relatively large? Does it indicate the likelihood that the result happened  by chance? Remember- that it does not indicate the  importance  of the result
Lab Assignment Find a graph in a current magazine or newspaper. Analyze it and look for: How the ad is used (purpose)? What statistics are used to make a point? Who did the research? What other features are used to influence the reader? Type your answer and turn it in at your next class meeting.

Descriptive statistics

  • 1.
  • 2.
    What do youdo with the data from your research? Present it visually bar graphs, histographs Organize, summarize, and make inferences
  • 3.
    What type ofdescriptive statistics are illustrated on the page?
  • 4.
    Summarizing data use:Measures of Central Tendency Mode- most frequent score Mean- average of the scores Median- the middle score Important to ALWAYS check the range or scale of the graph. See book page 40 and 41
  • 5.
    What type ofCentral Tendencies are used in each example?
  • 6.
    Measures of VariationThe amount of variation within data field Range- low to high score Not so accurate Standard Deviation- how one score varies around the mean score Most accurate
  • 7.
    Which Measure ofVariation is used in these examples?
  • 8.
    How do Iknow that any difference is reliable? Know what population is sampled Look for consistency More population the better
  • 9.
    How do Iknow if there is a Statistical Difference? Are the sample averages reliable? Is the difference between them relatively large? Does it indicate the likelihood that the result happened by chance? Remember- that it does not indicate the importance of the result
  • 10.
    Lab Assignment Finda graph in a current magazine or newspaper. Analyze it and look for: How the ad is used (purpose)? What statistics are used to make a point? Who did the research? What other features are used to influence the reader? Type your answer and turn it in at your next class meeting.