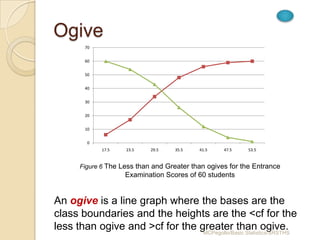
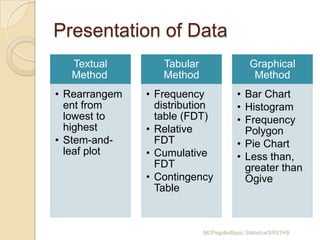
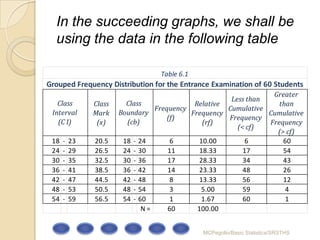
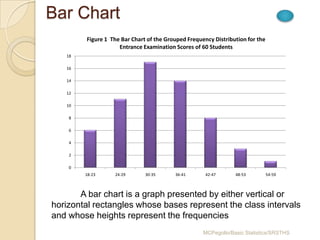
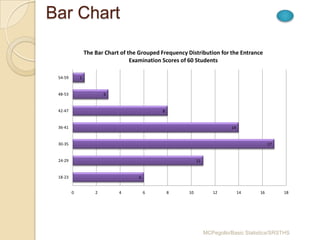
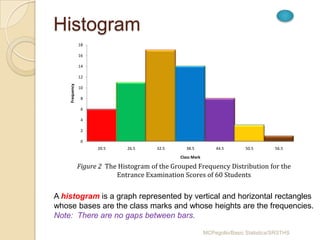
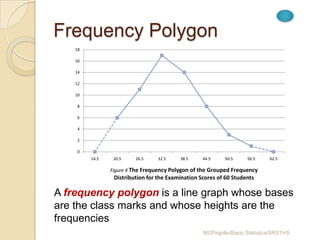
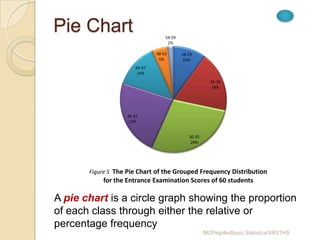
SlideShare a Scribd company logo
Presentation of Data
(Graphical Method)


Module 6b
Basic Statistics
SRSTHS
Ms. Pegollo
Presentation of Data
Objectives: At the end of the lesson,
  the students should be able to:
1. Identify specific data appropriate to
    use for graphs
2. Create graphs
3. Read and interpret graphs


                        MCPegollo/Basic Statistics/SRSTHS
Presentation of Data
  Textual         Tabular                    Graphical
  Method          Method                      Method
• Rearrangem   • Frequency              • Bar Chart
  ent from       distribution           • Histogram
  lowest to      table (FDT)            • Frequency
  highest      • Relative                 Polygon
• Stem-and-      FDT                    • Pie Chart
  leaf plot    • Cumulative             • Less than,
                 FDT                      greater than
               • Contingency              Ogive
                 Table


                            MCPegollo/Basic Statistics/SRSTHS
Graphical Method
    Graphs add beauty and color to
one’s presentation, moreover, it helps
facilitate comparison and interpretation
without going through the numerical
data.


                        MCPegollo/Basic Statistics/SRSTHS
In the succeeding graphs, we shall be
  using the data in the following table

                                  Table 6.1
Grouped Frequency Distribution for the Entrance Examination of 60 Students
                                                                 Greater
                                                      Less than
   Class       Class     Class              Relative               than
                                 Frequency           Cumulative
 Interval      Mark    Boundary            Frequency            Cumulative
                                     (f)             Frequency
   (C I)        (x)      (cb)                  (rf)             Frequency
                                                        (< cf)
                                                                  (> cf)
 18   -   23   20.5     18 - 24       6       10.00       6         60
 24   -   29   26.5     24 - 30      11       18.33       17        54
 30   -   35   32.5     30 - 36      17       28.33       34        43
 36   -   41   38.5     36 - 42      14       23.33       48        26
 42   -   47   44.5     42 - 48       8       13.33       56        12
 48   -   53   50.5     48 - 54       3        5.00       59         4
 54   -   59   56.5     54 - 60       1        1.67       60         1
                              N=     60      100.00


                                              MCPegollo/Basic Statistics/SRSTHS
Bar Chart
        Figure 1 The Bar Chart of the Grouped Frequency Distribution for the
                    Entrance Examination Scores of 60 Students
   18

   16

   14

   12

   10

    8

    6

    4

    2

    0
        18-23     24-29       30-35      36-41       42-47      48-53          54-59


       A bar chart is a graph presented by either vertical or
horizontal rectangles whose bases represent the class intervals
and whose heights represent the frequencies
                                                    MCPegollo/Basic Statistics/SRSTHS
Bar Chart

                 The Bar Chart of the Grouped Frequency Distribution for the Entrance
                                   Examination Scores of 60 Students

 54-59       1


 48-53                   3


 42-47                                         8


 36-41                                                                       14


 30-35                                                                                       17


 24-29                                                        11


 18-23                                6


         0           2        4           6        8     10           12          14    16        18


                                                                   MCPegollo/Basic Statistics/SRSTHS
Histogram
                18

                16

                14

                12
    Frequency


                10

                 8

                 6

                 4

                 2

                 0
                      20.5     26.5      32.5      38.5          44.5        50.5       56.5
                                                Class Mark

                Figure 2 The Histogram of the Grouped Frequency Distribution for the
                            Entrance Examination Scores of 60 Students


A histogram is a graph represented by vertical and horizontal rectangles
whose bases are the class marks and whose heights are the frequencies.
Note: There are no gaps between bars.

                                                             MCPegollo/Basic Statistics/SRSTHS
Frequency Polygon
    18

    16

    14

    12

    10

    8

    6

    4

    2

    0
         14.5    20.5    26.5     32.5    38.5     44.5    50.5     56.5    62.5

                Figure 4 The Frequency Polygon of the Grouped Frequency
                 Distribution for the Examination Scores of 60 Students

A frequency polygon is a line graph whose bases
are the class marks and whose heights are the
frequencies
                                                   MCPegollo/Basic Statistics/SRSTHS
Pie Chart                         54-59
                                   2%

                              48-53       18-23
                               5%          10%
                      42-47
                       14%
                                                       24-29
                                                        18%


                   36-41
                    23%


                                             30-35
                                              28%


       Figure 5 The Pie Chart of the Grouped Frequency Distribution
           for the Entrance Examination Scores of 60 students

A pie chart is a circle graph showing the proportion
of each class through either the relative or
percentage frequency
                                                     MCPegollo/Basic Statistics/SRSTHS
Ogive
        70


        60


        50


        40


        30


        20


        10


        0
             17.5   23.5    29.5   35.5    41.5    47.5   53.5


      Figure 6 The Less than and Greater than ogives for the Entrance
                    Examination Scores of 60 students


An ogive is a line graph where the bases are the
class boundaries and the heights are the <cf for the
less than ogive and >cf for the greater than ogive.
                                 MCPegollo/Basic Statistics/SRSTHS
Quiz
Which parts of the FDT are used in
constructing the following:
1. Bar Chart
2. Histogram
3. Frequency Polygon
4. Pie Chart
5. Ogive


                      MCPegollo/Basic Statistics/SRSTHS
Activity 1 (Think-Pair-Share )
Insurance companies conduct
continuous research on ages at death
and causes of death. The following
table shows the ages at death and the
corresponding frequencies. Construct
the following graphs:    Age at Freq.
                         Death
1. Bar chart
                         16 - 25 22
2. Histogram             26 - 35 10
                          36 –    6
3. Frequency Polygon       45
4. Pie Chart              46 –    2
                           55
5. Ogives                 56 –    4
                             65
                      MCPegollo/Basic Statistics/SRSTHS
Due on Feb. 3
Activity 2 (Pair Project)  Use short bond papers
                           Mention sampling technique
                           and data gathering method
                           used.
    Gather data(interval or ratio level only)
    from 50 members in your batch. Using
    Microsoft Excel, construct a/an
    1. Complete FDT
    2. Bar chart
    3. Histogram
    4. Frequency Polygon
    5. Pie Chart
    6. Ogive
                            MCPegollo/Basic Statistics/SRSTHS

More Related Content

What's hot

Ch1 The Nature of Statistics
Ch1 The Nature of StatisticsCh1 The Nature of Statistics
Ch1 The Nature of StatisticsFarhan Alfin
 
frequency distribution & graphs
frequency distribution & graphsfrequency distribution & graphs
frequency distribution & graphsTirtha_Nil
 
Descriptive statistics
Descriptive statisticsDescriptive statistics
Descriptive statisticsAileen Balbido
 
Data presentation
Data presentationData presentation
Data presentationWeam Banjar
 
Writing results and discussion chapters for quantitative research
Writing results and discussion chapters for quantitative researchWriting results and discussion chapters for quantitative research
Writing results and discussion chapters for quantitative researchMartin McMorrow
 
Chapter 2
Chapter 2Chapter 2
Chapter 2Lem Lem
 
Basics stat ppt-types of data
Basics stat ppt-types of dataBasics stat ppt-types of data
Basics stat ppt-types of dataFarhana Shaheen
 
Normal or skewed distributions (descriptive both2) - Copyright updated
Normal or skewed distributions (descriptive both2) - Copyright updatedNormal or skewed distributions (descriptive both2) - Copyright updated
Normal or skewed distributions (descriptive both2) - Copyright updatedKen Plummer
 
Testing Assumptions in repeated Measures Design using SPSS
Testing Assumptions in repeated Measures Design using SPSSTesting Assumptions in repeated Measures Design using SPSS
Testing Assumptions in repeated Measures Design using SPSSJ P Verma
 
Introduction to Statistics
Introduction to StatisticsIntroduction to Statistics
Introduction to StatisticsRobert Tinaro
 
Basics of Statistical Analysis
Basics of Statistical AnalysisBasics of Statistical Analysis
Basics of Statistical Analysisaschrdc
 
Data presentation Lecture
Data presentation Lecture Data presentation Lecture
Data presentation Lecture AB Rajar
 

What's hot (20)

Ch1 The Nature of Statistics
Ch1 The Nature of StatisticsCh1 The Nature of Statistics
Ch1 The Nature of Statistics
 
frequency distribution & graphs
frequency distribution & graphsfrequency distribution & graphs
frequency distribution & graphs
 
biostatistics basic
biostatistics basic biostatistics basic
biostatistics basic
 
Descriptive statistics
Descriptive statisticsDescriptive statistics
Descriptive statistics
 
Data presentation
Data presentationData presentation
Data presentation
 
Writing results and discussion chapters for quantitative research
Writing results and discussion chapters for quantitative researchWriting results and discussion chapters for quantitative research
Writing results and discussion chapters for quantitative research
 
Chapter 2
Chapter 2Chapter 2
Chapter 2
 
Chp 4
Chp 4Chp 4
Chp 4
 
Statistical tests
Statistical tests Statistical tests
Statistical tests
 
Basics stat ppt-types of data
Basics stat ppt-types of dataBasics stat ppt-types of data
Basics stat ppt-types of data
 
Bar chart
Bar chartBar chart
Bar chart
 
Organizing data
Organizing dataOrganizing data
Organizing data
 
Normal or skewed distributions (descriptive both2) - Copyright updated
Normal or skewed distributions (descriptive both2) - Copyright updatedNormal or skewed distributions (descriptive both2) - Copyright updated
Normal or skewed distributions (descriptive both2) - Copyright updated
 
Testing Assumptions in repeated Measures Design using SPSS
Testing Assumptions in repeated Measures Design using SPSSTesting Assumptions in repeated Measures Design using SPSS
Testing Assumptions in repeated Measures Design using SPSS
 
Presentationofdata
PresentationofdataPresentationofdata
Presentationofdata
 
Pie Chart
Pie  ChartPie  Chart
Pie Chart
 
Introduction to Statistics
Introduction to StatisticsIntroduction to Statistics
Introduction to Statistics
 
Basics of Statistical Analysis
Basics of Statistical AnalysisBasics of Statistical Analysis
Basics of Statistical Analysis
 
Statistical graphs
Statistical graphsStatistical graphs
Statistical graphs
 
Data presentation Lecture
Data presentation Lecture Data presentation Lecture
Data presentation Lecture
 

Viewers also liked

Guideline for interpreting correlation coefficient
Guideline for interpreting correlation coefficientGuideline for interpreting correlation coefficient
Guideline for interpreting correlation coefficientPhanny ITH
 
Basic Statistics & Data Analysis
Basic Statistics & Data AnalysisBasic Statistics & Data Analysis
Basic Statistics & Data AnalysisAjendra Sharma
 
Lesson 8 Linear Correlation And Regression
Lesson 8 Linear Correlation And RegressionLesson 8 Linear Correlation And Regression
Lesson 8 Linear Correlation And RegressionSumit Prajapati
 
Correlation & Regression
Correlation & RegressionCorrelation & Regression
Correlation & RegressionGrant Heller
 
Pearson Correlation, Spearman Correlation &Linear Regression
Pearson Correlation, Spearman Correlation &Linear RegressionPearson Correlation, Spearman Correlation &Linear Regression
Pearson Correlation, Spearman Correlation &Linear RegressionAzmi Mohd Tamil
 
Correlation analysis ppt
Correlation analysis pptCorrelation analysis ppt
Correlation analysis pptAnil Mishra
 
Correlation and regression
Correlation and regressionCorrelation and regression
Correlation and regressionKhalid Aziz
 

Viewers also liked (11)

Guideline for interpreting correlation coefficient
Guideline for interpreting correlation coefficientGuideline for interpreting correlation coefficient
Guideline for interpreting correlation coefficient
 
Basic Statistics & Data Analysis
Basic Statistics & Data AnalysisBasic Statistics & Data Analysis
Basic Statistics & Data Analysis
 
Correlation
CorrelationCorrelation
Correlation
 
Lesson 8 Linear Correlation And Regression
Lesson 8 Linear Correlation And RegressionLesson 8 Linear Correlation And Regression
Lesson 8 Linear Correlation And Regression
 
Correlation & Regression
Correlation & RegressionCorrelation & Regression
Correlation & Regression
 
Correlation
CorrelationCorrelation
Correlation
 
Correlation analysis
Correlation analysisCorrelation analysis
Correlation analysis
 
Pearson Correlation, Spearman Correlation &Linear Regression
Pearson Correlation, Spearman Correlation &Linear RegressionPearson Correlation, Spearman Correlation &Linear Regression
Pearson Correlation, Spearman Correlation &Linear Regression
 
Correlation and Simple Regression
Correlation  and Simple RegressionCorrelation  and Simple Regression
Correlation and Simple Regression
 
Correlation analysis ppt
Correlation analysis pptCorrelation analysis ppt
Correlation analysis ppt
 
Correlation and regression
Correlation and regressionCorrelation and regression
Correlation and regression
 

Similar to Presentationofdatamod6b

The more we get together
The more we get togetherThe more we get together
The more we get togetherLilian May Ando
 
ANALYSING DATA TECHNIQUES
ANALYSING DATA TECHNIQUESANALYSING DATA TECHNIQUES
ANALYSING DATA TECHNIQUESAzam Ghaffar
 
Descriptive Analysis in Statistics
Descriptive Analysis in StatisticsDescriptive Analysis in Statistics
Descriptive Analysis in StatisticsAzmi Mohd Tamil
 
Elementary statistics
Elementary statisticsElementary statistics
Elementary statisticsBharat Naruka
 
lecture 4 Graphs.pptx
lecture 4 Graphs.pptxlecture 4 Graphs.pptx
lecture 4 Graphs.pptxssuser378d7c
 
02 ch ken black solution
02 ch ken black solution02 ch ken black solution
02 ch ken black solutionKrunal Shah
 
Business Statistics Chapter 2
Business Statistics Chapter 2Business Statistics Chapter 2
Business Statistics Chapter 2Lux PP
 
Applied Math 40S March 17, 2008
Applied Math 40S March 17, 2008Applied Math 40S March 17, 2008
Applied Math 40S March 17, 2008Darren Kuropatwa
 
Willie Evangelista - Presentation of data
Willie Evangelista -  Presentation of data Willie Evangelista -  Presentation of data
Willie Evangelista - Presentation of data Willie Evangelista
 
Lecture03 displaying data
Lecture03 displaying dataLecture03 displaying data
Lecture03 displaying databilal samad
 
Lecture 3 Data Presentation in biostatistics. ppt
Lecture 3 Data Presentation in biostatistics. pptLecture 3 Data Presentation in biostatistics. ppt
Lecture 3 Data Presentation in biostatistics. pptmartineshija769
 
Applied 40S March 24, 2009
Applied 40S March 24, 2009Applied 40S March 24, 2009
Applied 40S March 24, 2009Darren Kuropatwa
 
Lecture 2 Organizing and Displaying Data.pptx
Lecture 2 Organizing and Displaying Data.pptxLecture 2 Organizing and Displaying Data.pptx
Lecture 2 Organizing and Displaying Data.pptxshakirRahman10
 

Similar to Presentationofdatamod6b (20)

The more we get together
The more we get togetherThe more we get together
The more we get together
 
ANALYSING DATA TECHNIQUES
ANALYSING DATA TECHNIQUESANALYSING DATA TECHNIQUES
ANALYSING DATA TECHNIQUES
 
Descriptive Analysis in Statistics
Descriptive Analysis in StatisticsDescriptive Analysis in Statistics
Descriptive Analysis in Statistics
 
Data presentation
Data presentationData presentation
Data presentation
 
Elementary statistics
Elementary statisticsElementary statistics
Elementary statistics
 
lecture 4 Graphs.pptx
lecture 4 Graphs.pptxlecture 4 Graphs.pptx
lecture 4 Graphs.pptx
 
02 ch ken black solution
02 ch ken black solution02 ch ken black solution
02 ch ken black solution
 
Practice test1 solution
Practice test1 solutionPractice test1 solution
Practice test1 solution
 
Business Statistics Chapter 2
Business Statistics Chapter 2Business Statistics Chapter 2
Business Statistics Chapter 2
 
Applied Math 40S March 17, 2008
Applied Math 40S March 17, 2008Applied Math 40S March 17, 2008
Applied Math 40S March 17, 2008
 
Section 1-5
Section 1-5Section 1-5
Section 1-5
 
Willie Evangelista - Presentation of data
Willie Evangelista -  Presentation of data Willie Evangelista -  Presentation of data
Willie Evangelista - Presentation of data
 
Presentation of data mod 6
Presentation of data mod 6Presentation of data mod 6
Presentation of data mod 6
 
Understanding data through presentation_contd
Understanding data through presentation_contdUnderstanding data through presentation_contd
Understanding data through presentation_contd
 
Lecture03 displaying data
Lecture03 displaying dataLecture03 displaying data
Lecture03 displaying data
 
Chapter3
Chapter3Chapter3
Chapter3
 
Basic statics
Basic staticsBasic statics
Basic statics
 
Lecture 3 Data Presentation in biostatistics. ppt
Lecture 3 Data Presentation in biostatistics. pptLecture 3 Data Presentation in biostatistics. ppt
Lecture 3 Data Presentation in biostatistics. ppt
 
Applied 40S March 24, 2009
Applied 40S March 24, 2009Applied 40S March 24, 2009
Applied 40S March 24, 2009
 
Lecture 2 Organizing and Displaying Data.pptx
Lecture 2 Organizing and Displaying Data.pptxLecture 2 Organizing and Displaying Data.pptx
Lecture 2 Organizing and Displaying Data.pptx
 

More from Chie Pegollo

Counting Technique, Permutation, Combination
Counting Technique, Permutation, CombinationCounting Technique, Permutation, Combination
Counting Technique, Permutation, CombinationChie Pegollo
 
Sampling techniquesmod5
Sampling techniquesmod5Sampling techniquesmod5
Sampling techniquesmod5Chie Pegollo
 
Counting techniques
Counting techniquesCounting techniques
Counting techniquesChie Pegollo
 
Measures of central tendency
Measures of central tendencyMeasures of central tendency
Measures of central tendencyChie Pegollo
 
Measuresofcentraltendencygrpdata
MeasuresofcentraltendencygrpdataMeasuresofcentraltendencygrpdata
MeasuresofcentraltendencygrpdataChie Pegollo
 
Presentationofdatamod6b
Presentationofdatamod6bPresentationofdatamod6b
Presentationofdatamod6bChie Pegollo
 
Abuses of statistics
Abuses of statisticsAbuses of statistics
Abuses of statisticsChie Pegollo
 
Abuses Of Statistics
Abuses Of StatisticsAbuses Of Statistics
Abuses Of StatisticsChie Pegollo
 

More from Chie Pegollo (13)

Counting Technique, Permutation, Combination
Counting Technique, Permutation, CombinationCounting Technique, Permutation, Combination
Counting Technique, Permutation, Combination
 
Sampling techniquesmod5
Sampling techniquesmod5Sampling techniquesmod5
Sampling techniquesmod5
 
Counting techniques
Counting techniquesCounting techniques
Counting techniques
 
Measures of central tendency
Measures of central tendencyMeasures of central tendency
Measures of central tendency
 
Measuresofcentraltendencygrpdata
MeasuresofcentraltendencygrpdataMeasuresofcentraltendencygrpdata
Measuresofcentraltendencygrpdata
 
Presentationofdatamod6b
Presentationofdatamod6bPresentationofdatamod6b
Presentationofdatamod6b
 
Data gathering
Data gatheringData gathering
Data gathering
 
Abuses of statistics
Abuses of statisticsAbuses of statistics
Abuses of statistics
 
Module 3
Module 3Module 3
Module 3
 
Abuses Of Statistics
Abuses Of StatisticsAbuses Of Statistics
Abuses Of Statistics
 
 
Module 2
Module 2Module 2
Module 2
 
Basic statistics
Basic statisticsBasic statistics
Basic statistics
 

Recently uploaded

Sha'Carri Richardson Presentation 202345
Sha'Carri Richardson Presentation 202345Sha'Carri Richardson Presentation 202345
Sha'Carri Richardson Presentation 202345beazzy04
 
Benefits and Challenges of Using Open Educational Resources
Benefits and Challenges of Using Open Educational ResourcesBenefits and Challenges of Using Open Educational Resources
Benefits and Challenges of Using Open Educational Resourcesdimpy50
 
Fish and Chips - have they had their chips
Fish and Chips - have they had their chipsFish and Chips - have they had their chips
Fish and Chips - have they had their chipsGeoBlogs
 
aaaaaaaaaaaaaaaaaaaaaaaaaaaaaaaaaaaaaaaaa
aaaaaaaaaaaaaaaaaaaaaaaaaaaaaaaaaaaaaaaaaaaaaaaaaaaaaaaaaaaaaaaaaaaaaaaaaaaaaaaaaa
aaaaaaaaaaaaaaaaaaaaaaaaaaaaaaaaaaaaaaaaasiemaillard
 
Forest and Wildlife Resources Class 10 Free Study Material PDF
Forest and Wildlife Resources Class 10 Free Study Material PDFForest and Wildlife Resources Class 10 Free Study Material PDF
Forest and Wildlife Resources Class 10 Free Study Material PDFVivekanand Anglo Vedic Academy
 
50 ĐỀ LUYỆN THI IOE LỚP 9 - NĂM HỌC 2022-2023 (CÓ LINK HÌNH, FILE AUDIO VÀ ĐÁ...
50 ĐỀ LUYỆN THI IOE LỚP 9 - NĂM HỌC 2022-2023 (CÓ LINK HÌNH, FILE AUDIO VÀ ĐÁ...50 ĐỀ LUYỆN THI IOE LỚP 9 - NĂM HỌC 2022-2023 (CÓ LINK HÌNH, FILE AUDIO VÀ ĐÁ...
50 ĐỀ LUYỆN THI IOE LỚP 9 - NĂM HỌC 2022-2023 (CÓ LINK HÌNH, FILE AUDIO VÀ ĐÁ...Nguyen Thanh Tu Collection
 
The Benefits and Challenges of Open Educational Resources
The Benefits and Challenges of Open Educational ResourcesThe Benefits and Challenges of Open Educational Resources
The Benefits and Challenges of Open Educational Resourcesaileywriter
 
GIÁO ÁN DẠY THÊM (KẾ HOẠCH BÀI BUỔI 2) - TIẾNG ANH 8 GLOBAL SUCCESS (2 CỘT) N...
GIÁO ÁN DẠY THÊM (KẾ HOẠCH BÀI BUỔI 2) - TIẾNG ANH 8 GLOBAL SUCCESS (2 CỘT) N...GIÁO ÁN DẠY THÊM (KẾ HOẠCH BÀI BUỔI 2) - TIẾNG ANH 8 GLOBAL SUCCESS (2 CỘT) N...
GIÁO ÁN DẠY THÊM (KẾ HOẠCH BÀI BUỔI 2) - TIẾNG ANH 8 GLOBAL SUCCESS (2 CỘT) N...Nguyen Thanh Tu Collection
 
Advances in production technology of Grapes.pdf
Advances in production technology of Grapes.pdfAdvances in production technology of Grapes.pdf
Advances in production technology of Grapes.pdfDr. M. Kumaresan Hort.
 
2024_Student Session 2_ Set Plan Preparation.pptx
2024_Student Session 2_ Set Plan Preparation.pptx2024_Student Session 2_ Set Plan Preparation.pptx
2024_Student Session 2_ Set Plan Preparation.pptxmansk2
 
Palestine last event orientationfvgnh .pptx
Palestine last event orientationfvgnh .pptxPalestine last event orientationfvgnh .pptx
Palestine last event orientationfvgnh .pptxRaedMohamed3
 
Gyanartha SciBizTech Quiz slideshare.pptx
Gyanartha SciBizTech Quiz slideshare.pptxGyanartha SciBizTech Quiz slideshare.pptx
Gyanartha SciBizTech Quiz slideshare.pptxShibin Azad
 
Solid waste management & Types of Basic civil Engineering notes by DJ Sir.pptx
Solid waste management & Types of Basic civil Engineering notes by DJ Sir.pptxSolid waste management & Types of Basic civil Engineering notes by DJ Sir.pptx
Solid waste management & Types of Basic civil Engineering notes by DJ Sir.pptxDenish Jangid
 
aaaaaaaaaaaaaaaaaaaaaaaaaaaaaaaaaaaaaaaaaaaaaaaaaaaaaaa
aaaaaaaaaaaaaaaaaaaaaaaaaaaaaaaaaaaaaaaaaaaaaaaaaaaaaaaaaaaaaaaaaaaaaaaaaaaaaaaaaaaaaaaaaaaaaaaaaaaaaaaaaaaaaa
aaaaaaaaaaaaaaaaaaaaaaaaaaaaaaaaaaaaaaaaaaaaaaaaaaaaaaasiemaillard
 
Jose-Rizal-and-Philippine-Nationalism-National-Symbol-2.pptx
Jose-Rizal-and-Philippine-Nationalism-National-Symbol-2.pptxJose-Rizal-and-Philippine-Nationalism-National-Symbol-2.pptx
Jose-Rizal-and-Philippine-Nationalism-National-Symbol-2.pptxricssacare
 
MARUTI SUZUKI- A Successful Joint Venture in India.pptx
MARUTI SUZUKI- A Successful Joint Venture in India.pptxMARUTI SUZUKI- A Successful Joint Venture in India.pptx
MARUTI SUZUKI- A Successful Joint Venture in India.pptxbennyroshan06
 
UNIT – IV_PCI Complaints: Complaints and evaluation of complaints, Handling o...
UNIT – IV_PCI Complaints: Complaints and evaluation of complaints, Handling o...UNIT – IV_PCI Complaints: Complaints and evaluation of complaints, Handling o...
UNIT – IV_PCI Complaints: Complaints and evaluation of complaints, Handling o...Sayali Powar
 

Recently uploaded (20)

Sha'Carri Richardson Presentation 202345
Sha'Carri Richardson Presentation 202345Sha'Carri Richardson Presentation 202345
Sha'Carri Richardson Presentation 202345
 
Benefits and Challenges of Using Open Educational Resources
Benefits and Challenges of Using Open Educational ResourcesBenefits and Challenges of Using Open Educational Resources
Benefits and Challenges of Using Open Educational Resources
 
Fish and Chips - have they had their chips
Fish and Chips - have they had their chipsFish and Chips - have they had their chips
Fish and Chips - have they had their chips
 
aaaaaaaaaaaaaaaaaaaaaaaaaaaaaaaaaaaaaaaaa
aaaaaaaaaaaaaaaaaaaaaaaaaaaaaaaaaaaaaaaaaaaaaaaaaaaaaaaaaaaaaaaaaaaaaaaaaaaaaaaaaa
aaaaaaaaaaaaaaaaaaaaaaaaaaaaaaaaaaaaaaaaa
 
Forest and Wildlife Resources Class 10 Free Study Material PDF
Forest and Wildlife Resources Class 10 Free Study Material PDFForest and Wildlife Resources Class 10 Free Study Material PDF
Forest and Wildlife Resources Class 10 Free Study Material PDF
 
50 ĐỀ LUYỆN THI IOE LỚP 9 - NĂM HỌC 2022-2023 (CÓ LINK HÌNH, FILE AUDIO VÀ ĐÁ...
50 ĐỀ LUYỆN THI IOE LỚP 9 - NĂM HỌC 2022-2023 (CÓ LINK HÌNH, FILE AUDIO VÀ ĐÁ...50 ĐỀ LUYỆN THI IOE LỚP 9 - NĂM HỌC 2022-2023 (CÓ LINK HÌNH, FILE AUDIO VÀ ĐÁ...
50 ĐỀ LUYỆN THI IOE LỚP 9 - NĂM HỌC 2022-2023 (CÓ LINK HÌNH, FILE AUDIO VÀ ĐÁ...
 
The Benefits and Challenges of Open Educational Resources
The Benefits and Challenges of Open Educational ResourcesThe Benefits and Challenges of Open Educational Resources
The Benefits and Challenges of Open Educational Resources
 
GIÁO ÁN DẠY THÊM (KẾ HOẠCH BÀI BUỔI 2) - TIẾNG ANH 8 GLOBAL SUCCESS (2 CỘT) N...
GIÁO ÁN DẠY THÊM (KẾ HOẠCH BÀI BUỔI 2) - TIẾNG ANH 8 GLOBAL SUCCESS (2 CỘT) N...GIÁO ÁN DẠY THÊM (KẾ HOẠCH BÀI BUỔI 2) - TIẾNG ANH 8 GLOBAL SUCCESS (2 CỘT) N...
GIÁO ÁN DẠY THÊM (KẾ HOẠCH BÀI BUỔI 2) - TIẾNG ANH 8 GLOBAL SUCCESS (2 CỘT) N...
 
Advances in production technology of Grapes.pdf
Advances in production technology of Grapes.pdfAdvances in production technology of Grapes.pdf
Advances in production technology of Grapes.pdf
 
2024_Student Session 2_ Set Plan Preparation.pptx
2024_Student Session 2_ Set Plan Preparation.pptx2024_Student Session 2_ Set Plan Preparation.pptx
2024_Student Session 2_ Set Plan Preparation.pptx
 
Ethnobotany and Ethnopharmacology ......
Ethnobotany and Ethnopharmacology ......Ethnobotany and Ethnopharmacology ......
Ethnobotany and Ethnopharmacology ......
 
Introduction to Quality Improvement Essentials
Introduction to Quality Improvement EssentialsIntroduction to Quality Improvement Essentials
Introduction to Quality Improvement Essentials
 
Palestine last event orientationfvgnh .pptx
Palestine last event orientationfvgnh .pptxPalestine last event orientationfvgnh .pptx
Palestine last event orientationfvgnh .pptx
 
Mattingly "AI & Prompt Design: Limitations and Solutions with LLMs"
Mattingly "AI & Prompt Design: Limitations and Solutions with LLMs"Mattingly "AI & Prompt Design: Limitations and Solutions with LLMs"
Mattingly "AI & Prompt Design: Limitations and Solutions with LLMs"
 
Gyanartha SciBizTech Quiz slideshare.pptx
Gyanartha SciBizTech Quiz slideshare.pptxGyanartha SciBizTech Quiz slideshare.pptx
Gyanartha SciBizTech Quiz slideshare.pptx
 
Solid waste management & Types of Basic civil Engineering notes by DJ Sir.pptx
Solid waste management & Types of Basic civil Engineering notes by DJ Sir.pptxSolid waste management & Types of Basic civil Engineering notes by DJ Sir.pptx
Solid waste management & Types of Basic civil Engineering notes by DJ Sir.pptx
 
aaaaaaaaaaaaaaaaaaaaaaaaaaaaaaaaaaaaaaaaaaaaaaaaaaaaaaa
aaaaaaaaaaaaaaaaaaaaaaaaaaaaaaaaaaaaaaaaaaaaaaaaaaaaaaaaaaaaaaaaaaaaaaaaaaaaaaaaaaaaaaaaaaaaaaaaaaaaaaaaaaaaaa
aaaaaaaaaaaaaaaaaaaaaaaaaaaaaaaaaaaaaaaaaaaaaaaaaaaaaaa
 
Jose-Rizal-and-Philippine-Nationalism-National-Symbol-2.pptx
Jose-Rizal-and-Philippine-Nationalism-National-Symbol-2.pptxJose-Rizal-and-Philippine-Nationalism-National-Symbol-2.pptx
Jose-Rizal-and-Philippine-Nationalism-National-Symbol-2.pptx
 
MARUTI SUZUKI- A Successful Joint Venture in India.pptx
MARUTI SUZUKI- A Successful Joint Venture in India.pptxMARUTI SUZUKI- A Successful Joint Venture in India.pptx
MARUTI SUZUKI- A Successful Joint Venture in India.pptx
 
UNIT – IV_PCI Complaints: Complaints and evaluation of complaints, Handling o...
UNIT – IV_PCI Complaints: Complaints and evaluation of complaints, Handling o...UNIT – IV_PCI Complaints: Complaints and evaluation of complaints, Handling o...
UNIT – IV_PCI Complaints: Complaints and evaluation of complaints, Handling o...
 

Presentationofdatamod6b

  • 1. Presentation of Data (Graphical Method) Module 6b Basic Statistics SRSTHS Ms. Pegollo
  • 2. Presentation of Data Objectives: At the end of the lesson, the students should be able to: 1. Identify specific data appropriate to use for graphs 2. Create graphs 3. Read and interpret graphs MCPegollo/Basic Statistics/SRSTHS
  • 3. Presentation of Data Textual Tabular Graphical Method Method Method • Rearrangem • Frequency • Bar Chart ent from distribution • Histogram lowest to table (FDT) • Frequency highest • Relative Polygon • Stem-and- FDT • Pie Chart leaf plot • Cumulative • Less than, FDT greater than • Contingency Ogive Table MCPegollo/Basic Statistics/SRSTHS
  • 4. Graphical Method Graphs add beauty and color to one’s presentation, moreover, it helps facilitate comparison and interpretation without going through the numerical data. MCPegollo/Basic Statistics/SRSTHS
  • 5. In the succeeding graphs, we shall be using the data in the following table Table 6.1 Grouped Frequency Distribution for the Entrance Examination of 60 Students Greater Less than Class Class Class Relative than Frequency Cumulative Interval Mark Boundary Frequency Cumulative (f) Frequency (C I) (x) (cb) (rf) Frequency (< cf) (> cf) 18 - 23 20.5 18 - 24 6 10.00 6 60 24 - 29 26.5 24 - 30 11 18.33 17 54 30 - 35 32.5 30 - 36 17 28.33 34 43 36 - 41 38.5 36 - 42 14 23.33 48 26 42 - 47 44.5 42 - 48 8 13.33 56 12 48 - 53 50.5 48 - 54 3 5.00 59 4 54 - 59 56.5 54 - 60 1 1.67 60 1 N= 60 100.00 MCPegollo/Basic Statistics/SRSTHS
  • 6. Bar Chart Figure 1 The Bar Chart of the Grouped Frequency Distribution for the Entrance Examination Scores of 60 Students 18 16 14 12 10 8 6 4 2 0 18-23 24-29 30-35 36-41 42-47 48-53 54-59 A bar chart is a graph presented by either vertical or horizontal rectangles whose bases represent the class intervals and whose heights represent the frequencies MCPegollo/Basic Statistics/SRSTHS
  • 7. Bar Chart The Bar Chart of the Grouped Frequency Distribution for the Entrance Examination Scores of 60 Students 54-59 1 48-53 3 42-47 8 36-41 14 30-35 17 24-29 11 18-23 6 0 2 4 6 8 10 12 14 16 18 MCPegollo/Basic Statistics/SRSTHS
  • 8. Histogram 18 16 14 12 Frequency 10 8 6 4 2 0 20.5 26.5 32.5 38.5 44.5 50.5 56.5 Class Mark Figure 2 The Histogram of the Grouped Frequency Distribution for the Entrance Examination Scores of 60 Students A histogram is a graph represented by vertical and horizontal rectangles whose bases are the class marks and whose heights are the frequencies. Note: There are no gaps between bars. MCPegollo/Basic Statistics/SRSTHS
  • 9. Frequency Polygon 18 16 14 12 10 8 6 4 2 0 14.5 20.5 26.5 32.5 38.5 44.5 50.5 56.5 62.5 Figure 4 The Frequency Polygon of the Grouped Frequency Distribution for the Examination Scores of 60 Students A frequency polygon is a line graph whose bases are the class marks and whose heights are the frequencies MCPegollo/Basic Statistics/SRSTHS
  • 10. Pie Chart 54-59 2% 48-53 18-23 5% 10% 42-47 14% 24-29 18% 36-41 23% 30-35 28% Figure 5 The Pie Chart of the Grouped Frequency Distribution for the Entrance Examination Scores of 60 students A pie chart is a circle graph showing the proportion of each class through either the relative or percentage frequency MCPegollo/Basic Statistics/SRSTHS
  • 11. Ogive 70 60 50 40 30 20 10 0 17.5 23.5 29.5 35.5 41.5 47.5 53.5 Figure 6 The Less than and Greater than ogives for the Entrance Examination Scores of 60 students An ogive is a line graph where the bases are the class boundaries and the heights are the <cf for the less than ogive and >cf for the greater than ogive. MCPegollo/Basic Statistics/SRSTHS
  • 12. Quiz Which parts of the FDT are used in constructing the following: 1. Bar Chart 2. Histogram 3. Frequency Polygon 4. Pie Chart 5. Ogive MCPegollo/Basic Statistics/SRSTHS
  • 13. Activity 1 (Think-Pair-Share ) Insurance companies conduct continuous research on ages at death and causes of death. The following table shows the ages at death and the corresponding frequencies. Construct the following graphs: Age at Freq. Death 1. Bar chart 16 - 25 22 2. Histogram 26 - 35 10 36 – 6 3. Frequency Polygon 45 4. Pie Chart 46 – 2 55 5. Ogives 56 – 4 65 MCPegollo/Basic Statistics/SRSTHS
  • 14. Due on Feb. 3 Activity 2 (Pair Project) Use short bond papers Mention sampling technique and data gathering method used. Gather data(interval or ratio level only) from 50 members in your batch. Using Microsoft Excel, construct a/an 1. Complete FDT 2. Bar chart 3. Histogram 4. Frequency Polygon 5. Pie Chart 6. Ogive MCPegollo/Basic Statistics/SRSTHS