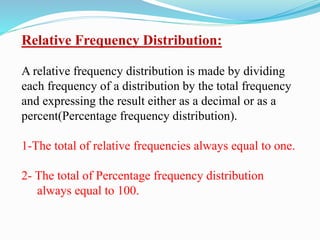
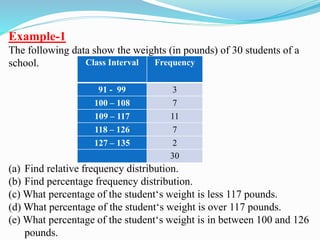
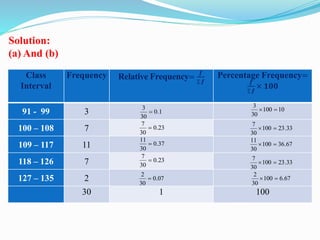
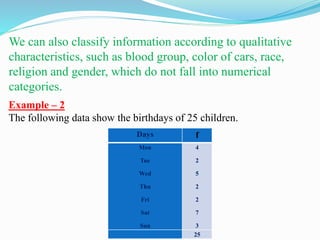
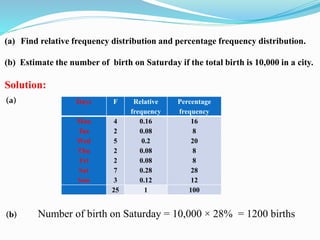
NADEEM UDDIN
ASSOCIATE PROFESSOR
OF STATISTICS
https://www.slideshare.net/NadeemUddin17
https://nadeemstats.wordpress.com/listofbooks/
Relative Frequency Distribution:
A relative frequency distribution is made by dividing
each frequency of a distribution by the total frequency
and expressing the result either as a decimal or as a
percent(Percentage frequency distribution).
1-The total of relative frequencies always equal to one.
2- The total of Percentage frequency distribution
always equal to 100.
Example-1
The following data show the weights (in pounds) of 30 students of a
school.
(a) Find relative frequency distribution.
(b) Find percentage frequency distribution.
(c) What percentage of the student‘s weight is less 117 pounds.
(d) What percentage of the student‘s weight is over 117 pounds.
(e) What percentage of the student‘s weight is in between 100 and 126
pounds.
Class Interval Frequency
91 - 99 3
100 – 108 7
109 – 117 11
118 – 126 7
127 – 135 2
30
Class
Interval
Frequency Relative Frequency=
𝒇
𝒇
Percentage Frequency=
𝒇
𝒇
× 𝟏𝟎𝟎
91 - 99 3
100 – 108 7
109 – 117 11
118 – 126 7
127 – 135 2
30 1 100
1.0
30
3
 10100
30
3

23.0
30
7

33.23100
30
7

37.0
30
11
 67.36100
30
11

23.0
30
7

33.23100
30
7

07.0
30
2
 67.6100
30
2

Solution:
(a) And (b)
(c) From column four
Percentage of the student's weight is less 117 pounds = 10% + 23.33% + 36.67%
Percentage of the student's weight is less 117 pounds = 70%
(d) From column four
Percentage of the student's weight is over 117 pounds = 23.33% + 6.67%
Percentage of the student's weight is over 117 pounds = 30%
(e) From column four
Percentage of the student's weight is in between 100 and 126 pounds =
23.33% + 36.67% + 23.33%
Percentage of the student's weight is in between 100 and 126 pounds = 83.33%
We can also classify information according to qualitative
characteristics, such as blood group, color of cars, race,
religion and gender, which do not fall into numerical
categories.
Example – 2
The following data show the birthdays of 25 children.
Days f
Mon
Tue
Wed
Thu
Fri
Sat
Sun
4
2
5
2
2
7
3
25
(a) Find relative frequency distribution and percentage frequency distribution.
(b) Estimate the number of birth on Saturday if the total birth is 10,000 in a city.
Solution:
(a) Days F Relative
frequency
Percentage
frequency
Mon
Tue
Wed
Thu
Fri
Sat
Sun
4
2
5
2
2
7
3
0.16
0.08
0.2
0.08
0.08
0.28
0.12
16
8
20
8
8
28
12
25 1 100
(b) Number of birth on Saturday = 10,000 × 28% = 1200 births

Relative frequency distribution

  • 1.
    NADEEM UDDIN ASSOCIATE PROFESSOR OFSTATISTICS https://www.slideshare.net/NadeemUddin17 https://nadeemstats.wordpress.com/listofbooks/
  • 2.
    Relative Frequency Distribution: Arelative frequency distribution is made by dividing each frequency of a distribution by the total frequency and expressing the result either as a decimal or as a percent(Percentage frequency distribution). 1-The total of relative frequencies always equal to one. 2- The total of Percentage frequency distribution always equal to 100.
  • 3.
    Example-1 The following datashow the weights (in pounds) of 30 students of a school. (a) Find relative frequency distribution. (b) Find percentage frequency distribution. (c) What percentage of the student‘s weight is less 117 pounds. (d) What percentage of the student‘s weight is over 117 pounds. (e) What percentage of the student‘s weight is in between 100 and 126 pounds. Class Interval Frequency 91 - 99 3 100 – 108 7 109 – 117 11 118 – 126 7 127 – 135 2 30
  • 4.
    Class Interval Frequency Relative Frequency= 𝒇 𝒇 PercentageFrequency= 𝒇 𝒇 × 𝟏𝟎𝟎 91 - 99 3 100 – 108 7 109 – 117 11 118 – 126 7 127 – 135 2 30 1 100 1.0 30 3  10100 30 3  23.0 30 7  33.23100 30 7  37.0 30 11  67.36100 30 11  23.0 30 7  33.23100 30 7  07.0 30 2  67.6100 30 2  Solution: (a) And (b)
  • 5.
    (c) From columnfour Percentage of the student's weight is less 117 pounds = 10% + 23.33% + 36.67% Percentage of the student's weight is less 117 pounds = 70% (d) From column four Percentage of the student's weight is over 117 pounds = 23.33% + 6.67% Percentage of the student's weight is over 117 pounds = 30%
  • 6.
    (e) From columnfour Percentage of the student's weight is in between 100 and 126 pounds = 23.33% + 36.67% + 23.33% Percentage of the student's weight is in between 100 and 126 pounds = 83.33%
  • 7.
    We can alsoclassify information according to qualitative characteristics, such as blood group, color of cars, race, religion and gender, which do not fall into numerical categories. Example – 2 The following data show the birthdays of 25 children. Days f Mon Tue Wed Thu Fri Sat Sun 4 2 5 2 2 7 3 25
  • 8.
    (a) Find relativefrequency distribution and percentage frequency distribution. (b) Estimate the number of birth on Saturday if the total birth is 10,000 in a city. Solution: (a) Days F Relative frequency Percentage frequency Mon Tue Wed Thu Fri Sat Sun 4 2 5 2 2 7 3 0.16 0.08 0.2 0.08 0.08 0.28 0.12 16 8 20 8 8 28 12 25 1 100 (b) Number of birth on Saturday = 10,000 × 28% = 1200 births