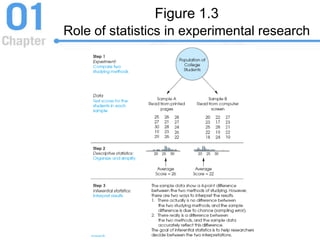
Chapter 1:
Introduction to Statistics
PowerPoint Lecture Slides
Essentials of Statistics for the
Behavioral Sciences
Eighth Edition
by Frederick J Gravetter and Larry B. Wallnau
Learning Outcomes
• Know key statistical terms1
• Know key measurement terms2
• Know key research terms3
• Know the place of statistics in science4
• Understand summation notation5
• Statistics requires basic math skills
• Inadequate basic math skills puts you at
risk in this course
• Appendix A Math Skills Assessment helps
you determine if you need a skills review
• Appendix A Math Skills Review provides a
quick refresher course on those areas.
• The final Math Skills Assessment identifies
your basic math skills competence
Math Skills Assessment
1.1 Statistics, Science and
Observations
• “Statistics” means “statistical procedures”
• Uses of Statistics
– Organize and summarize information
– Determine exactly what conclusions are
justified based on the results that were
obtained
• Goals of statistical procedures
– Accurate and meaningful interpretation
– Provide standardized evaluation procedures
1.2 Populations and Samples
• Population
– The set of all the individuals of interest in a
particular study
– Vary in size; often quite large
• Sample
– A set of individuals selected from a population
– Usually intended to represent the population
in a research study
Figure 1.1
Relationship between population and sample
Variables and Data
• Variable
– Characteristic or condition that changes or has
different values for different individuals
• Data (plural)
– Measurements or observations of a variable
• Data set
– A collection of measurements or observations
• A datum (singular)
– A single measurement or observation
– Commonly called a score or raw score
Parameters and Statistics
• Parameter
– A value, usually a
numerical value, that
describes a population
– Derived from
measurements of
the individuals in
the population
• Statistic
– A value, usually a
numerical value, that
describes a sample
– Derived from
measurements of
the individuals in
the sample
Descriptive & Inferential Statistics
• Descriptive statistics
– Summarize data
– Organize data
– Simplify data
• Familiar examples
– Tables
– Graphs
– Averages
• Inferential statistics
– Study samples to make
generalizations about
the population
– Interpret experimental
data
• Common terminology
– “Margin of error”
– “Statistically significant”
Sampling Error
• Sample is never identical to population
• Sampling Error
– The discrepancy, or amount of error, that
exists between a sample statistic and the
corresponding population parameter
• Example: Margin of Error in Polls
– “This poll was taken from a sample of registered
voters and has a margin of error of plus-or-minus 4
percentage points” (Box 1.1)
Figure 1.2
A demonstration of sampling error
Figure 1.3
Role of statistics in experimental research
Learning Check
• A researcher is interested in the effect of
amount of sleep on high school students’ exam
scores. A group of 75 high school boys agree
to participate in the study. The boys are…
• A statisticA
• A variableB
• A parameterC
• A sampleD
Learning Check - Answer
• A researcher is interested in the effect of
amount of sleep on high school students’ exam
scores. A group of 75 high school boys agree
to participate in the study. The boys are…
• A statisticA
• A variableB
• A parameterC
• A sampleD
Learning Check
• Decide if each of the following statements
is True or False.
• Most research studies use data
from samplesT/F
• When sample differs from the
population there is a systematic
difference between groups
T/F
Learning Check - Answer
• Samples used because it is not
feasible or possible to measure
all individuals in the population
True
• Sampling error due to random
influences may produce
unsystematic group differences
False
1.3 Data Structures, Research
Methods, and Statistics
• Individual Variables
– A variable is observed
– “Statistics” describe the observed variable
– Category and/or numerical variables
• Relationships between variables
– Two variables observed and measured
– One of two possible data structures used to
determine what type of relationship exists
Relationships Between Variables
• Data Structure I: The Correlational Method
– One group of participants
– Measurement of two variables for each
participant
– Goal is to describe type and magnitude of the
relationship
– Patterns in the data reveal relationships
– Non-experimental method of study
Figure 1.4
Data structures for studies evaluating the
relationship between variables
Correlational Method Limitations
• Can demonstrate the existence of a
relationship
• Does not provide an explanation for the
relationship
• Most importantly, does not demonstrate a
cause-and-effect relationship between the
two variables
Relationships Between Variables
• Data Structure II: Comparing two (or more)
groups of Scores
– One variable defines the groups
– Scores are measured on second variable
– Both experimental and non-experimental
studies use this structure
Figure 1.5
Data structure for studies comparing groups
Experimental Method
• Goal of Experimental Method
– To demonstrate a cause-and-effect
relationship
• Manipulation
– The level of one variable is determined by the
experimenter
• Control rules out influence of other
variables
– Participant variables
– Environmental variables
Figure 1.6
The structure of an experiment
Independent/Dependent Variables
• Independent Variable is the variable
manipulated by the researcher
– Independent because no other variable in the
study influences its value
• Dependent Variable is the one observed
to assess the effect of treatment
– Dependent because its value is thought to
depend on the value of the independent
variable
Experimental Method: Control
• Methods of control
– Random assignment of subjects
– Matching of subjects
– Holding level of some potentially influential variables
constant
• Control condition
– Individuals do not receive the experimental treatment.
– They either receive no treatment or they receive a neutral,
placebo treatment
– Purpose: to provide a baseline for comparison with the
experimental condition
• Experimental condition
– Individuals do receive the experimental treatment
Non-experimental Methods
• Non-equivalent Groups
– Researcher compares groups
– Researcher cannot control who goes into which
group
• Pre-test / Post-test
– Individuals measured at two points in time
– Researcher cannot control influence of the
passage of time
• Independent variable is quasi-independent
Figure 1.7
Two examples of non-experimental studies
Insert NEW Figure 1.7
Learning Check
• Researchers observed that students exam
scores were higher the more sleep they
had the night before. This study is …
• DescriptiveA
• Experimental comparison of groupsB
• Non-experimental group comparisonC
• CorrelationalD
Learning Check - Answer
• Researchers observed that students exam
scores were higher the more sleep they
had the night before. This study is …
• DescriptiveA
• Experimental comparison of groupsB
• Non-experimental group comparisonC
• CorrelationalD
Learning Check
• Decide if each of the following statements
is True or False.
• All research methods have an
independent variableT/F
• All research methods can show
cause-and-effect relationshipsT/F
Learning Check - Answer
• Correlational methods do not
need an independent variableFalse
• Only experiments control the
influence of participants and
environmental variables
False
1.4 Variables and Measurement
• Scores are obtained by observing and
measuring variables that scientists use to
help define and explain external behaviors
• The process of measurement consists of
applying carefully defined measurement
procedures for each variable
Constructs & Operational Definitions
• Constructs
– Internal attributes
or characteristics
that cannot be
directly observed
– Useful for
describing and
explaining behavior
• Operational Definition
– Identifies the set of
operations required to
measure an external
(observable) behavior
– Uses the resulting
measurements as both
a definition and a
measurement of a
hypothetical construct
Discrete and Continuous
Variables
• Discrete variable
– Has separate, indivisible categories
– No values can exist between two neighboring
categories
• Continuous variable
– Have an infinite number of possible values
between any two observed values
– Every interval is divisible into an infinite
number of equal parts
Figure 1.8
Example: Continuous Measurement
Real Limits of Continuous
Variables
• Real Limits are the boundaries of each
interval representing scores measured on
a continuous number line
– The real limit separating two adjacent scores
is exactly halfway between the two scores
– Each score has two real limits
• The upper real limit marks the top of the
interval
• The lower real limit marks the bottom of the
interval
Scales of Measurement
• Measurement assigns individuals or events to
categories
– The categories can simply be names such as
male/female or employed/unemployed
– They can be numerical values such as 68 inches
or 175 pounds
• The complete set of categories makes up a
scale of measurement
• Relationships between the categories determine
different types of scales
Scales of Measurement
Scale Characteristics Examples
Nominal •Label and categorize
•No quantitative distinctions
•Gender
•Diagnosis
•Experimental or Control
Ordinal •Categorizes observations
•Categories organized by
size or magnitude
•Rank in class
•Clothing sizes (S,M,L,XL)
•Olympic medals
Interval •Ordered categories
•Interval between categories
of equal size
•Arbitrary or absent zero
point
•Temperature
•IQ
•Golf scores (above/below
par)
Ratio •Ordered categories
•Equal interval between
categories
•Absolute zero point
•Number of correct answers
•Time to complete task
•Gain in height since last
year
Learning Check
• A study assesses the optimal size (number
of other members) for study groups. The
variable “Size of group” is …
• Discrete and intervalA
• Continuous and ordinalB
• Discrete and ratioC
• Continuous and intervalD
Learning Check - Answer
• A study assesses the optimal size (number
of other members) for study groups. The
variable “Size of group” is …
• Discrete and intervalA
• Continuous and ordinalB
• Discrete and ratioC
• Continuous and intervalD
Learning Check
• Decide if each of the following statements
is True or False.
• Variables that cannot be
measured directly cannot be
studied scientifically
T/F
• Research measurements are
made using specific procedures
that define constructs
T/F
Learning Check - Answer
• Constructs (internal states) can
only be observed indirectly, but
can be operationally measured
False
• Operational definitions assure
consistent measurement and
provide construct definitions
True
1.5 Statistical Notation
• Statistics uses operations and notation
you have already learned
– Appendix A has a Mathematical Review
• Statistics also uses some specific notation
– Scores are referred to as X (and Y)
– N is the number of scores in a population
– n is the number of scores in a sample
Summation Notation
• Many statistical procedures sum (add up) a
set of scores
• The summation sign Σ stands for summation
– The Σ is followed by a symbol or equation that
defines what is to be summed
– Summation is done after operations in
parentheses, squaring, and multiplication or
division.
– Summation is done before other addition or
subtraction
Learning Check
• instructs you to …472
X
Learning Check - Answer
• instructs you to …472
X
Learning Check
• Decide if each of the following equations
is True or False.
 22
  XX
     2
  XXX
Learning Check - Answer
• When the operations are
performed in a different order,
the results will be different
False
• This is the definition of (ΣX)2True
Any
Questions?
Concepts?
Equations?

Introduction to Statistics

  • 1.
    Chapter 1: Introduction toStatistics PowerPoint Lecture Slides Essentials of Statistics for the Behavioral Sciences Eighth Edition by Frederick J Gravetter and Larry B. Wallnau
  • 2.
    Learning Outcomes • Knowkey statistical terms1 • Know key measurement terms2 • Know key research terms3 • Know the place of statistics in science4 • Understand summation notation5
  • 3.
    • Statistics requiresbasic math skills • Inadequate basic math skills puts you at risk in this course • Appendix A Math Skills Assessment helps you determine if you need a skills review • Appendix A Math Skills Review provides a quick refresher course on those areas. • The final Math Skills Assessment identifies your basic math skills competence Math Skills Assessment
  • 4.
    1.1 Statistics, Scienceand Observations • “Statistics” means “statistical procedures” • Uses of Statistics – Organize and summarize information – Determine exactly what conclusions are justified based on the results that were obtained • Goals of statistical procedures – Accurate and meaningful interpretation – Provide standardized evaluation procedures
  • 5.
    1.2 Populations andSamples • Population – The set of all the individuals of interest in a particular study – Vary in size; often quite large • Sample – A set of individuals selected from a population – Usually intended to represent the population in a research study
  • 6.
    Figure 1.1 Relationship betweenpopulation and sample
  • 7.
    Variables and Data •Variable – Characteristic or condition that changes or has different values for different individuals • Data (plural) – Measurements or observations of a variable • Data set – A collection of measurements or observations • A datum (singular) – A single measurement or observation – Commonly called a score or raw score
  • 8.
    Parameters and Statistics •Parameter – A value, usually a numerical value, that describes a population – Derived from measurements of the individuals in the population • Statistic – A value, usually a numerical value, that describes a sample – Derived from measurements of the individuals in the sample
  • 9.
    Descriptive & InferentialStatistics • Descriptive statistics – Summarize data – Organize data – Simplify data • Familiar examples – Tables – Graphs – Averages • Inferential statistics – Study samples to make generalizations about the population – Interpret experimental data • Common terminology – “Margin of error” – “Statistically significant”
  • 10.
    Sampling Error • Sampleis never identical to population • Sampling Error – The discrepancy, or amount of error, that exists between a sample statistic and the corresponding population parameter • Example: Margin of Error in Polls – “This poll was taken from a sample of registered voters and has a margin of error of plus-or-minus 4 percentage points” (Box 1.1)
  • 11.
    Figure 1.2 A demonstrationof sampling error
  • 12.
    Figure 1.3 Role ofstatistics in experimental research
  • 13.
    Learning Check • Aresearcher is interested in the effect of amount of sleep on high school students’ exam scores. A group of 75 high school boys agree to participate in the study. The boys are… • A statisticA • A variableB • A parameterC • A sampleD
  • 14.
    Learning Check -Answer • A researcher is interested in the effect of amount of sleep on high school students’ exam scores. A group of 75 high school boys agree to participate in the study. The boys are… • A statisticA • A variableB • A parameterC • A sampleD
  • 15.
    Learning Check • Decideif each of the following statements is True or False. • Most research studies use data from samplesT/F • When sample differs from the population there is a systematic difference between groups T/F
  • 16.
    Learning Check -Answer • Samples used because it is not feasible or possible to measure all individuals in the population True • Sampling error due to random influences may produce unsystematic group differences False
  • 17.
    1.3 Data Structures,Research Methods, and Statistics • Individual Variables – A variable is observed – “Statistics” describe the observed variable – Category and/or numerical variables • Relationships between variables – Two variables observed and measured – One of two possible data structures used to determine what type of relationship exists
  • 18.
    Relationships Between Variables •Data Structure I: The Correlational Method – One group of participants – Measurement of two variables for each participant – Goal is to describe type and magnitude of the relationship – Patterns in the data reveal relationships – Non-experimental method of study
  • 19.
    Figure 1.4 Data structuresfor studies evaluating the relationship between variables
  • 20.
    Correlational Method Limitations •Can demonstrate the existence of a relationship • Does not provide an explanation for the relationship • Most importantly, does not demonstrate a cause-and-effect relationship between the two variables
  • 21.
    Relationships Between Variables •Data Structure II: Comparing two (or more) groups of Scores – One variable defines the groups – Scores are measured on second variable – Both experimental and non-experimental studies use this structure
  • 22.
    Figure 1.5 Data structurefor studies comparing groups
  • 23.
    Experimental Method • Goalof Experimental Method – To demonstrate a cause-and-effect relationship • Manipulation – The level of one variable is determined by the experimenter • Control rules out influence of other variables – Participant variables – Environmental variables
  • 24.
    Figure 1.6 The structureof an experiment
  • 25.
    Independent/Dependent Variables • IndependentVariable is the variable manipulated by the researcher – Independent because no other variable in the study influences its value • Dependent Variable is the one observed to assess the effect of treatment – Dependent because its value is thought to depend on the value of the independent variable
  • 26.
    Experimental Method: Control •Methods of control – Random assignment of subjects – Matching of subjects – Holding level of some potentially influential variables constant • Control condition – Individuals do not receive the experimental treatment. – They either receive no treatment or they receive a neutral, placebo treatment – Purpose: to provide a baseline for comparison with the experimental condition • Experimental condition – Individuals do receive the experimental treatment
  • 27.
    Non-experimental Methods • Non-equivalentGroups – Researcher compares groups – Researcher cannot control who goes into which group • Pre-test / Post-test – Individuals measured at two points in time – Researcher cannot control influence of the passage of time • Independent variable is quasi-independent
  • 28.
    Figure 1.7 Two examplesof non-experimental studies Insert NEW Figure 1.7
  • 29.
    Learning Check • Researchersobserved that students exam scores were higher the more sleep they had the night before. This study is … • DescriptiveA • Experimental comparison of groupsB • Non-experimental group comparisonC • CorrelationalD
  • 30.
    Learning Check -Answer • Researchers observed that students exam scores were higher the more sleep they had the night before. This study is … • DescriptiveA • Experimental comparison of groupsB • Non-experimental group comparisonC • CorrelationalD
  • 31.
    Learning Check • Decideif each of the following statements is True or False. • All research methods have an independent variableT/F • All research methods can show cause-and-effect relationshipsT/F
  • 32.
    Learning Check -Answer • Correlational methods do not need an independent variableFalse • Only experiments control the influence of participants and environmental variables False
  • 33.
    1.4 Variables andMeasurement • Scores are obtained by observing and measuring variables that scientists use to help define and explain external behaviors • The process of measurement consists of applying carefully defined measurement procedures for each variable
  • 34.
    Constructs & OperationalDefinitions • Constructs – Internal attributes or characteristics that cannot be directly observed – Useful for describing and explaining behavior • Operational Definition – Identifies the set of operations required to measure an external (observable) behavior – Uses the resulting measurements as both a definition and a measurement of a hypothetical construct
  • 35.
    Discrete and Continuous Variables •Discrete variable – Has separate, indivisible categories – No values can exist between two neighboring categories • Continuous variable – Have an infinite number of possible values between any two observed values – Every interval is divisible into an infinite number of equal parts
  • 36.
  • 37.
    Real Limits ofContinuous Variables • Real Limits are the boundaries of each interval representing scores measured on a continuous number line – The real limit separating two adjacent scores is exactly halfway between the two scores – Each score has two real limits • The upper real limit marks the top of the interval • The lower real limit marks the bottom of the interval
  • 38.
    Scales of Measurement •Measurement assigns individuals or events to categories – The categories can simply be names such as male/female or employed/unemployed – They can be numerical values such as 68 inches or 175 pounds • The complete set of categories makes up a scale of measurement • Relationships between the categories determine different types of scales
  • 39.
    Scales of Measurement ScaleCharacteristics Examples Nominal •Label and categorize •No quantitative distinctions •Gender •Diagnosis •Experimental or Control Ordinal •Categorizes observations •Categories organized by size or magnitude •Rank in class •Clothing sizes (S,M,L,XL) •Olympic medals Interval •Ordered categories •Interval between categories of equal size •Arbitrary or absent zero point •Temperature •IQ •Golf scores (above/below par) Ratio •Ordered categories •Equal interval between categories •Absolute zero point •Number of correct answers •Time to complete task •Gain in height since last year
  • 40.
    Learning Check • Astudy assesses the optimal size (number of other members) for study groups. The variable “Size of group” is … • Discrete and intervalA • Continuous and ordinalB • Discrete and ratioC • Continuous and intervalD
  • 41.
    Learning Check -Answer • A study assesses the optimal size (number of other members) for study groups. The variable “Size of group” is … • Discrete and intervalA • Continuous and ordinalB • Discrete and ratioC • Continuous and intervalD
  • 42.
    Learning Check • Decideif each of the following statements is True or False. • Variables that cannot be measured directly cannot be studied scientifically T/F • Research measurements are made using specific procedures that define constructs T/F
  • 43.
    Learning Check -Answer • Constructs (internal states) can only be observed indirectly, but can be operationally measured False • Operational definitions assure consistent measurement and provide construct definitions True
  • 44.
    1.5 Statistical Notation •Statistics uses operations and notation you have already learned – Appendix A has a Mathematical Review • Statistics also uses some specific notation – Scores are referred to as X (and Y) – N is the number of scores in a population – n is the number of scores in a sample
  • 45.
    Summation Notation • Manystatistical procedures sum (add up) a set of scores • The summation sign Σ stands for summation – The Σ is followed by a symbol or equation that defines what is to be summed – Summation is done after operations in parentheses, squaring, and multiplication or division. – Summation is done before other addition or subtraction
  • 46.
    Learning Check • instructsyou to …472 X
  • 47.
    Learning Check -Answer • instructs you to …472 X
  • 48.
    Learning Check • Decideif each of the following equations is True or False.  22   XX      2   XXX
  • 49.
    Learning Check -Answer • When the operations are performed in a different order, the results will be different False • This is the definition of (ΣX)2True
  • 50.

Editor's Notes

  • #4 Some instructors may prefer to put this slide at the end of the lecture.
  • #5 Instructors may wish to note that there are many different meanings of the term “statistics” so students should be certain they understand which meaning is being referenced in this course.
  • #6 Population vs. sample is a critical distinction that will be the basis for understanding many others aspects of applying statistical procedures in this course. Instructors may wish to emphasize some of the subtle clues the text authors used to remind tem of the differences, e.g., greek letters for population parameters, italicized sample statistic symbols, and N vs. n.
  • #7 FIGURE 1.1 The relationship between a population and a sample.
  • #11 Students sometimes associate “error” with being wrong. Although that is not a completely incorrect understanding, it tends to prevent them from being able to accept that a quantifiable degree of imprecision is much better than a random guess.
  • #12 FIGURE 1.2 A demonstration of sampling error. Two samples are selected from the same population. Notice that the sample statistics are different from one sample to another, and all of the sample statistics are different from the corresponding population parameters. The natural differences that exist, by chance, between a sample statistic and a population parameter are called sampling error.
  • #13 FIGURE 1.3 The role of statistics in research.
  • #20 Figure 1.4 One of two data structures for studies evaluating the relationship between variables. Note that there are two separate measurements for each individual (wake-up time and academic performance). The same scores are shown in table (a) and graph (b).
  • #22 Instructors may wish to introduce the term “quasi-experimental” in this section.
  • #23 FIGURE 1.5 The second data structure for studies evaluating the relationship between variables. Note that one variable is used to define the groups and the second variable is measured to obtain scores within each group.
  • #25 FIGURE 1.6 The structure of an experiment. Participants are randomly assigned to one of two treatment condition: counting money or counting blank pieces of paper. Later, each participant is tested by placing one hand in a bowl of hot (122° F) water and rating the level of pain. A difference between the ratings for the two groups is attributed to the treatment (paper versus money).
  • #29 FIGURE 1.7 Two examples of nonexperimental studies that involve comparing two groups of scores. In (a), a participant variable (gender) is used to create groups, and then the dependent variable (verbal score) is measured in each group. In (b), time is the variable used to define the two groups, and the dependent variable (depression) is measured at each of the two times.
  • #35 Instructors may with to flag operational definition as a principle so important to behavioral science that it will re-appear in other courses such as research methods and experimental design.
  • #36 Discussing government statistics which report a fractional number of children in an “average” family is a humorous yet useful way of illustrating how discrete variables are fundamentally different from continuous variables.
  • #37 FIGURE 1.8 When measuring weight to the nearest whole pound, 149.6 and 150.3 are assigned the value 150 (top). Any value in the interval between 149.5 and 150.5 is given the value of 150.
  • #38 Some students struggle with real limits. Instructors may wish to insert an example with the measurement scale in 10ths (or 100ths) to help reinforce the importance of ½ score unit above and below the scale value of the measurement unit.
  • #40 This material is arguably in the “Top Ten Most Important” concepts the students will encounter in the study of statistics and may merit identifying it as such.
  • #45 Students’ eyes often glaze over in this section. Remind them how difficult it is to make yourself understood if you do not speak the language in use by everyone else, and point out that they will experience the same difficulty and frustration in this course if they do not understand the “language” and symbols of statistics.