Download as PDF, PPTX

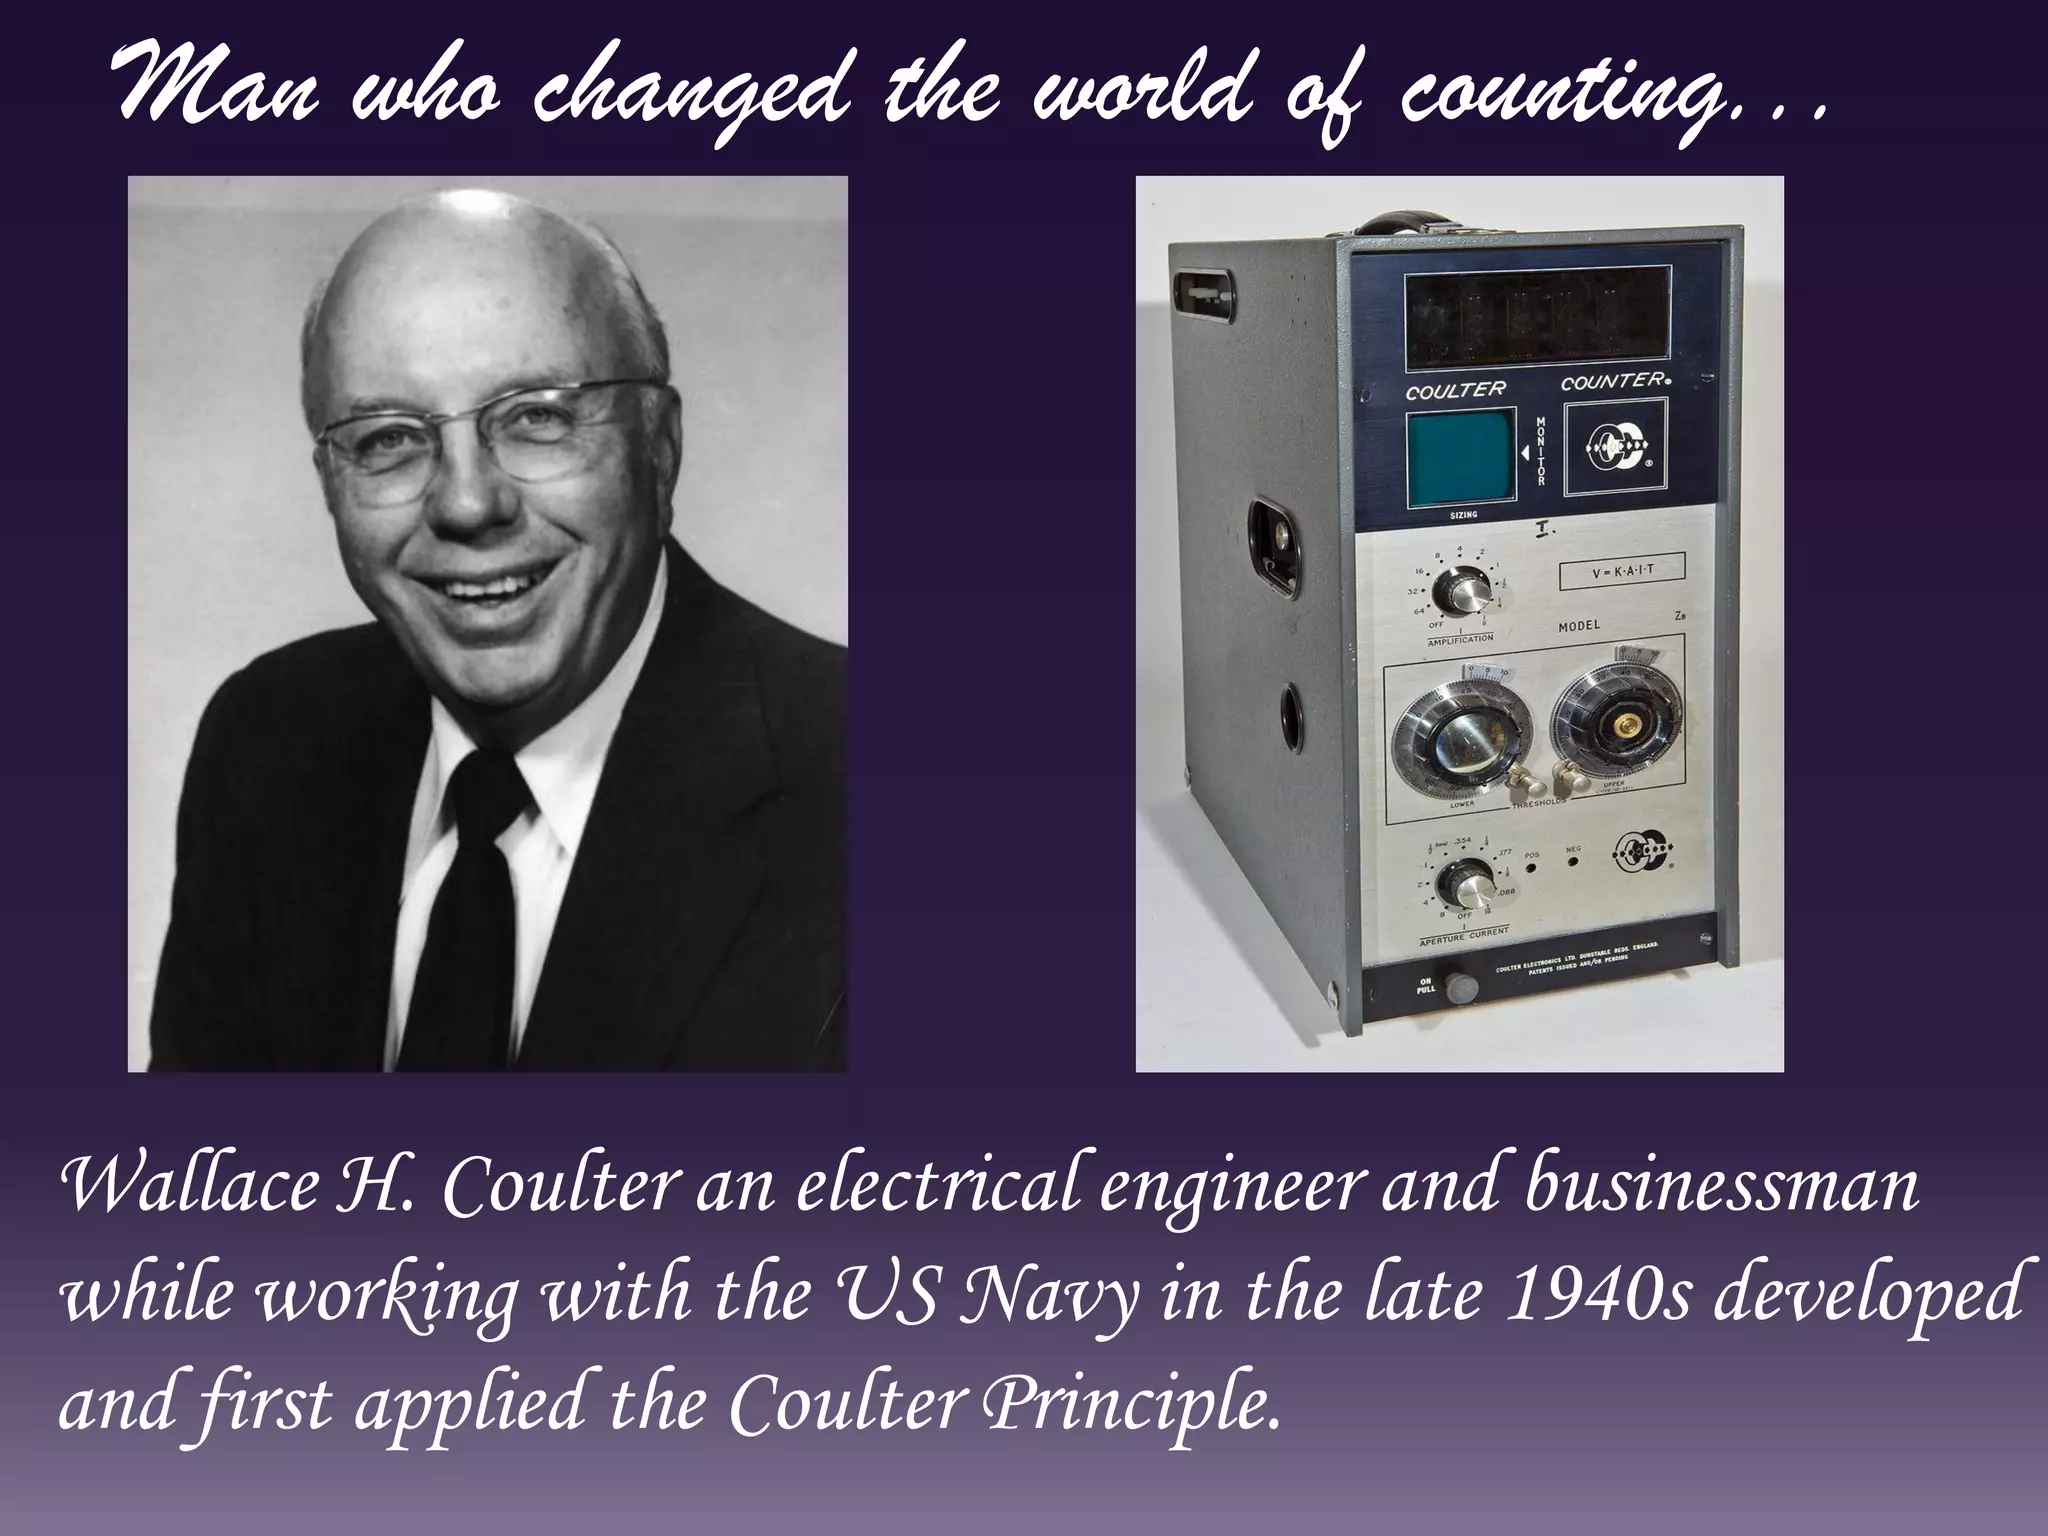
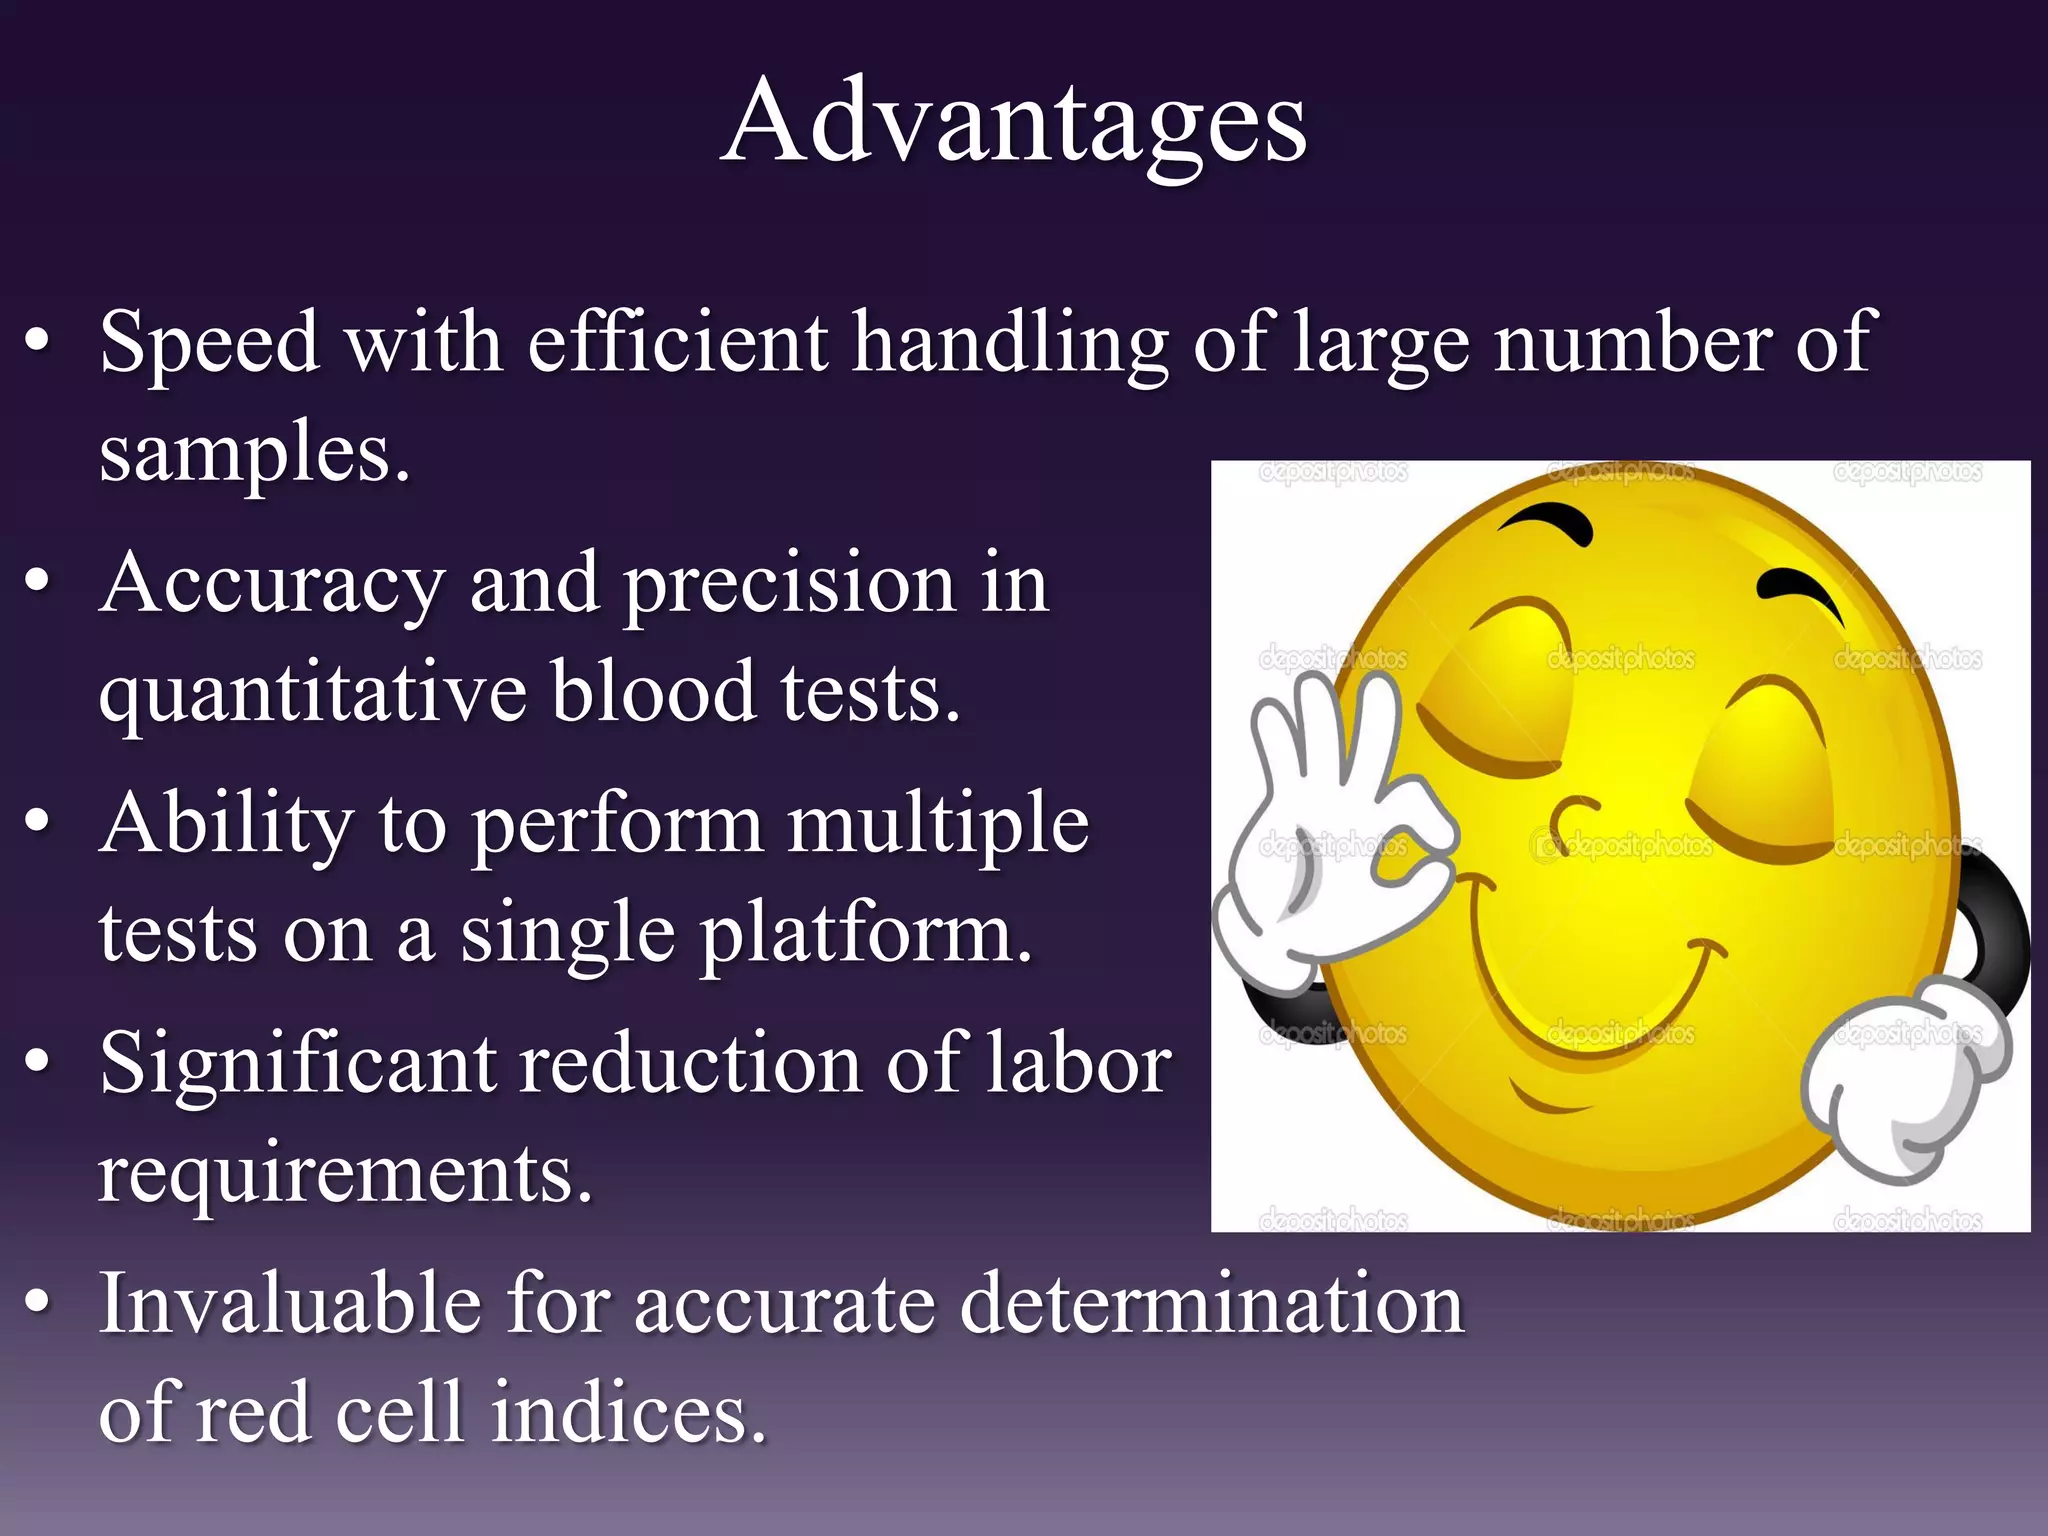
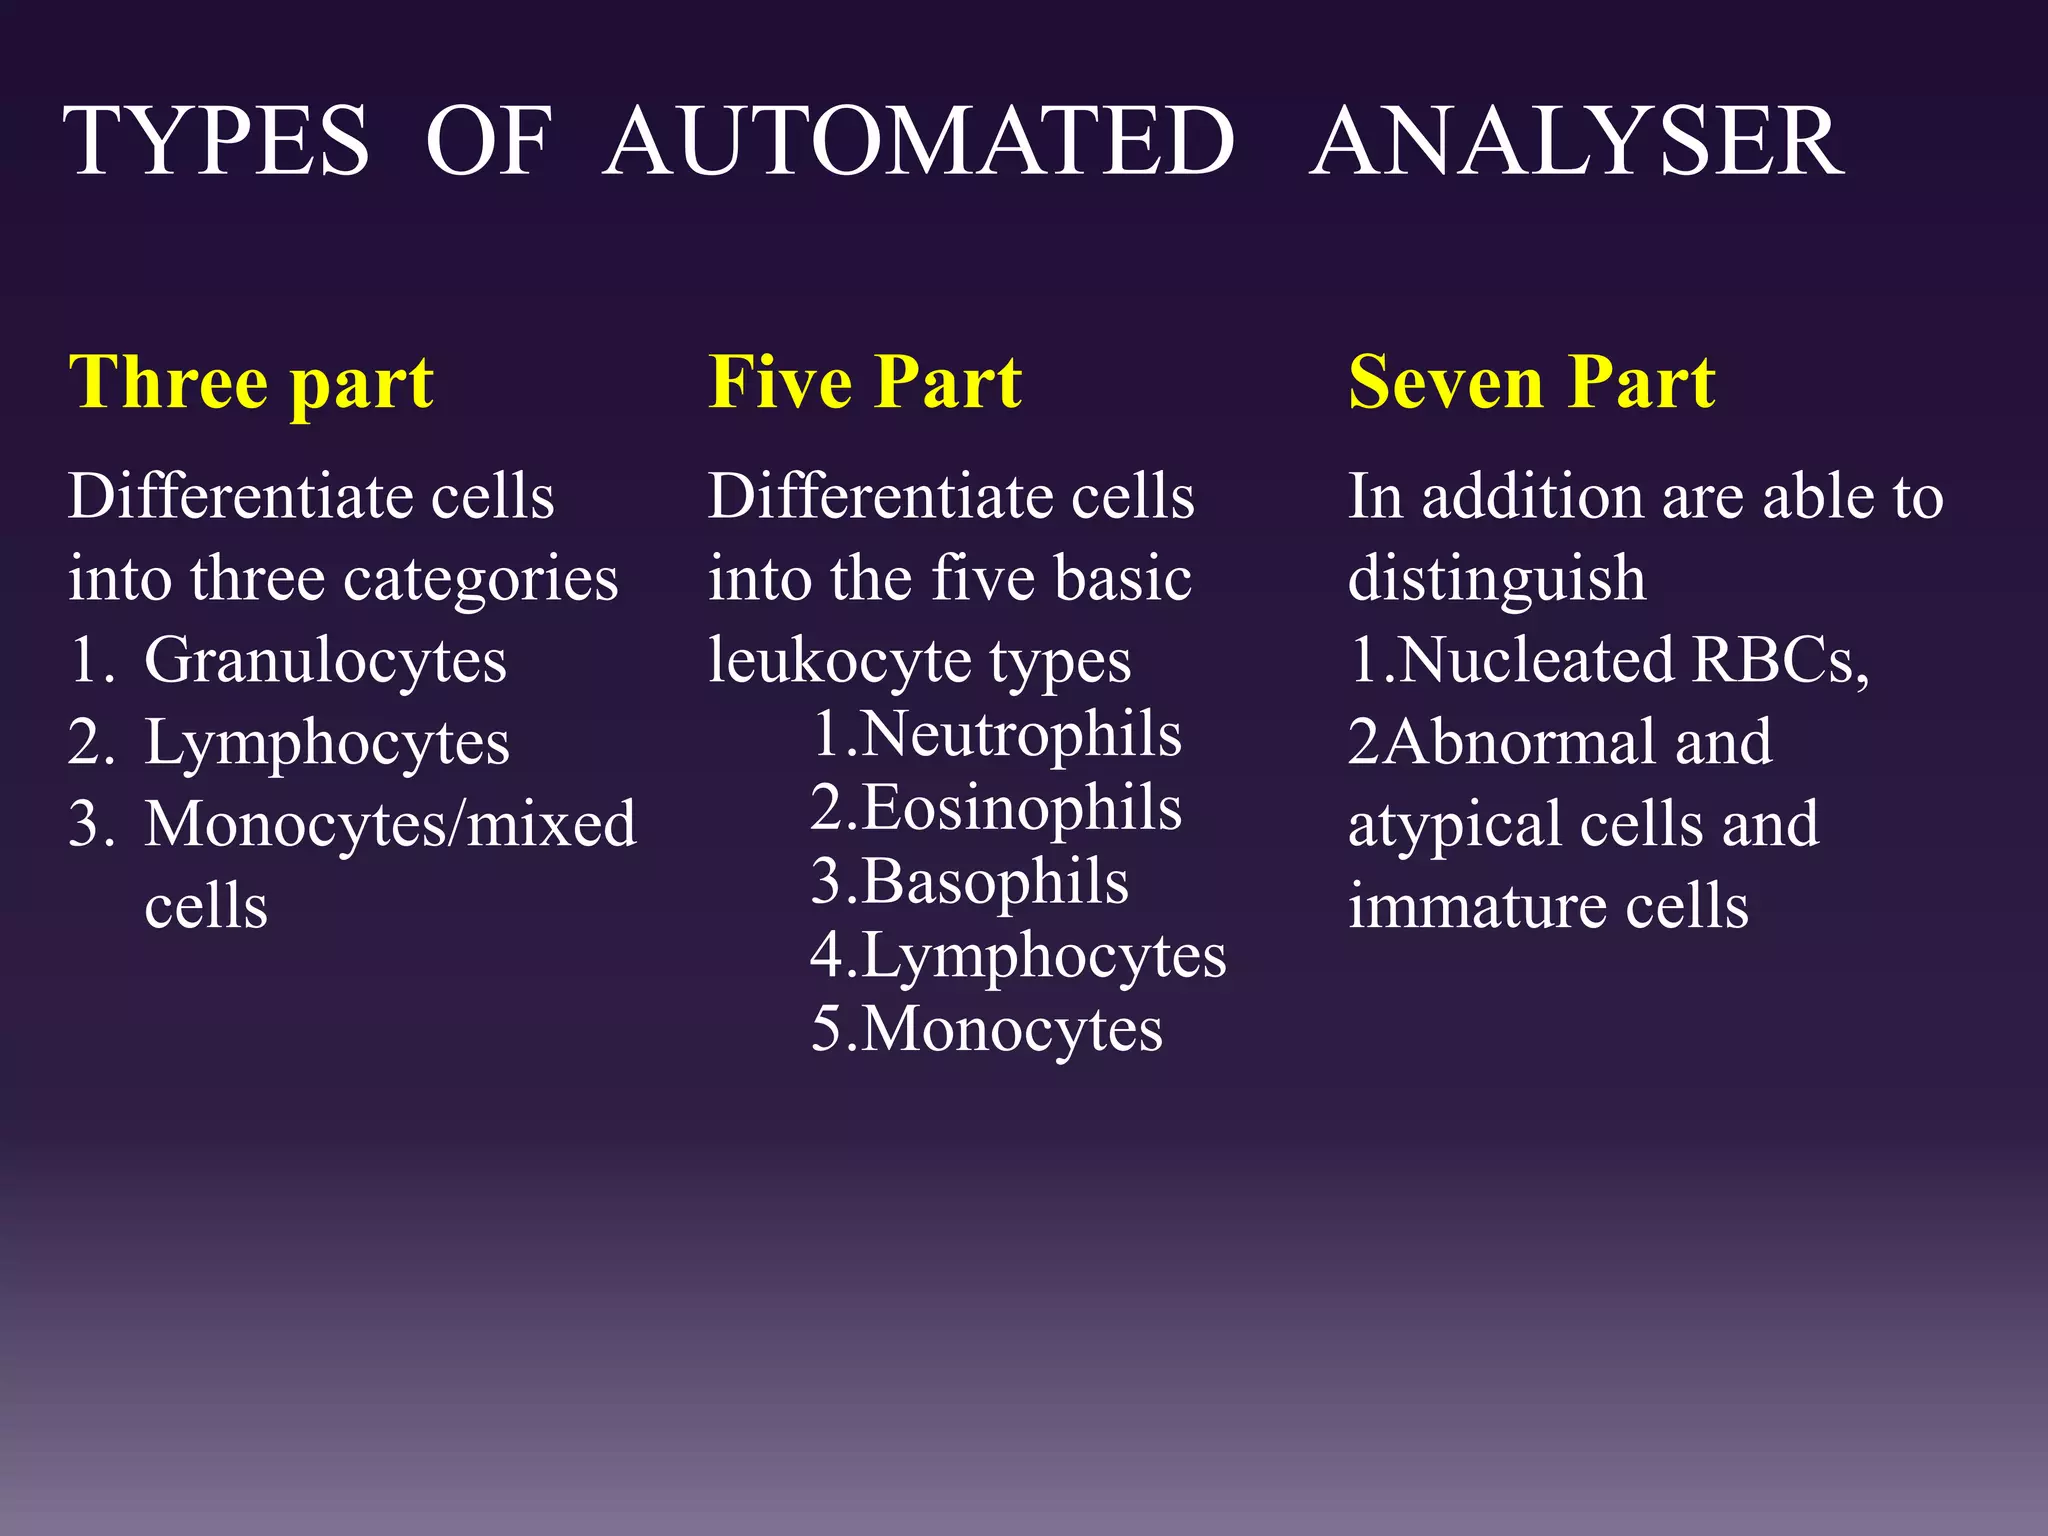
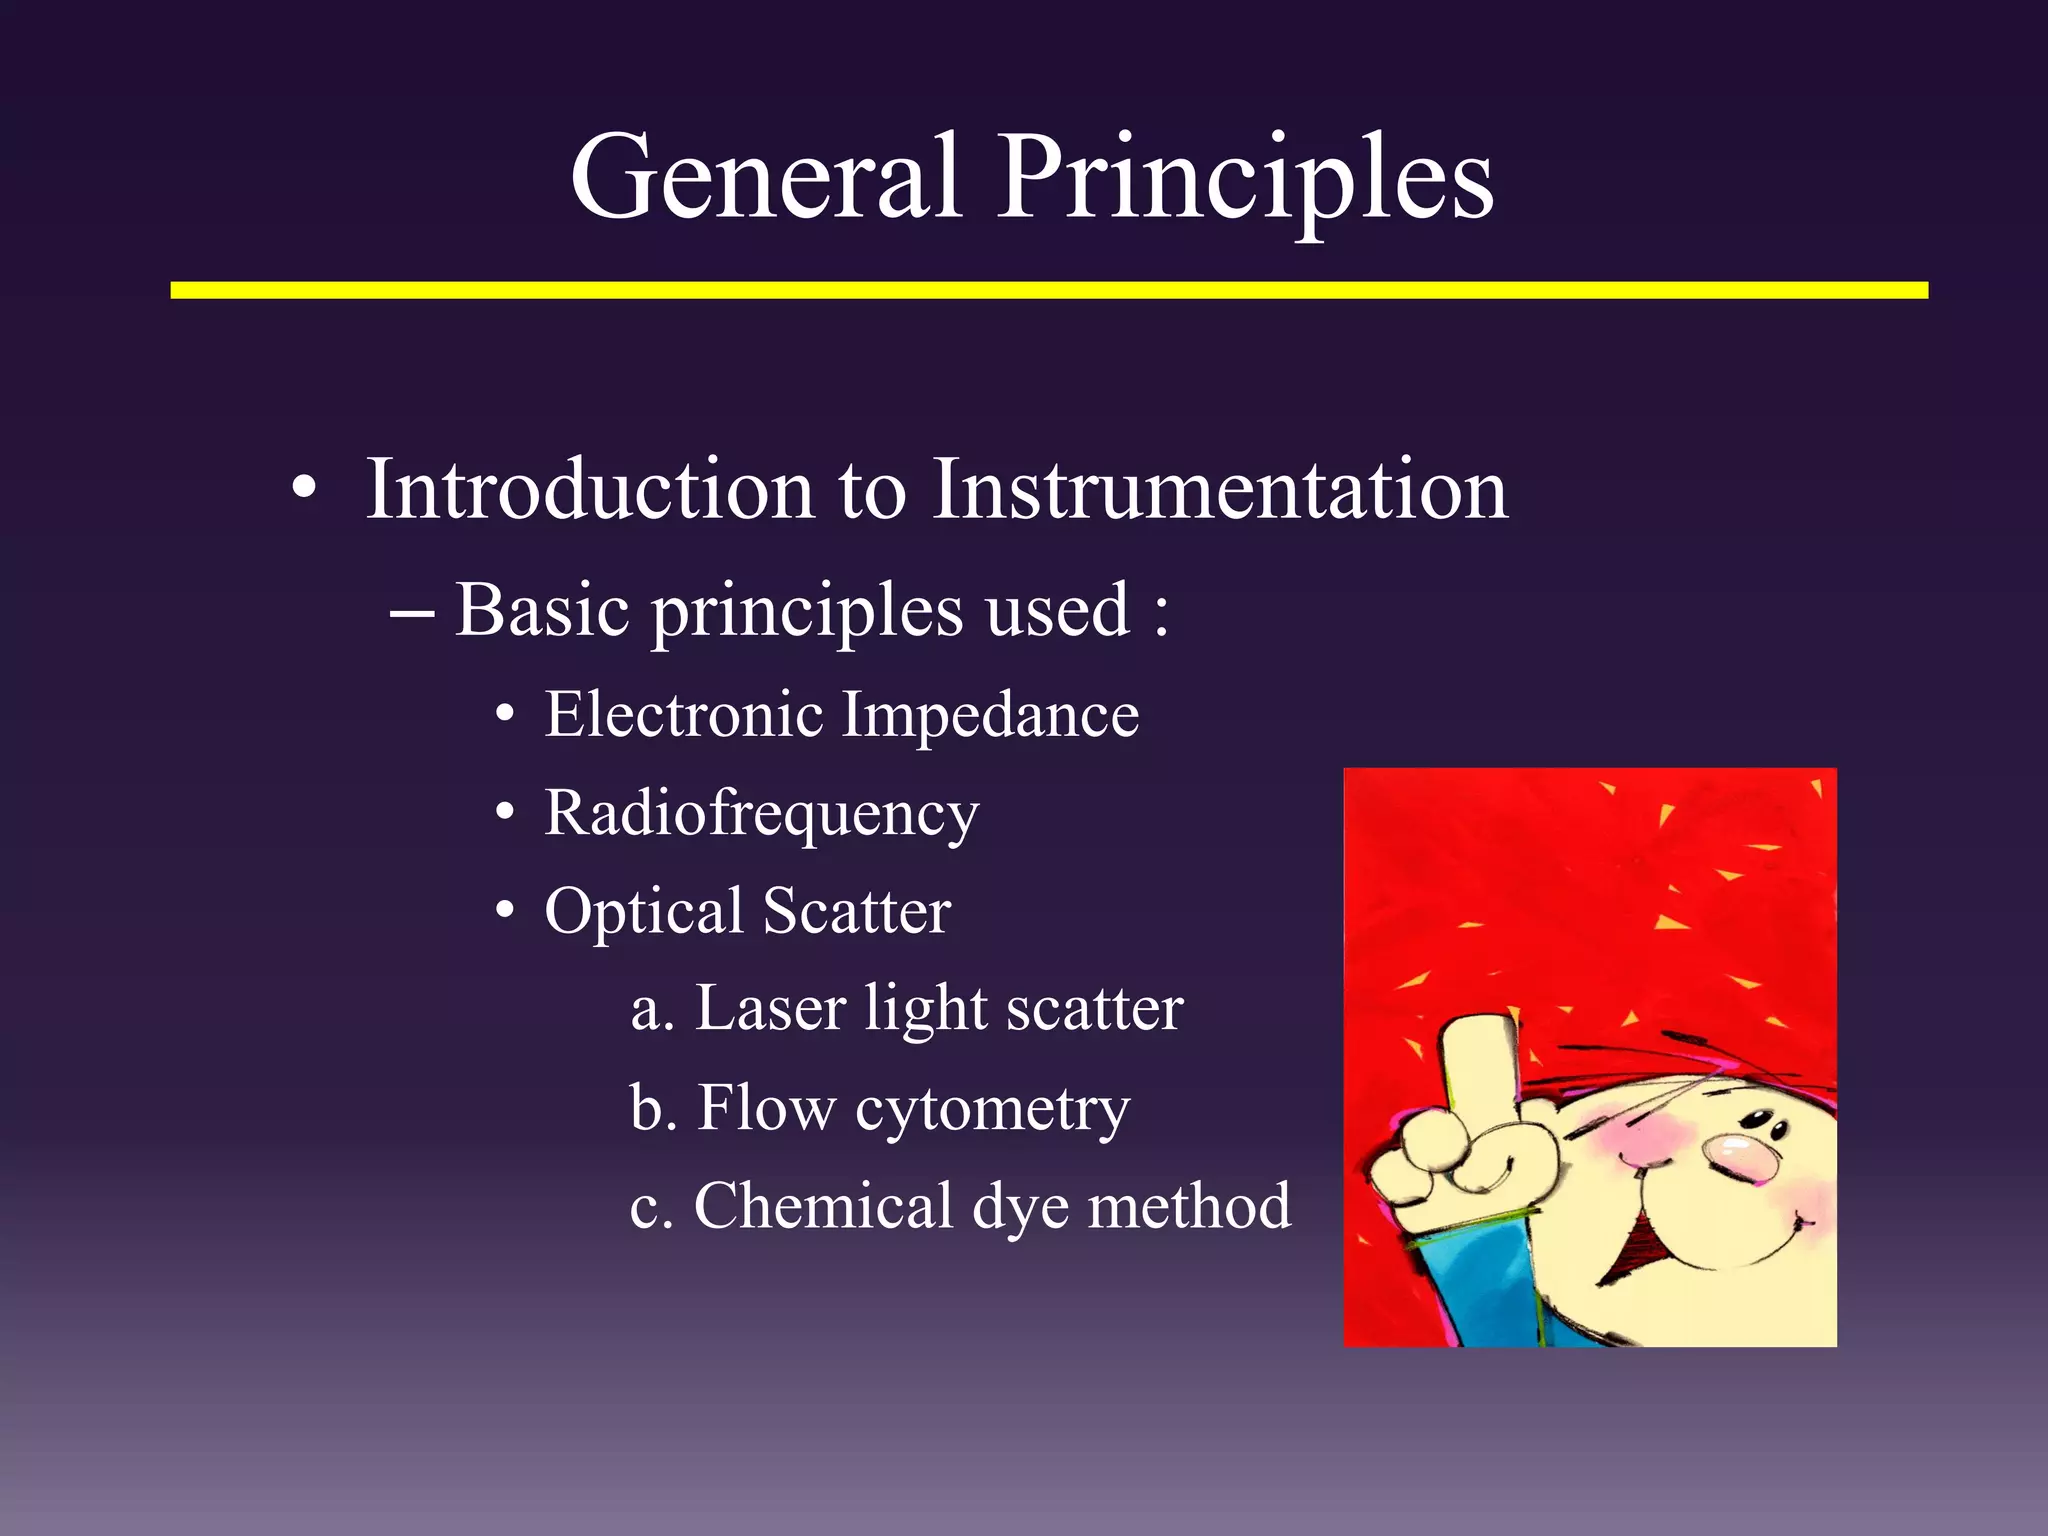
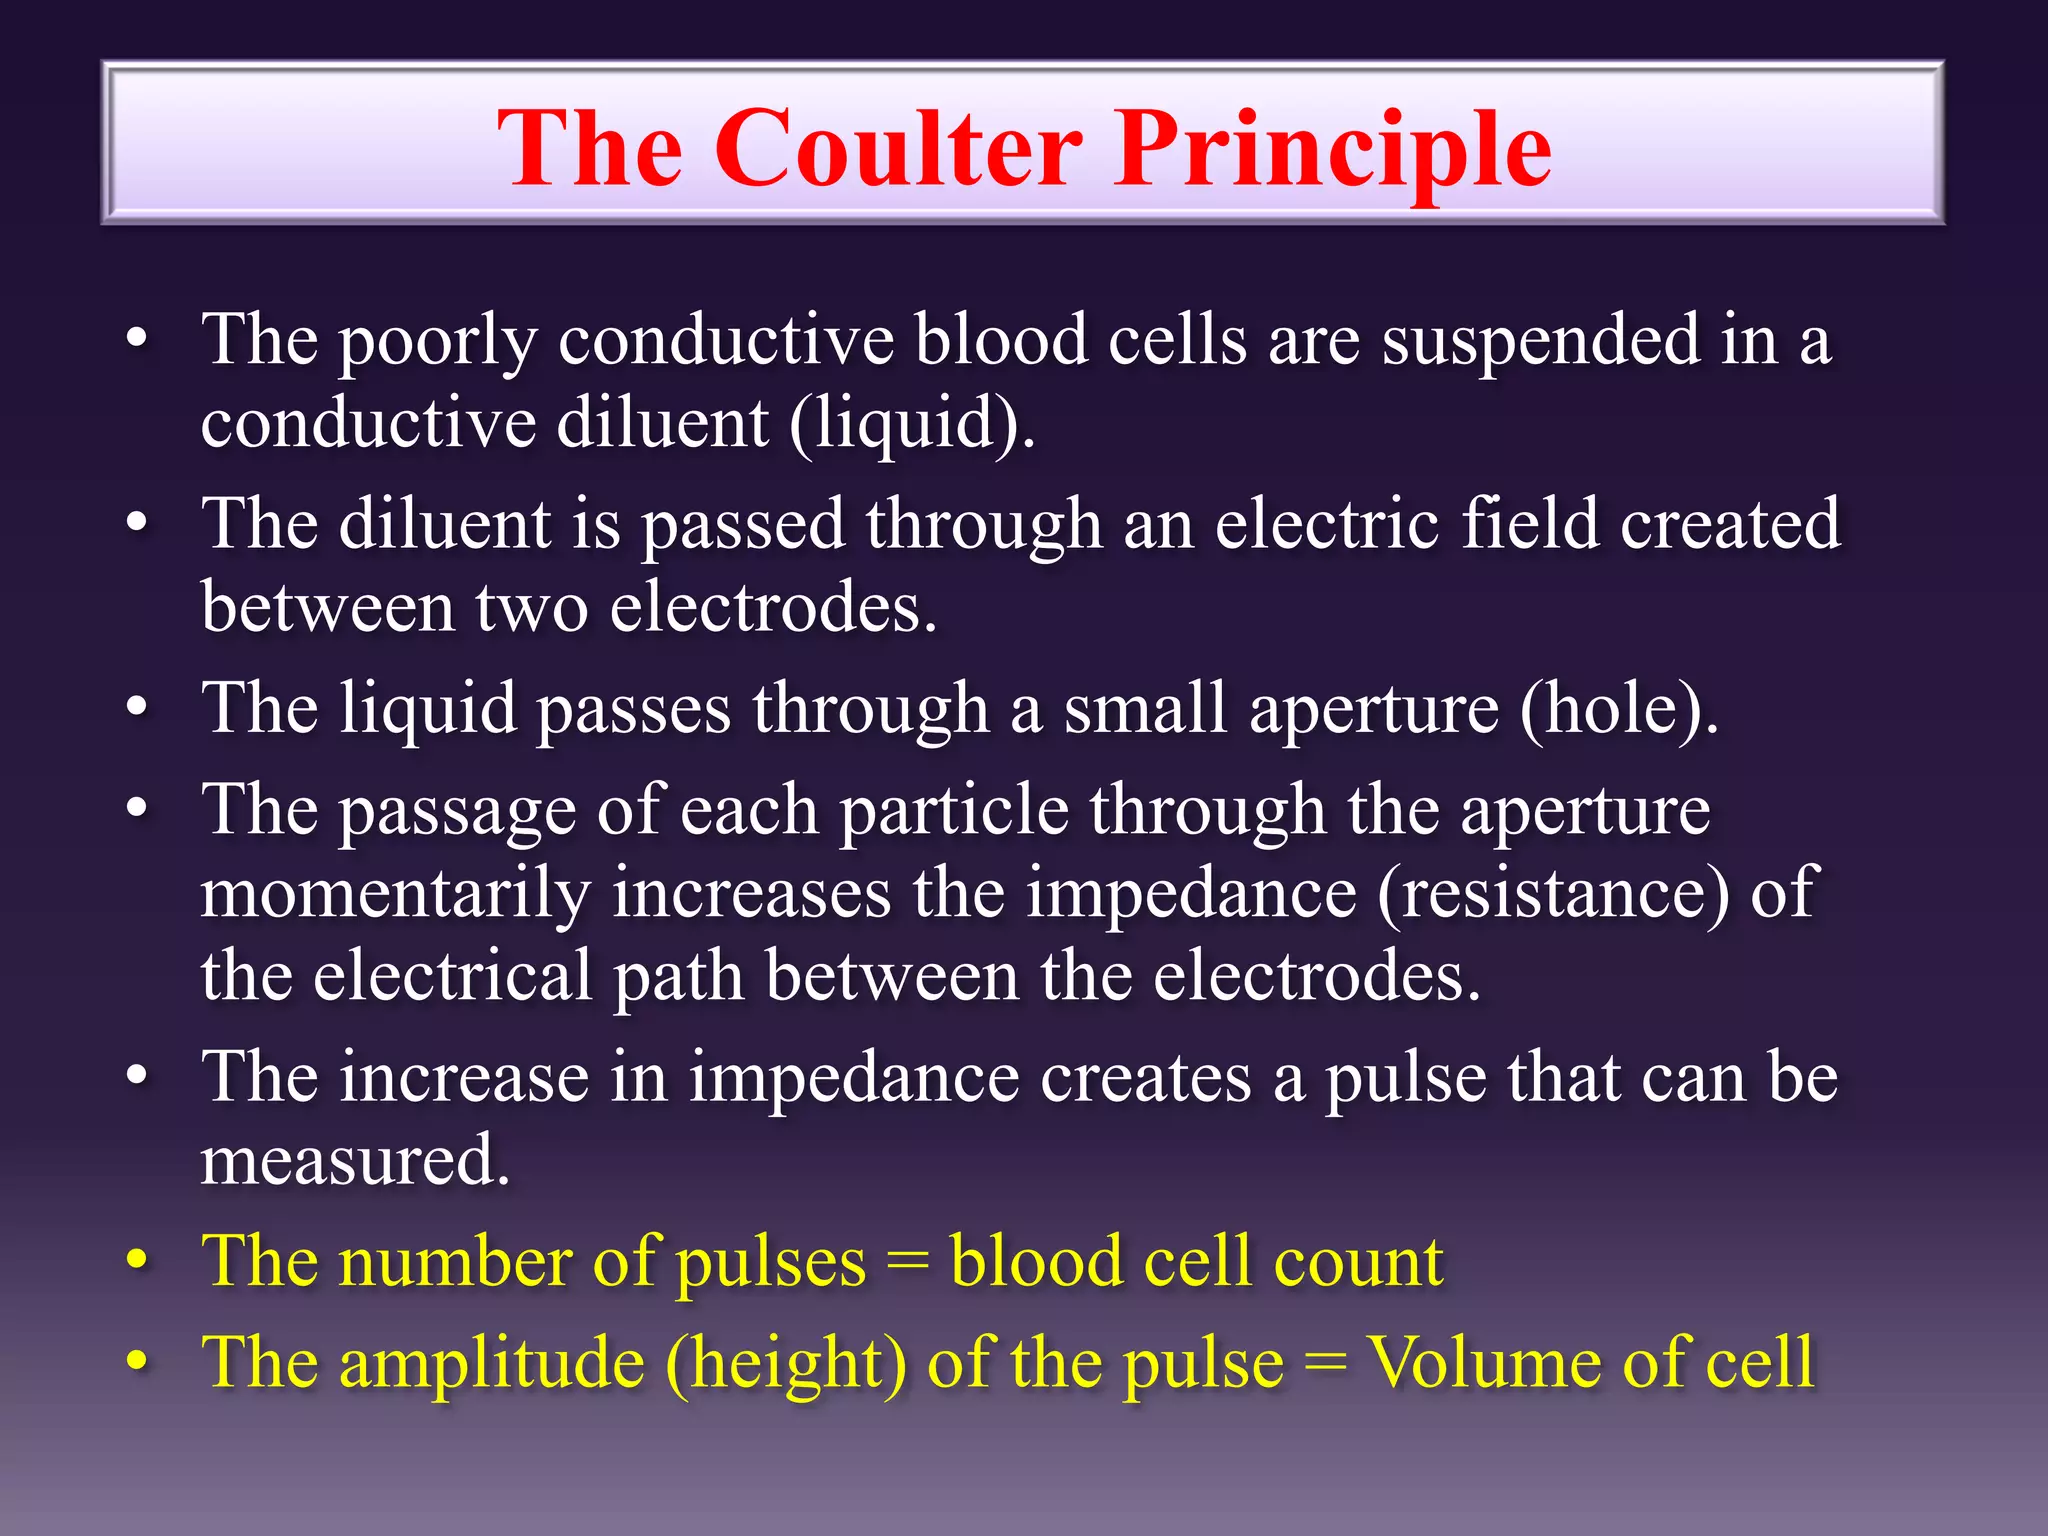
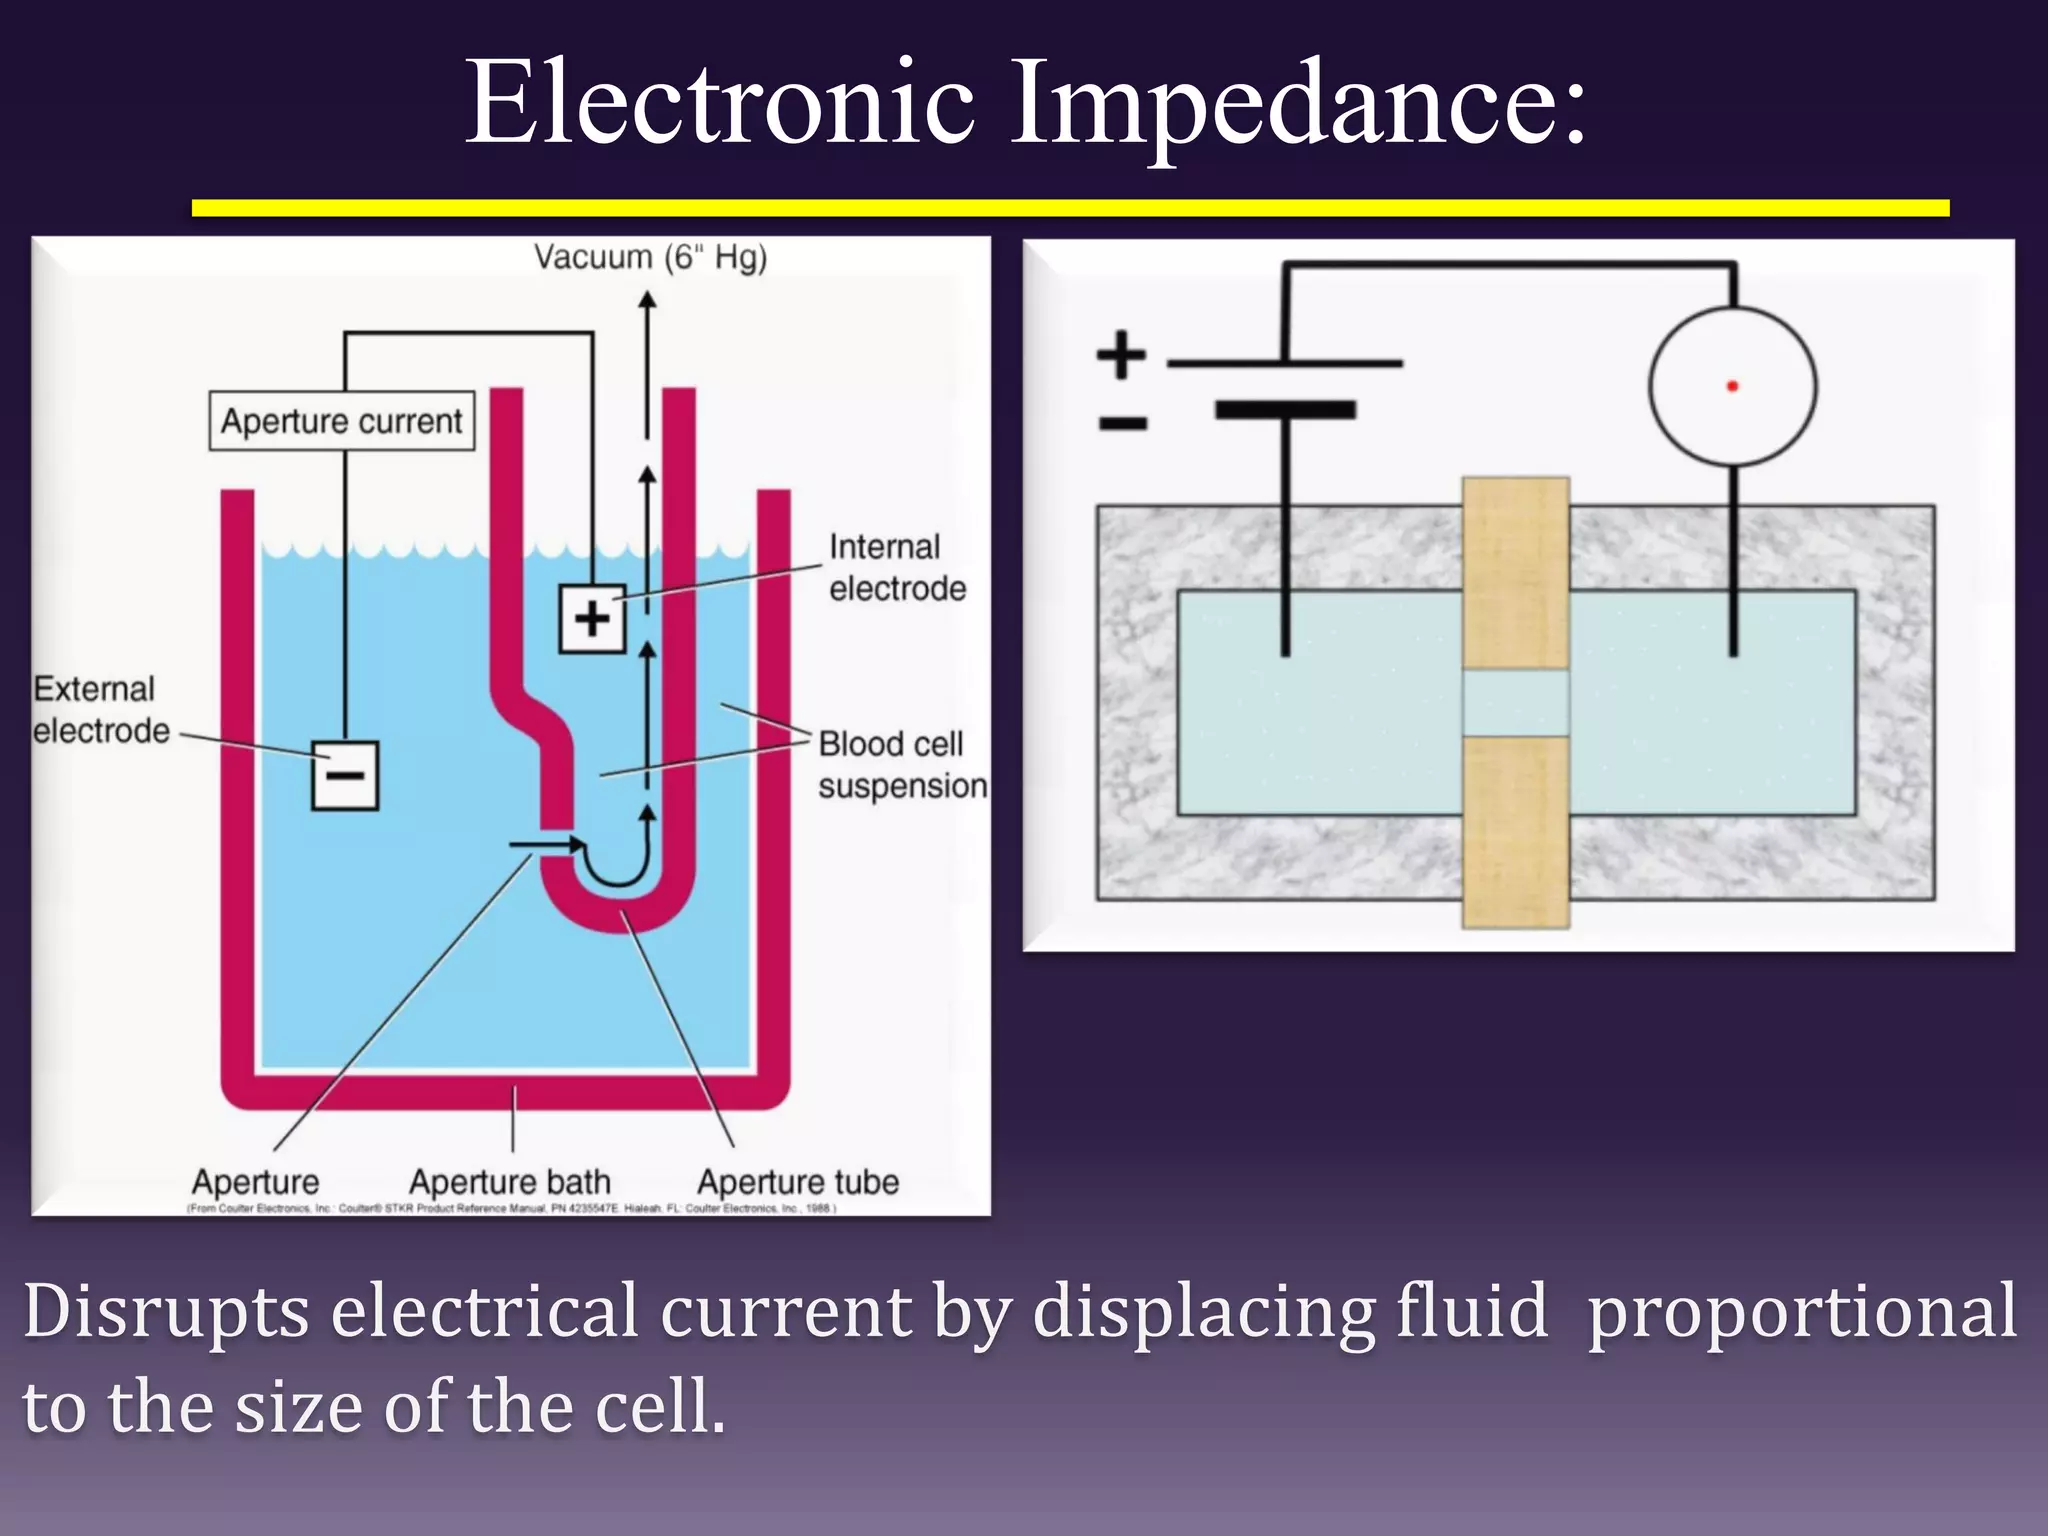
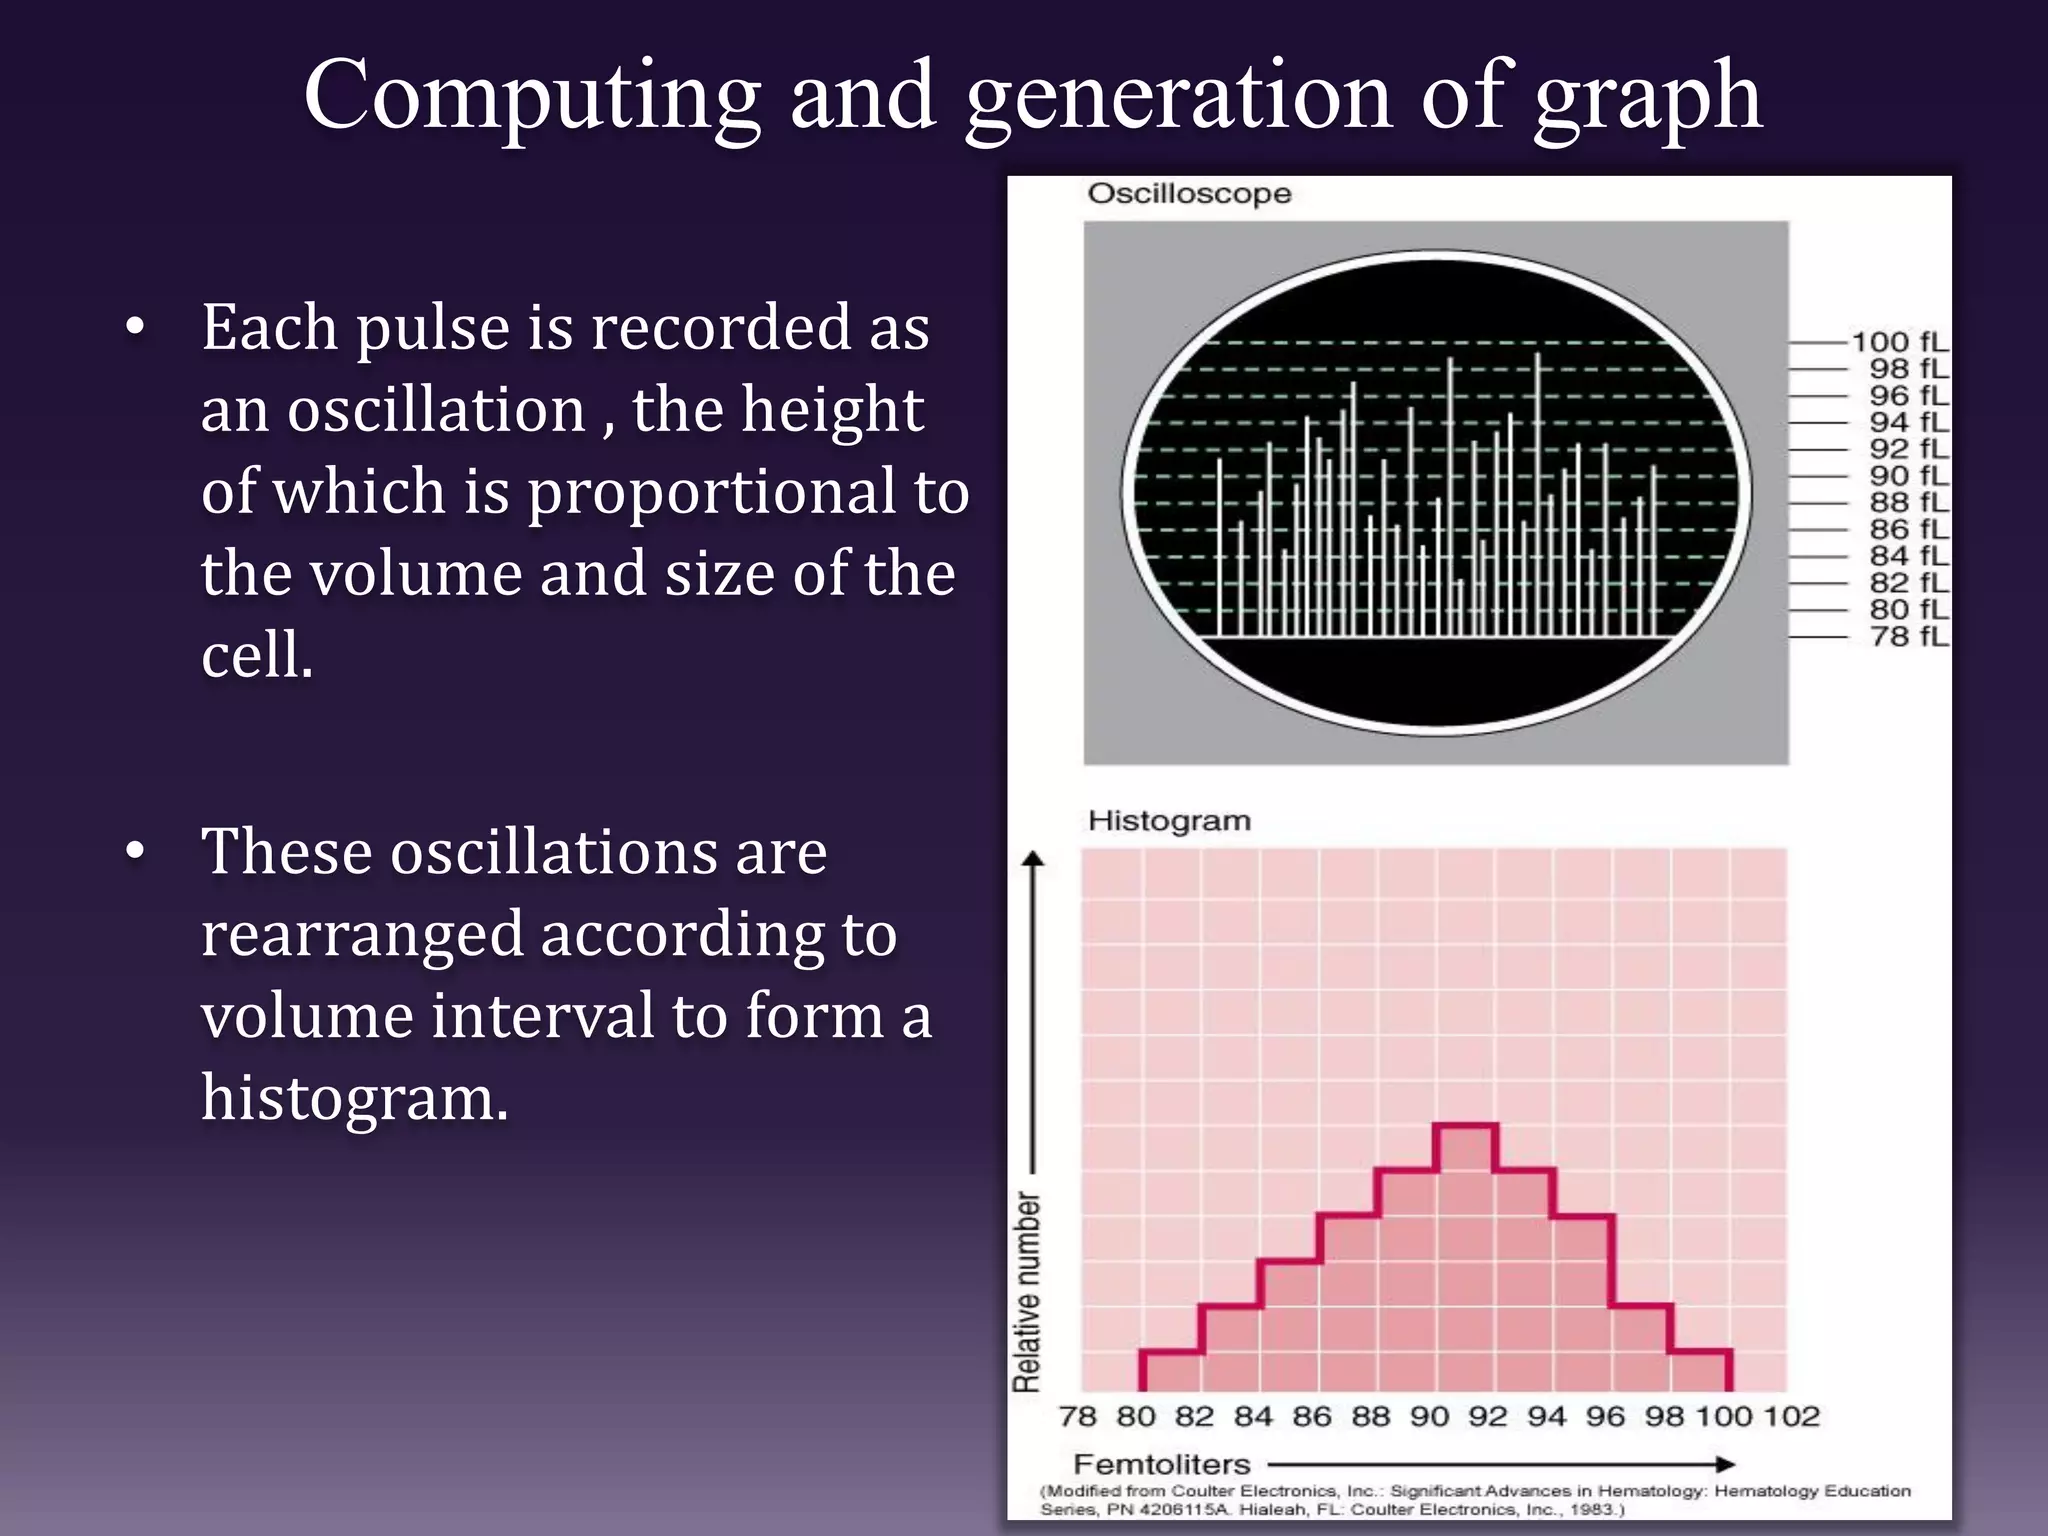
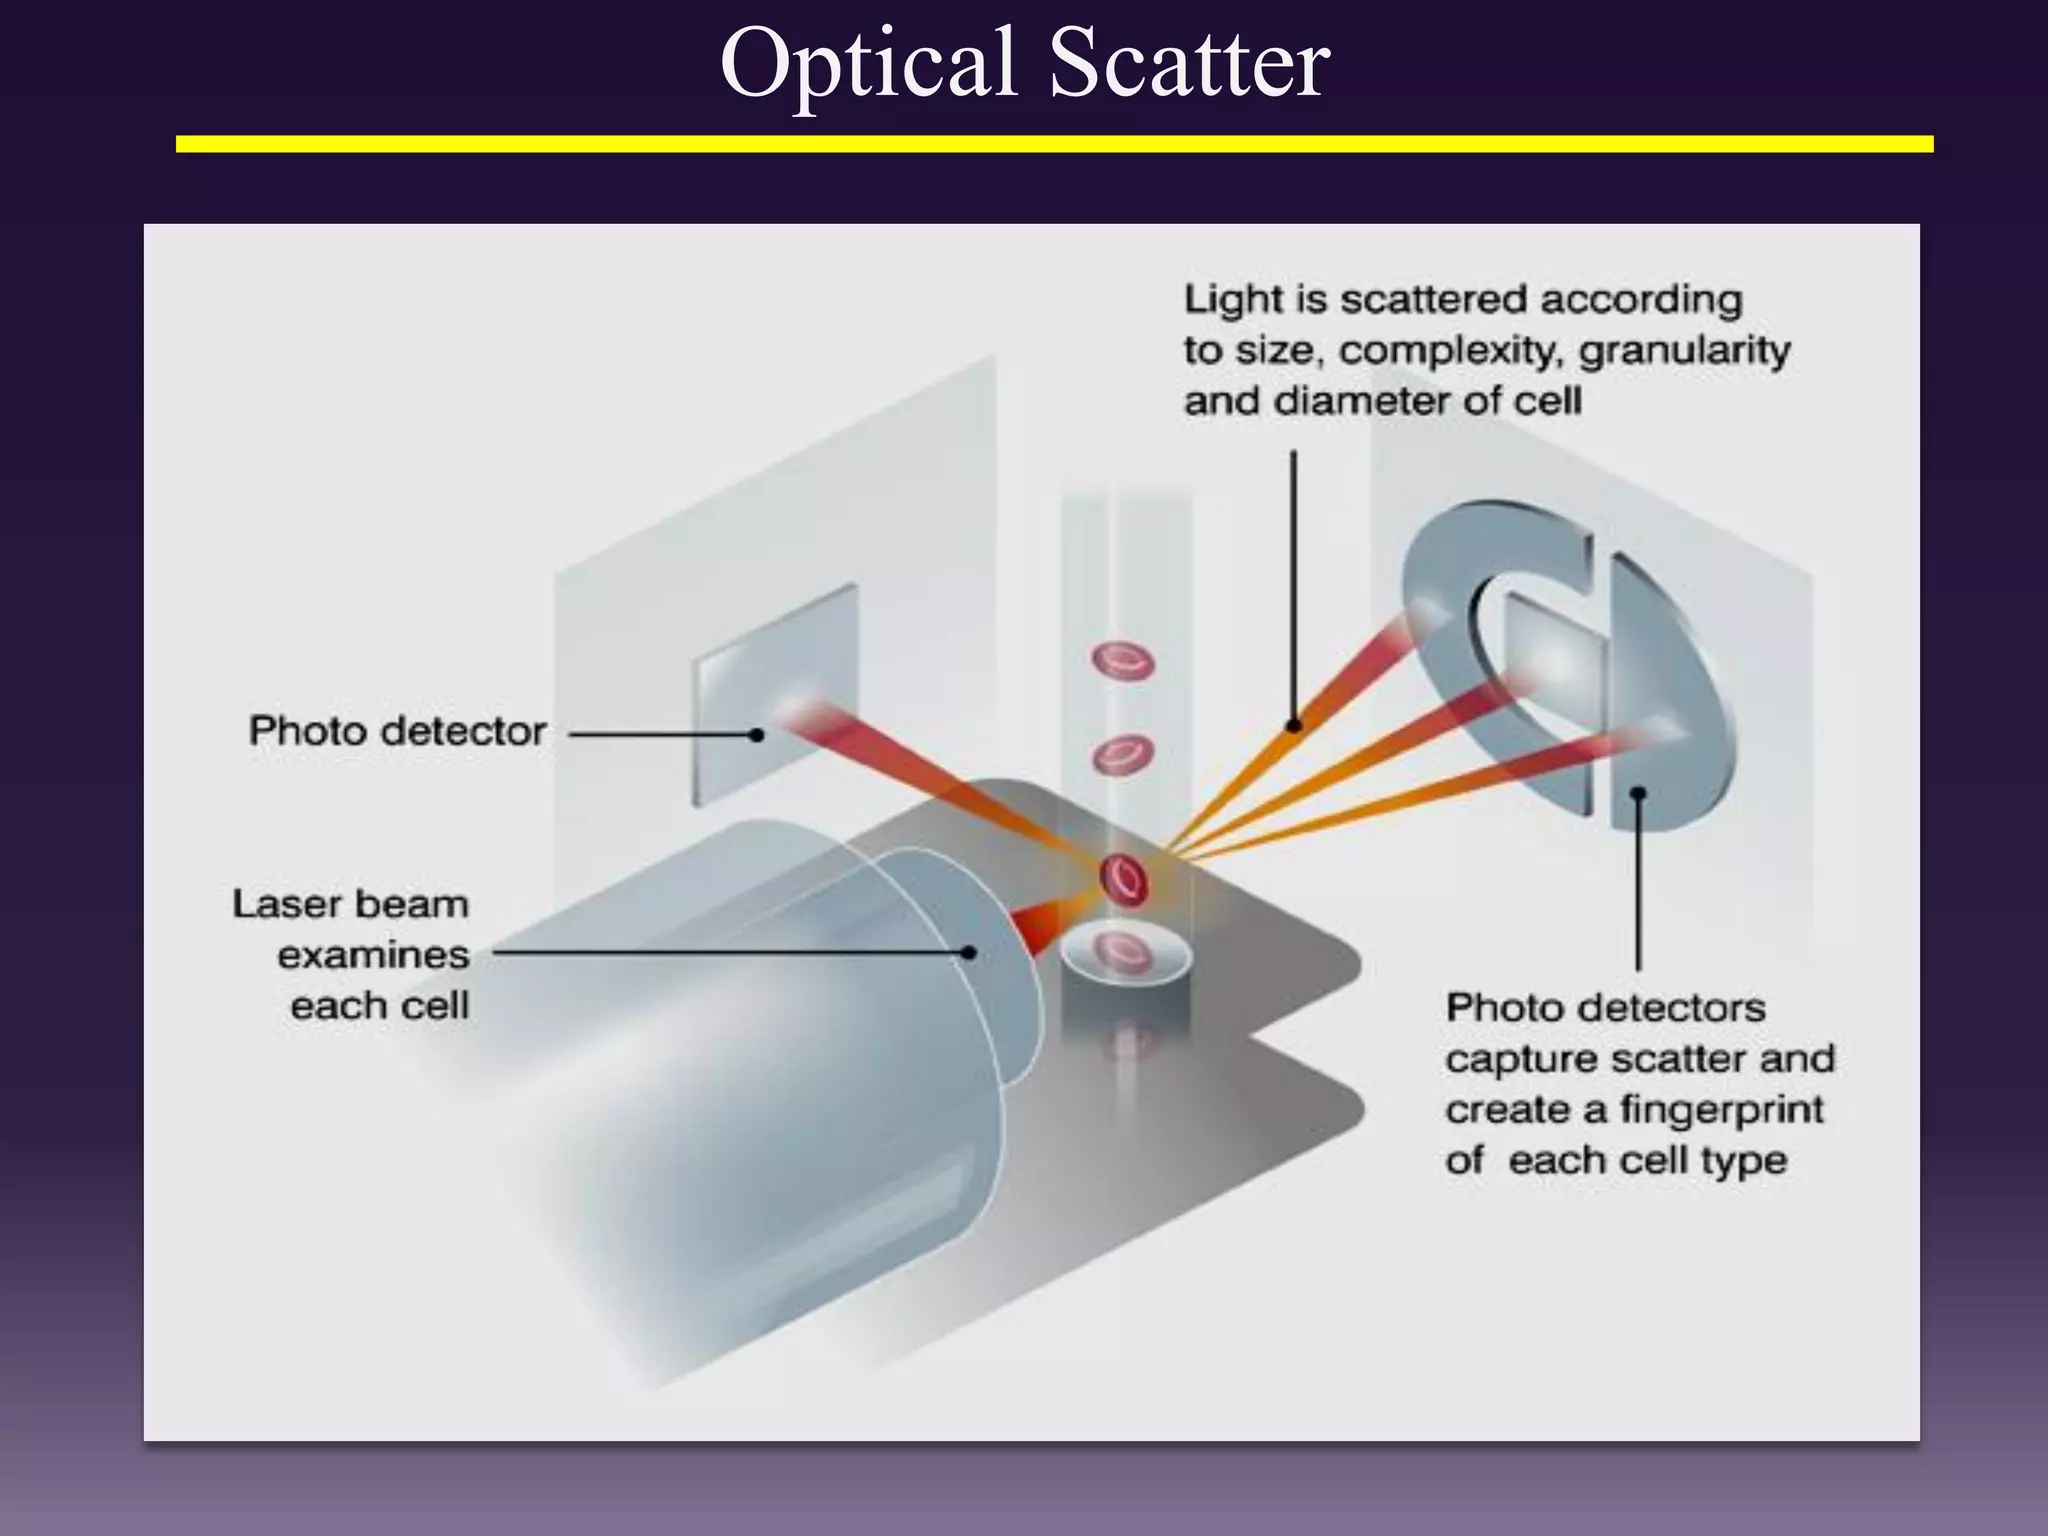
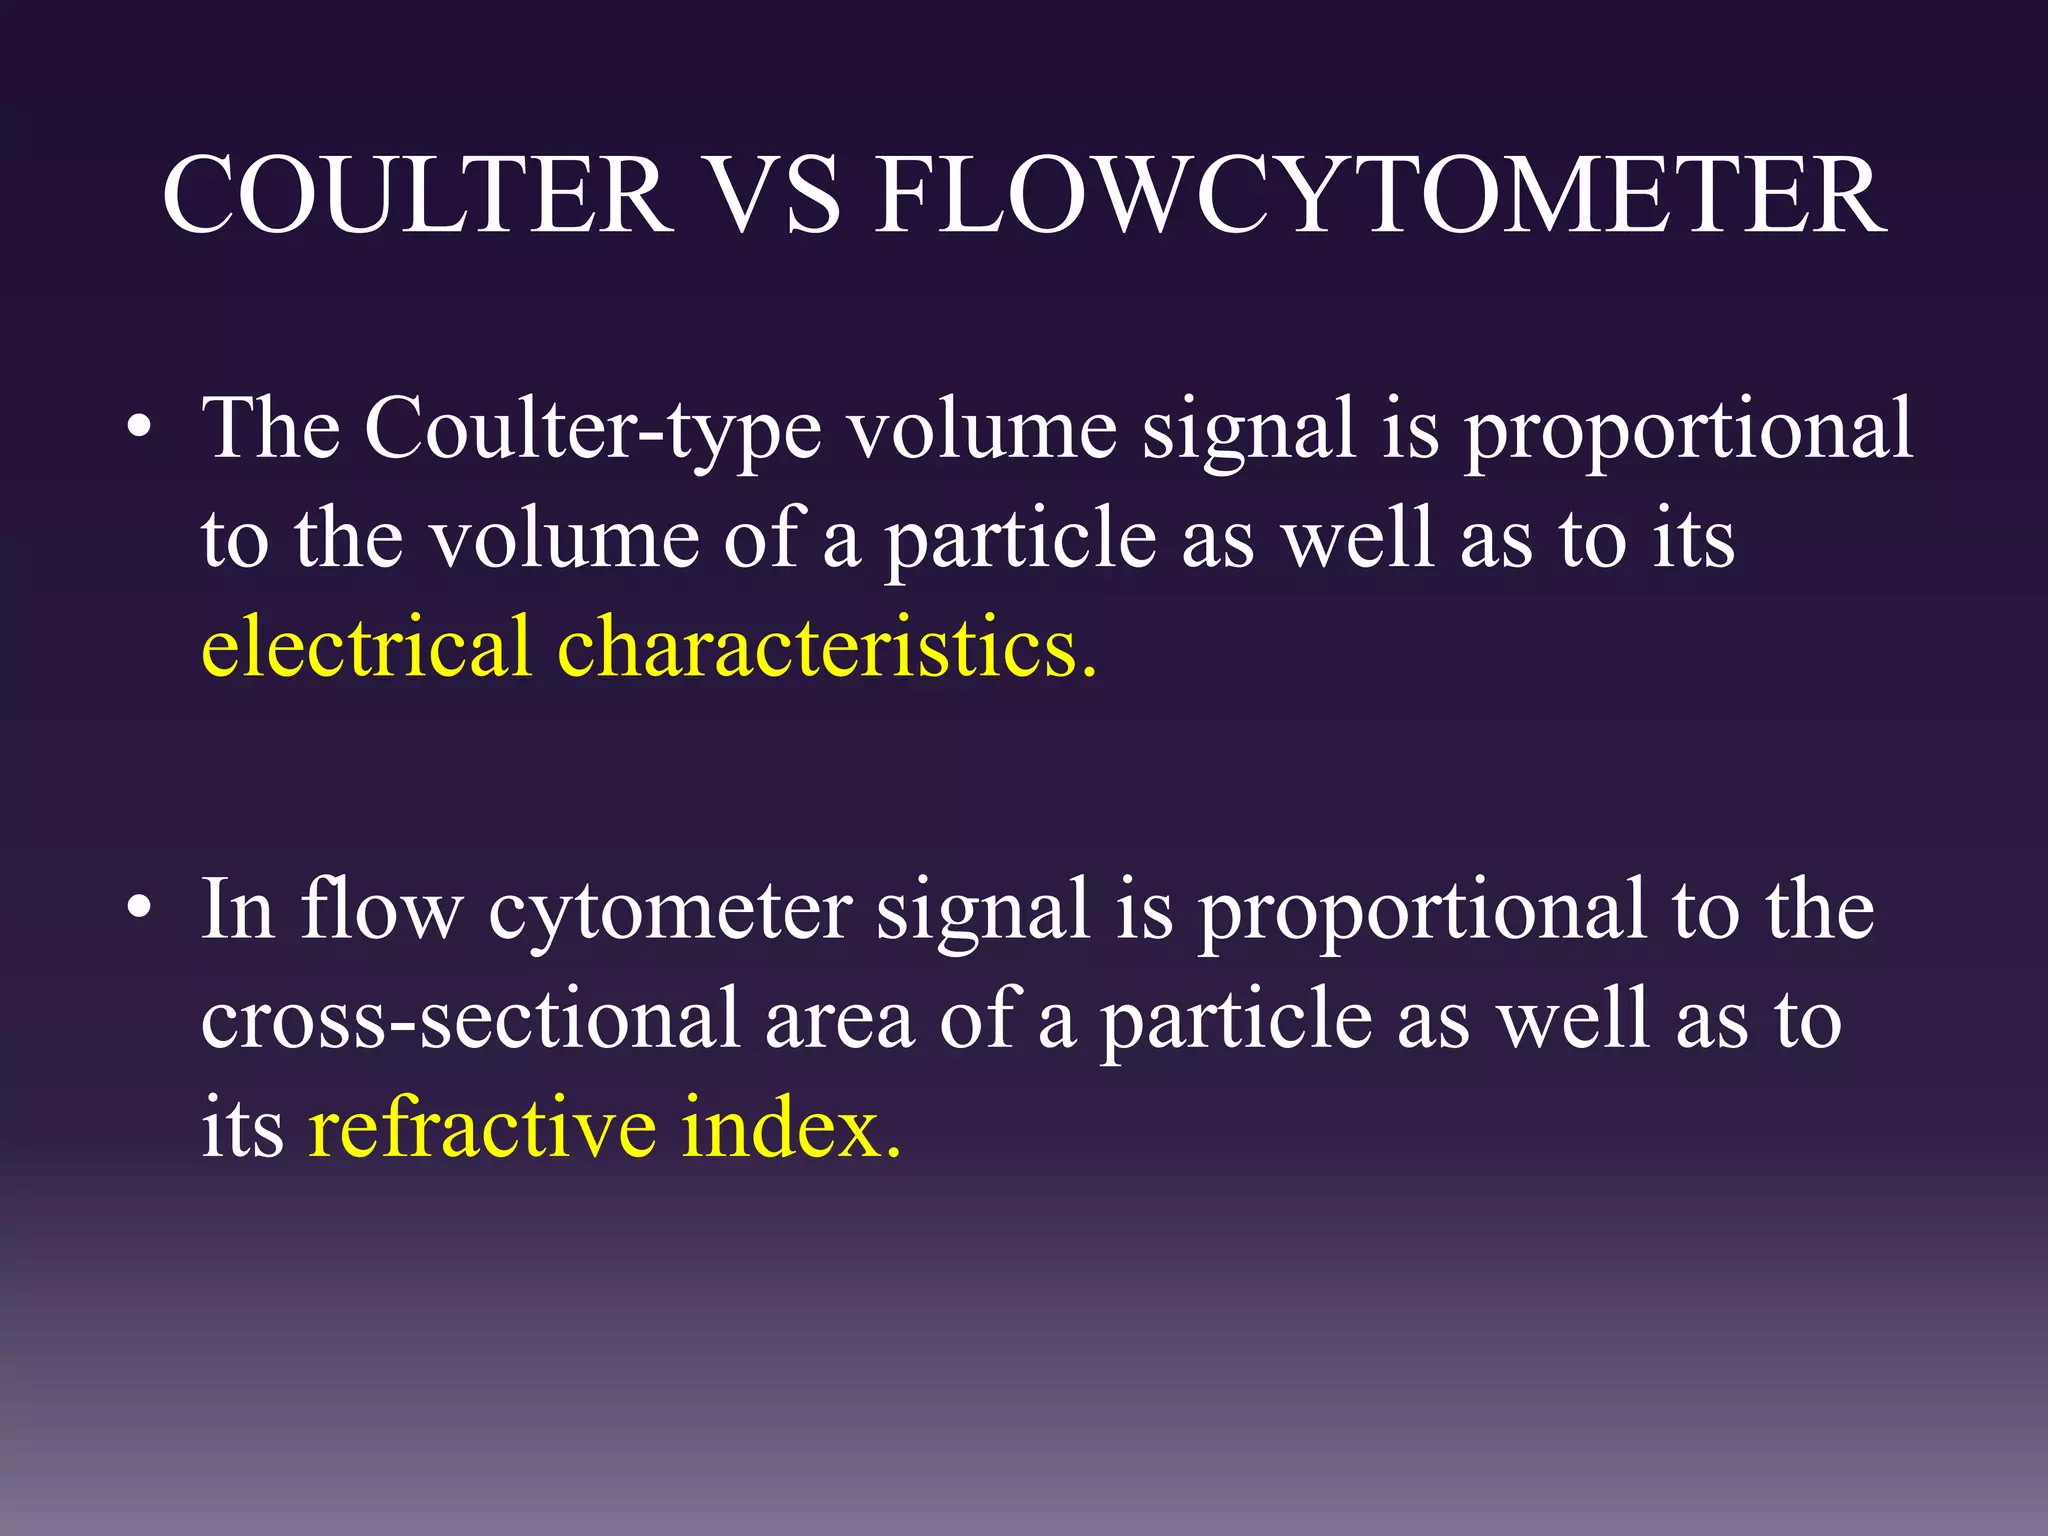
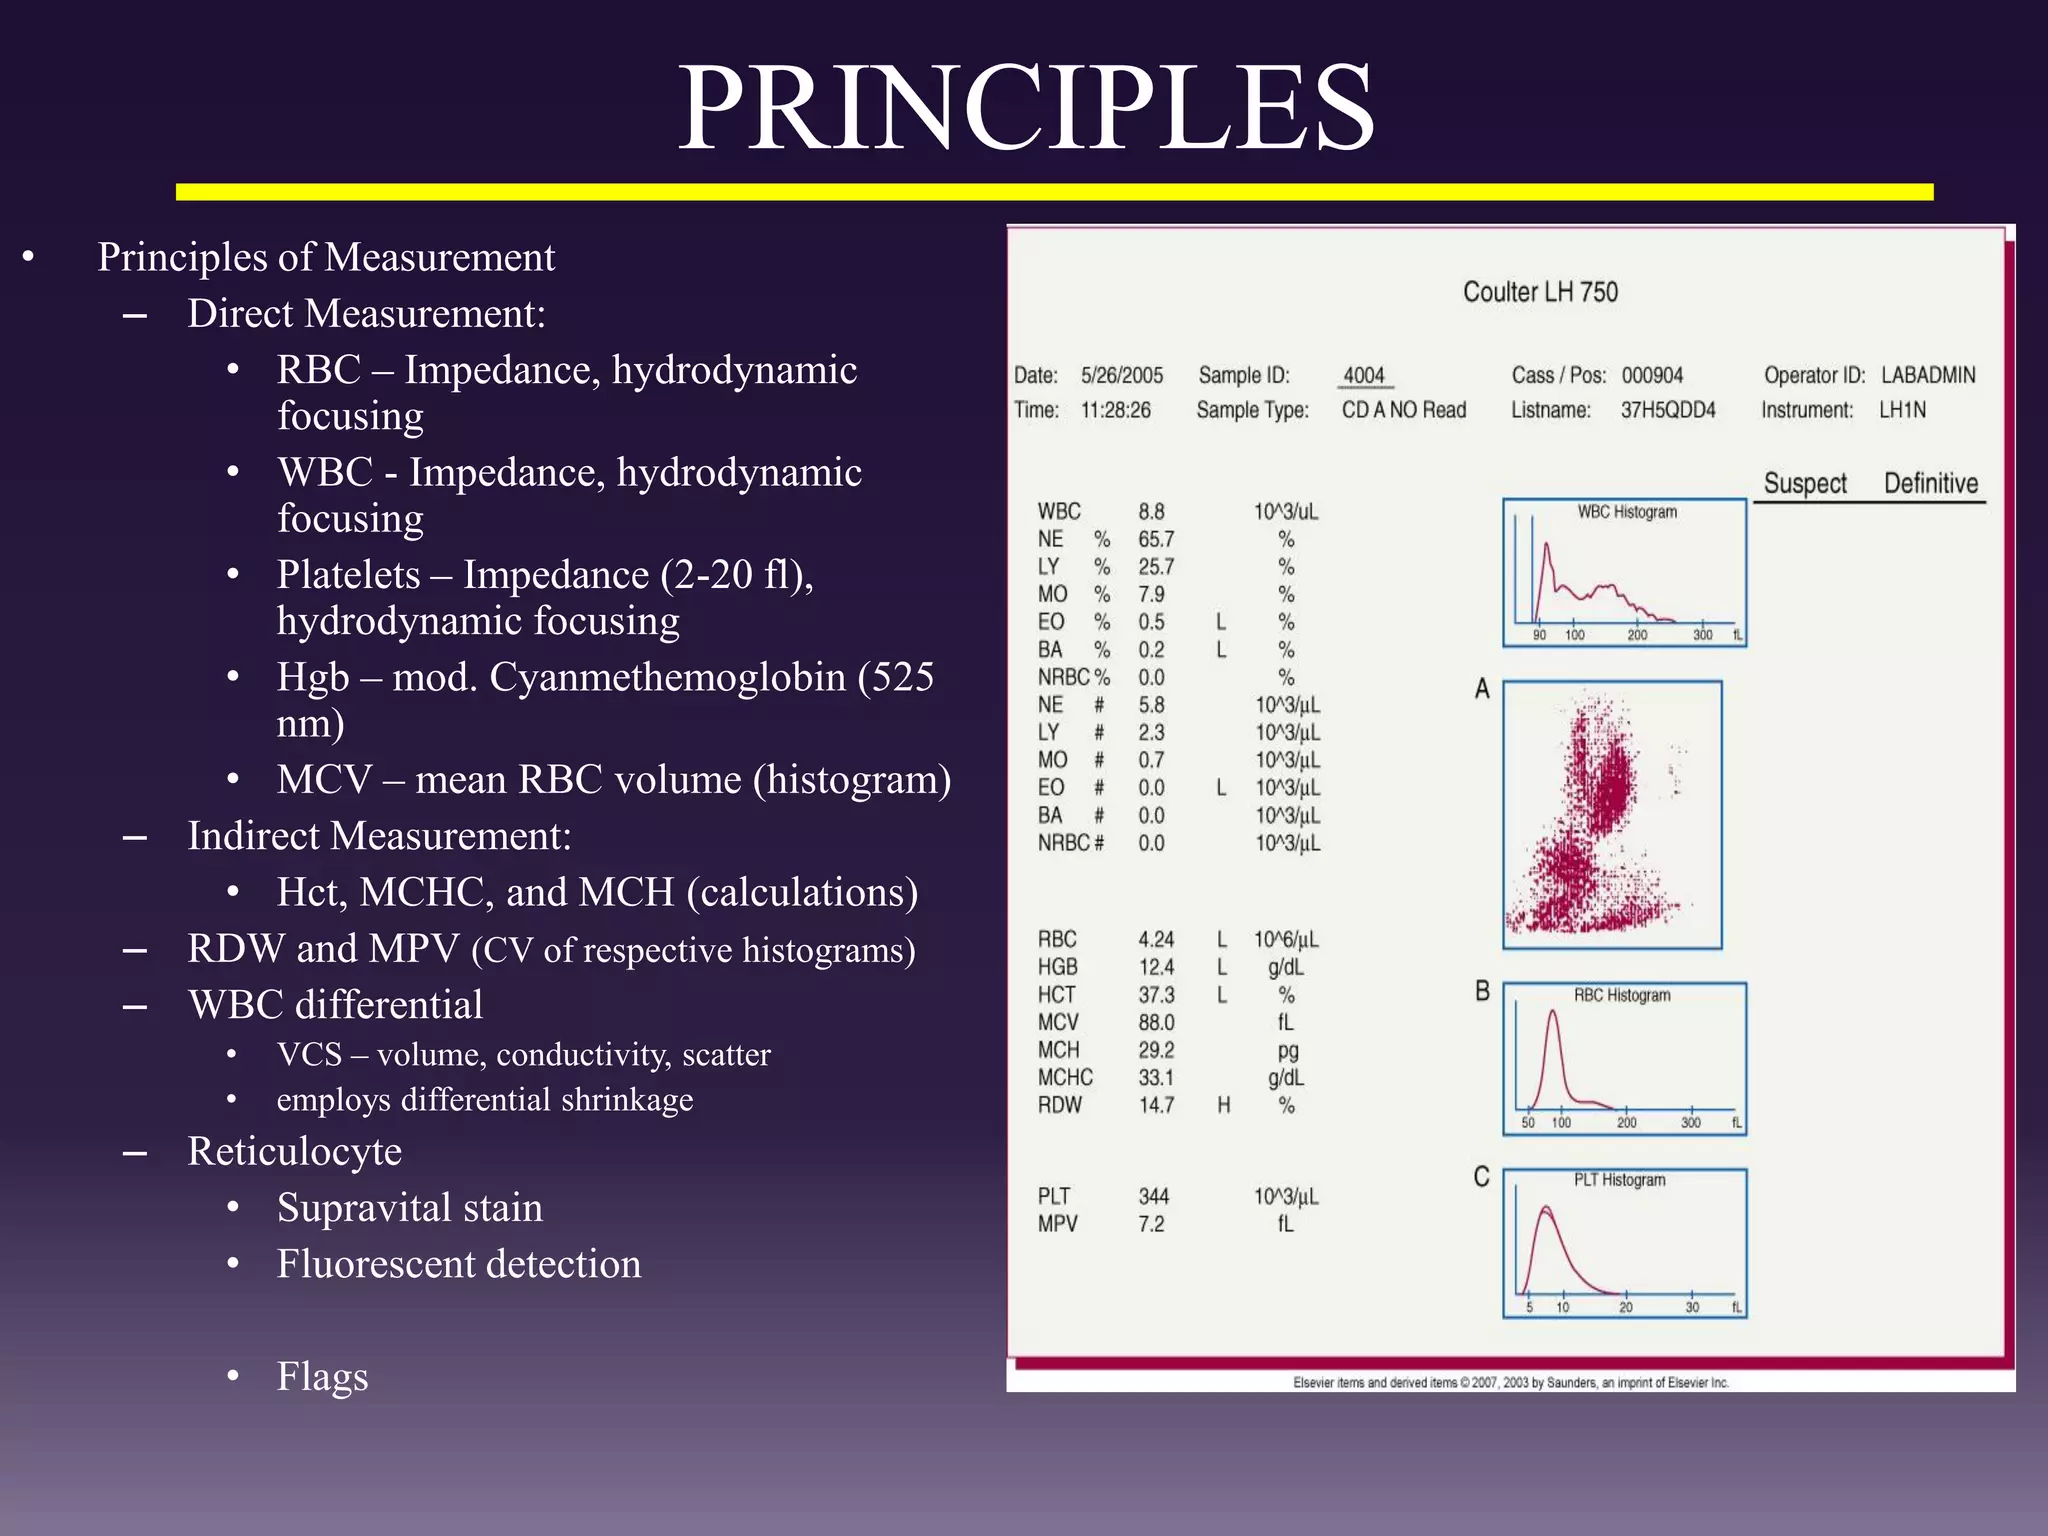
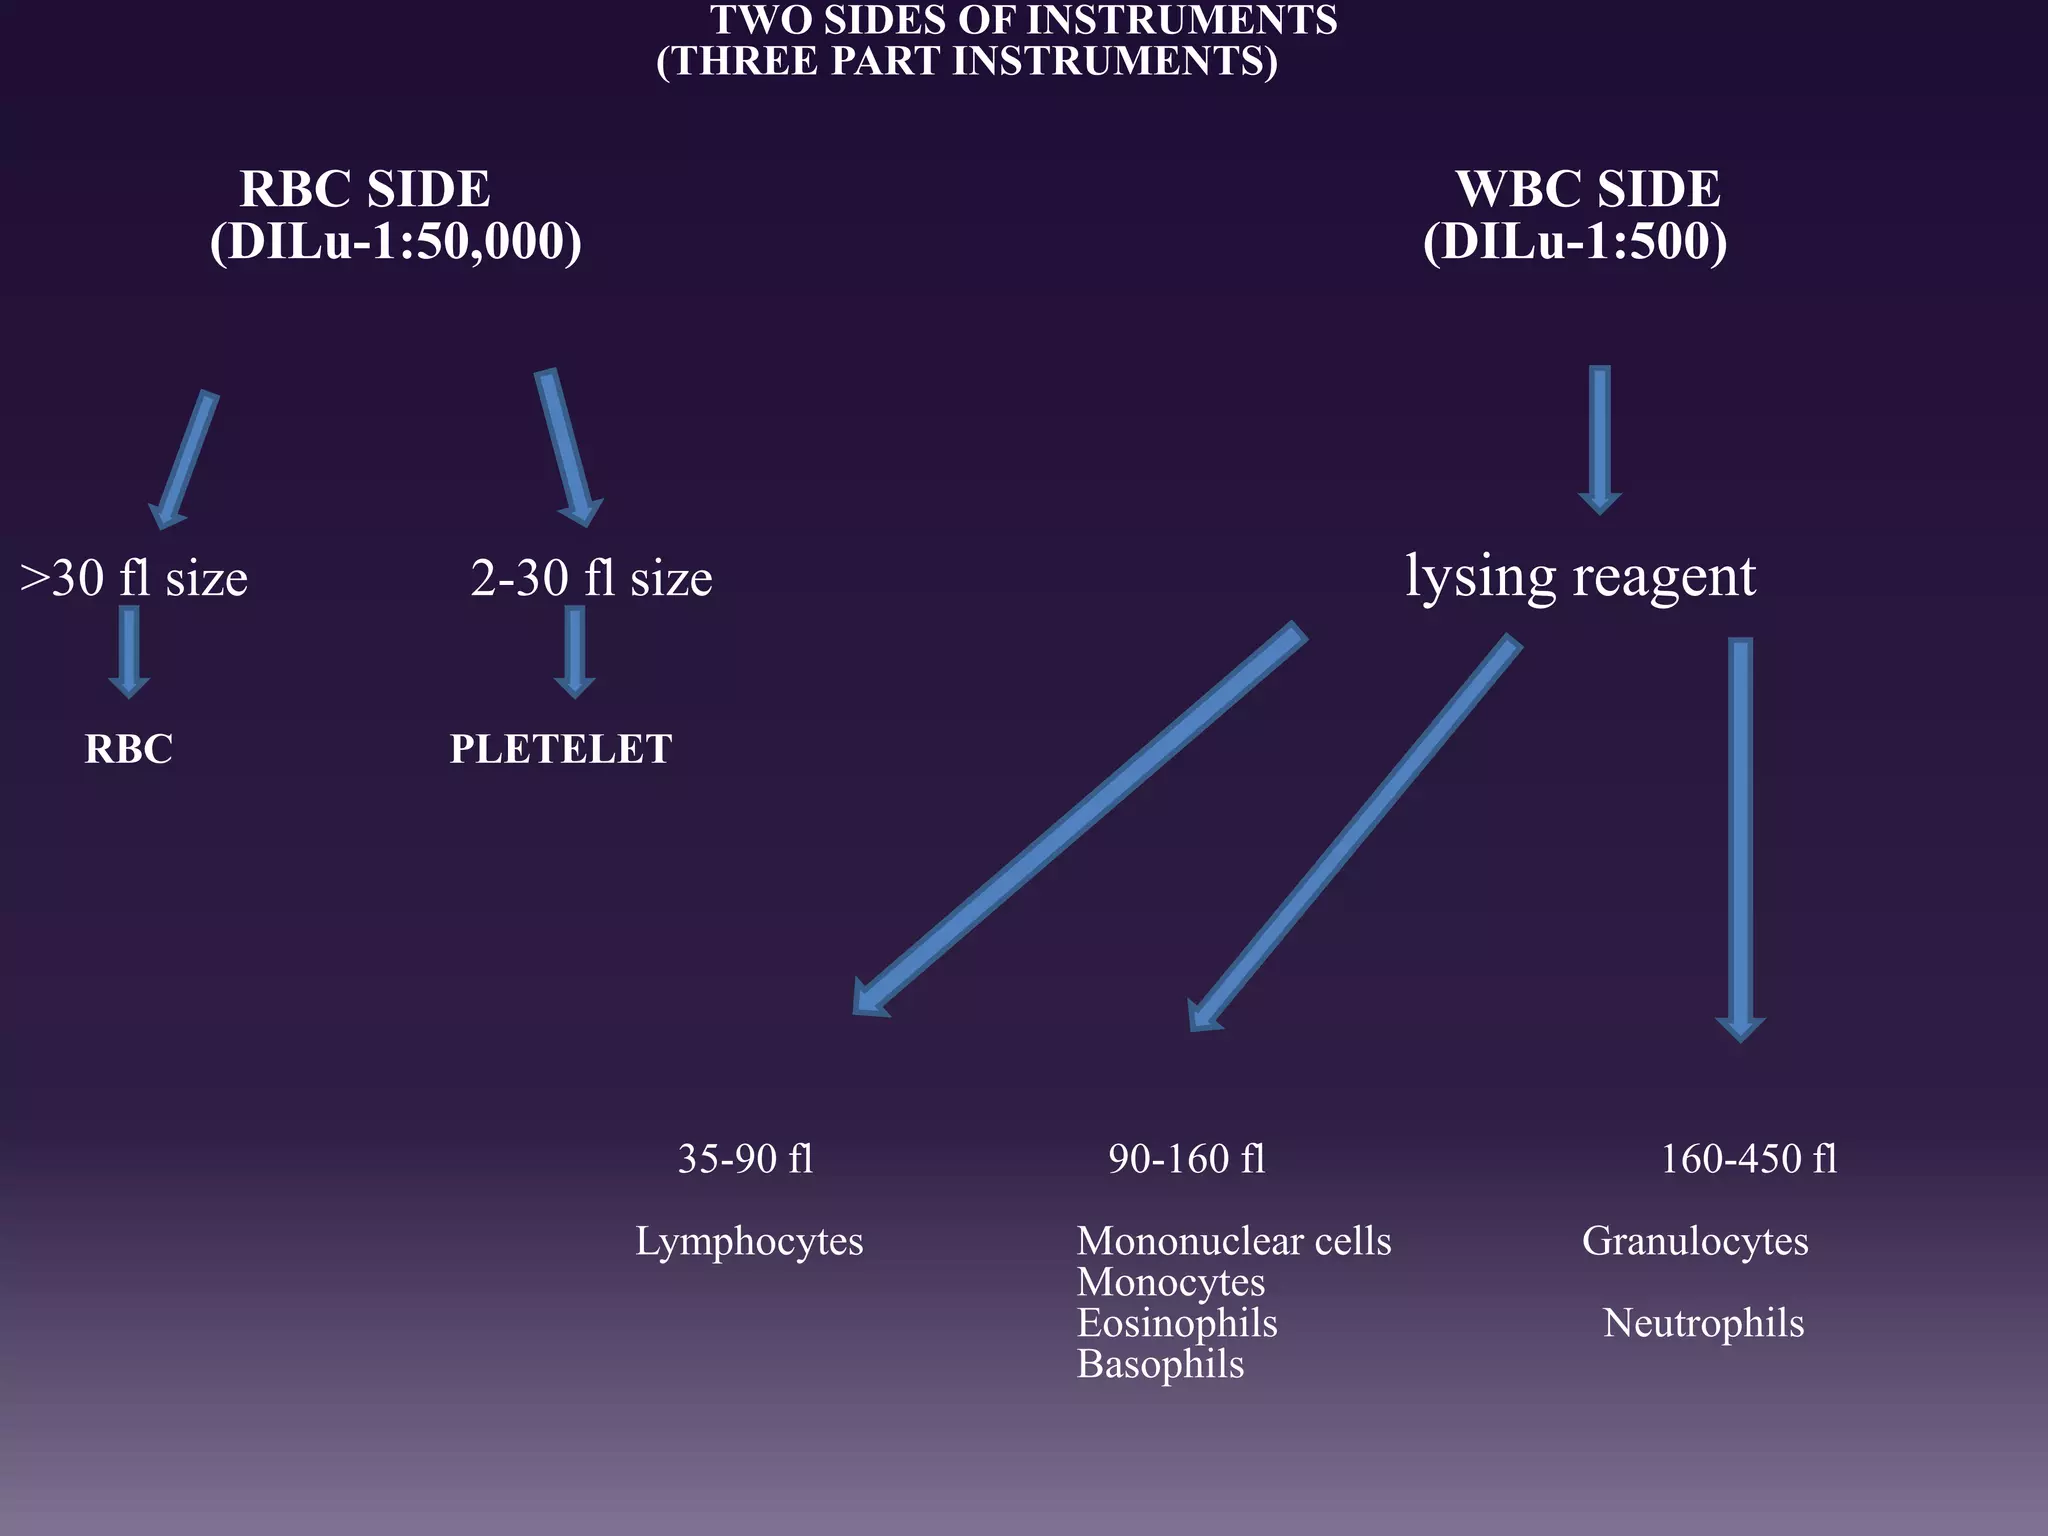
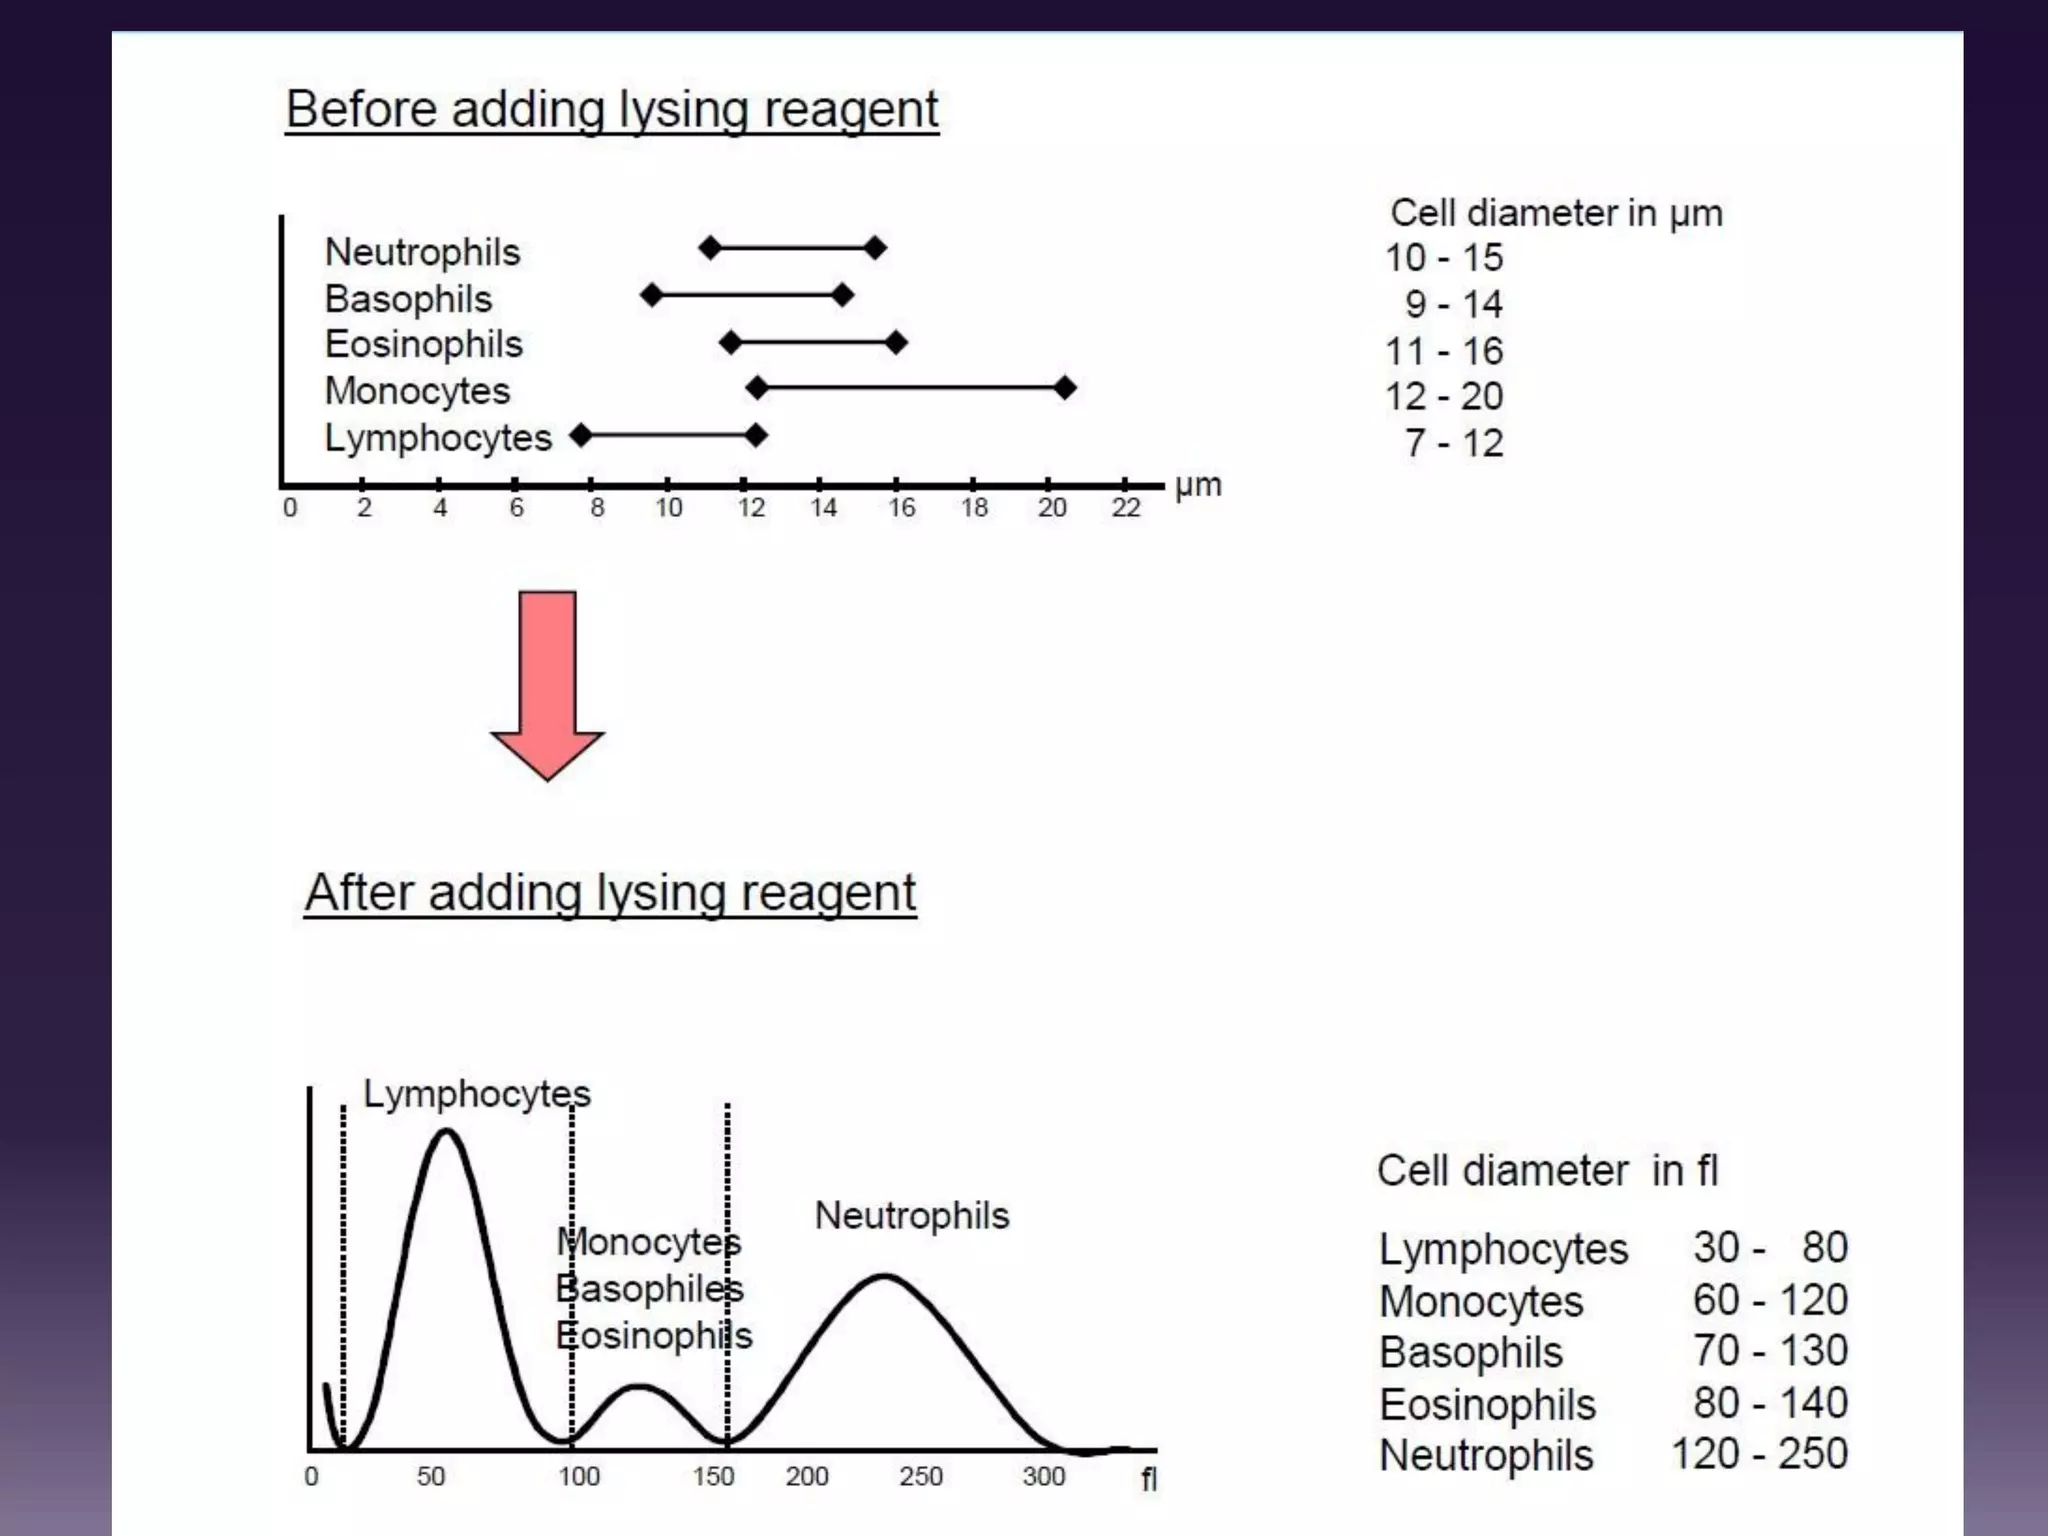
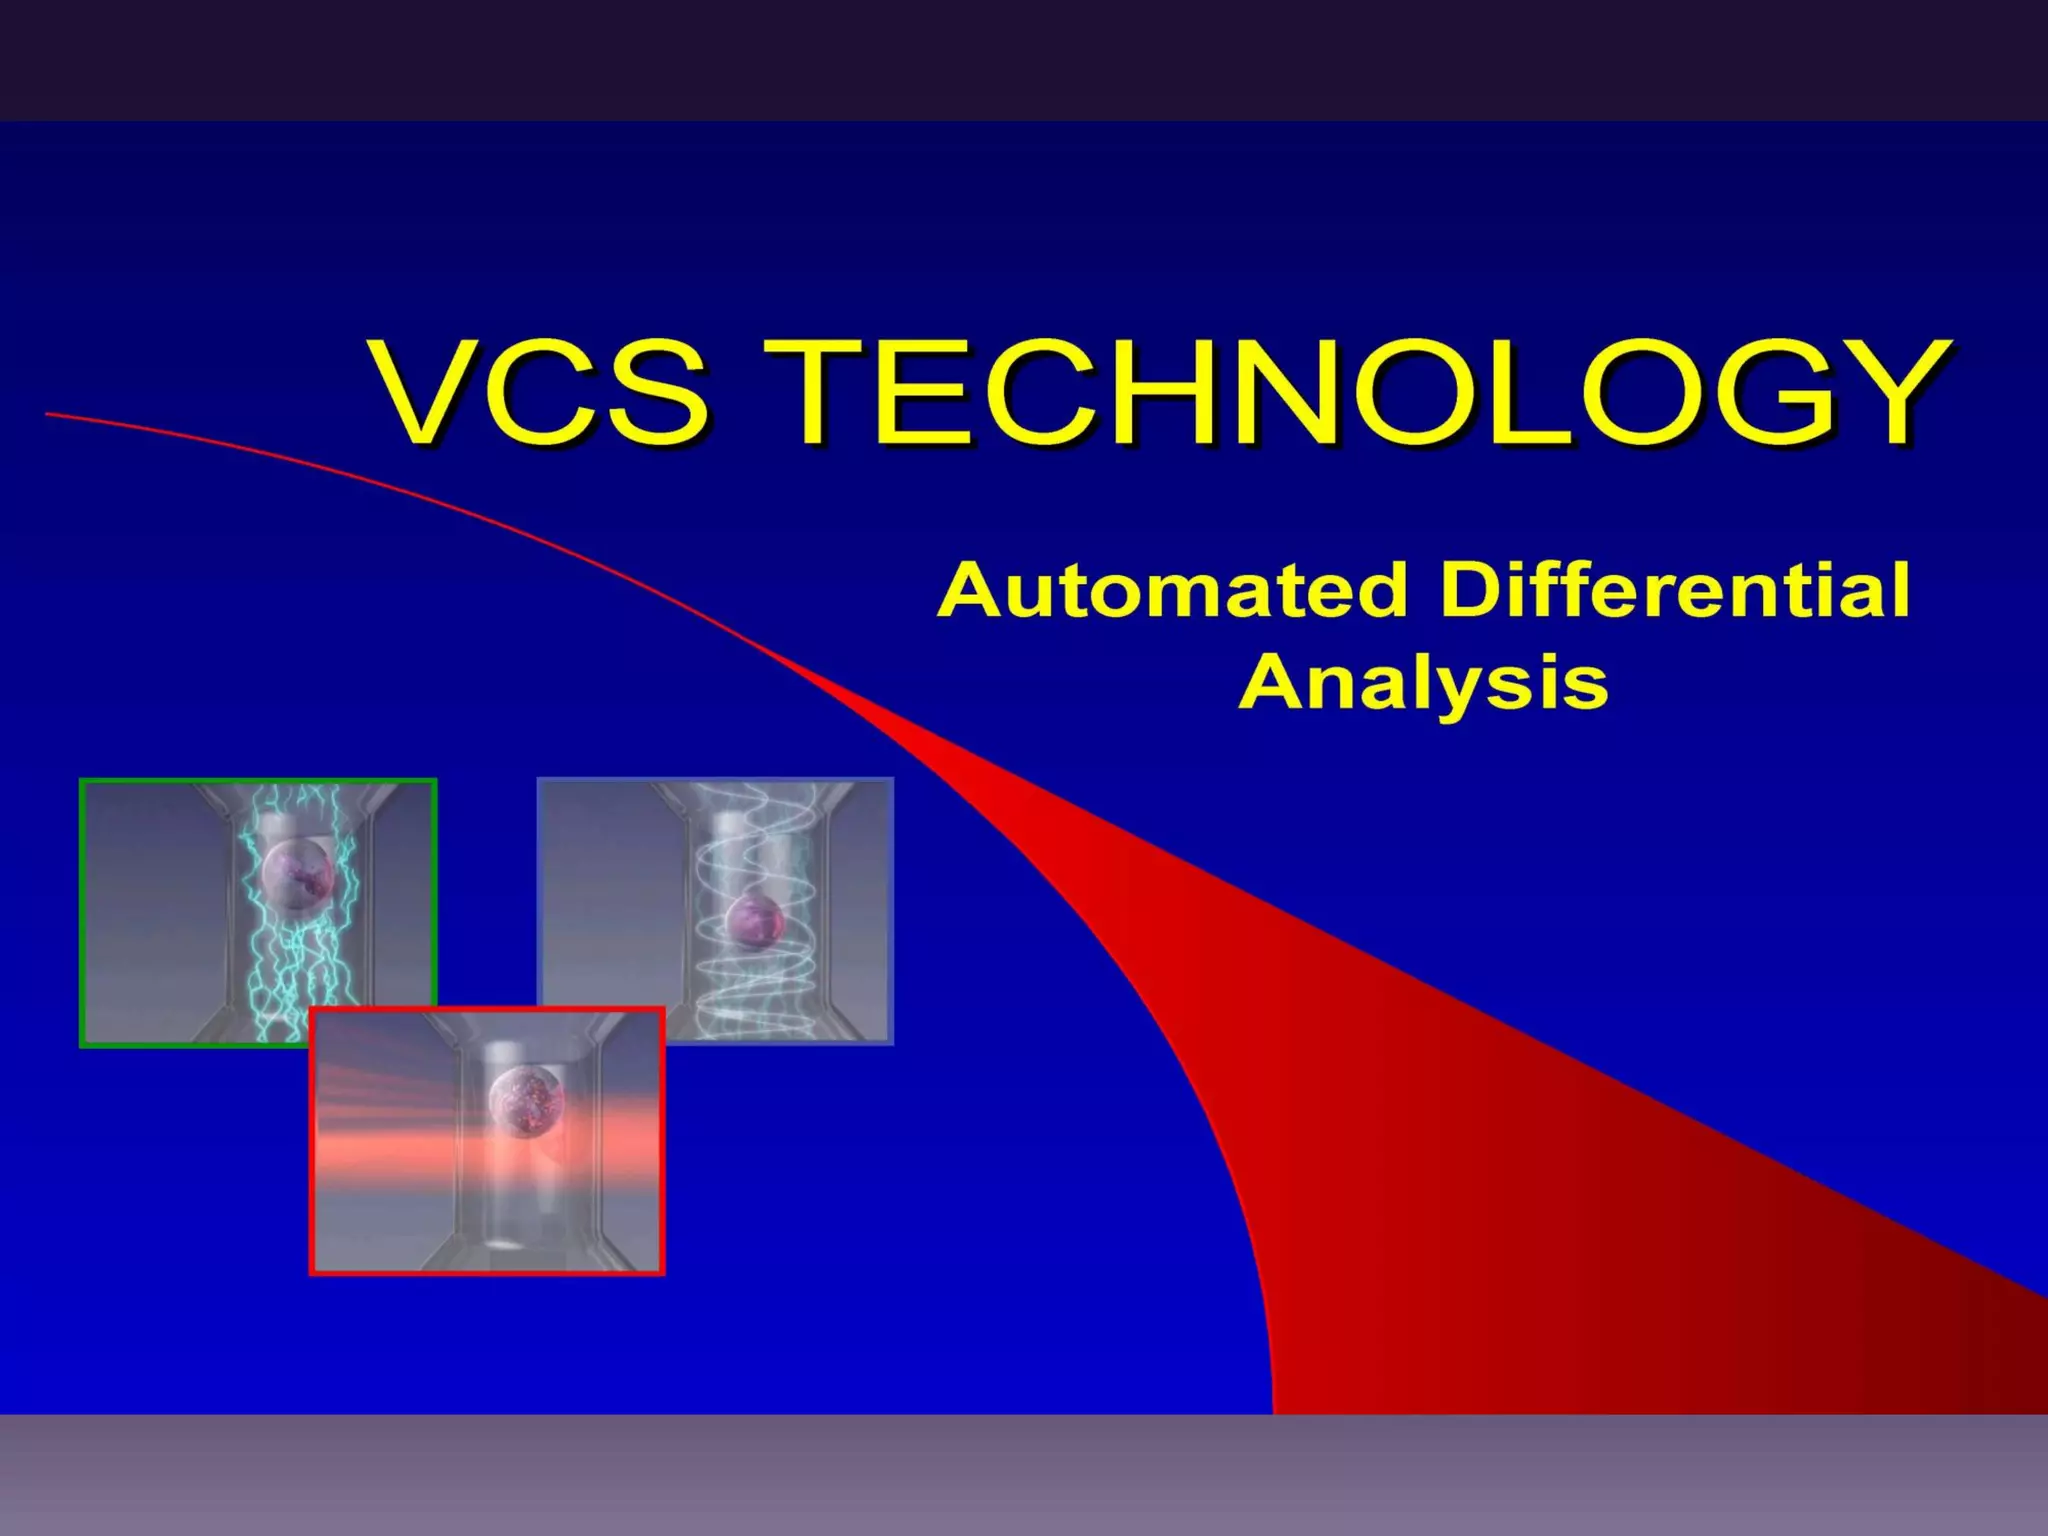
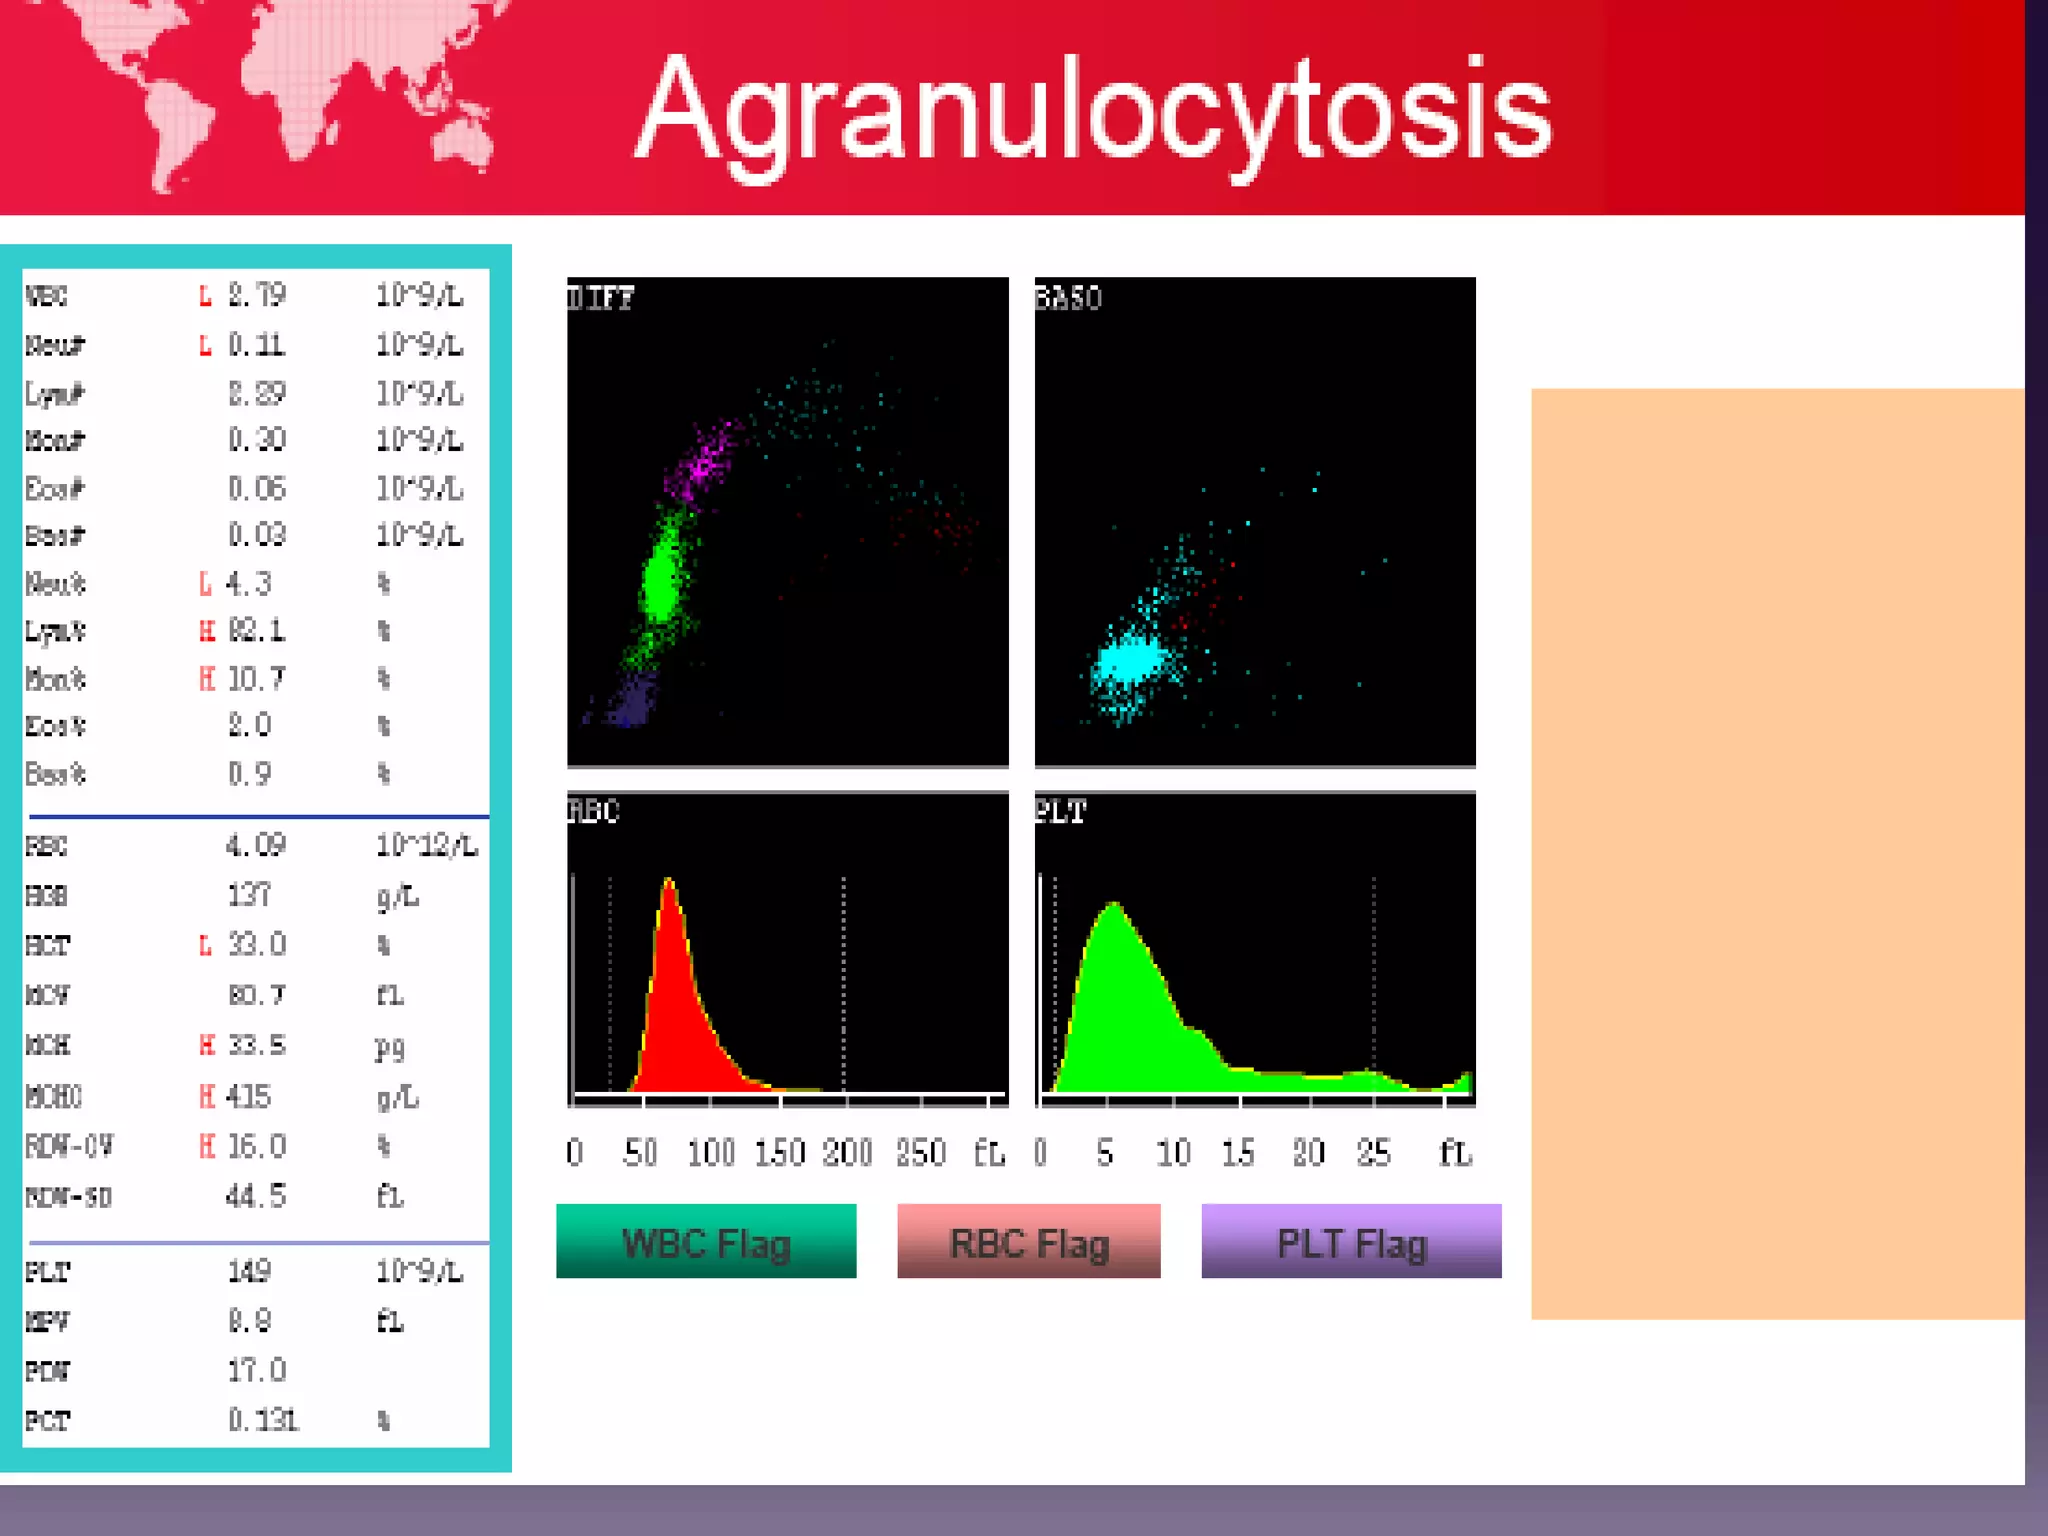
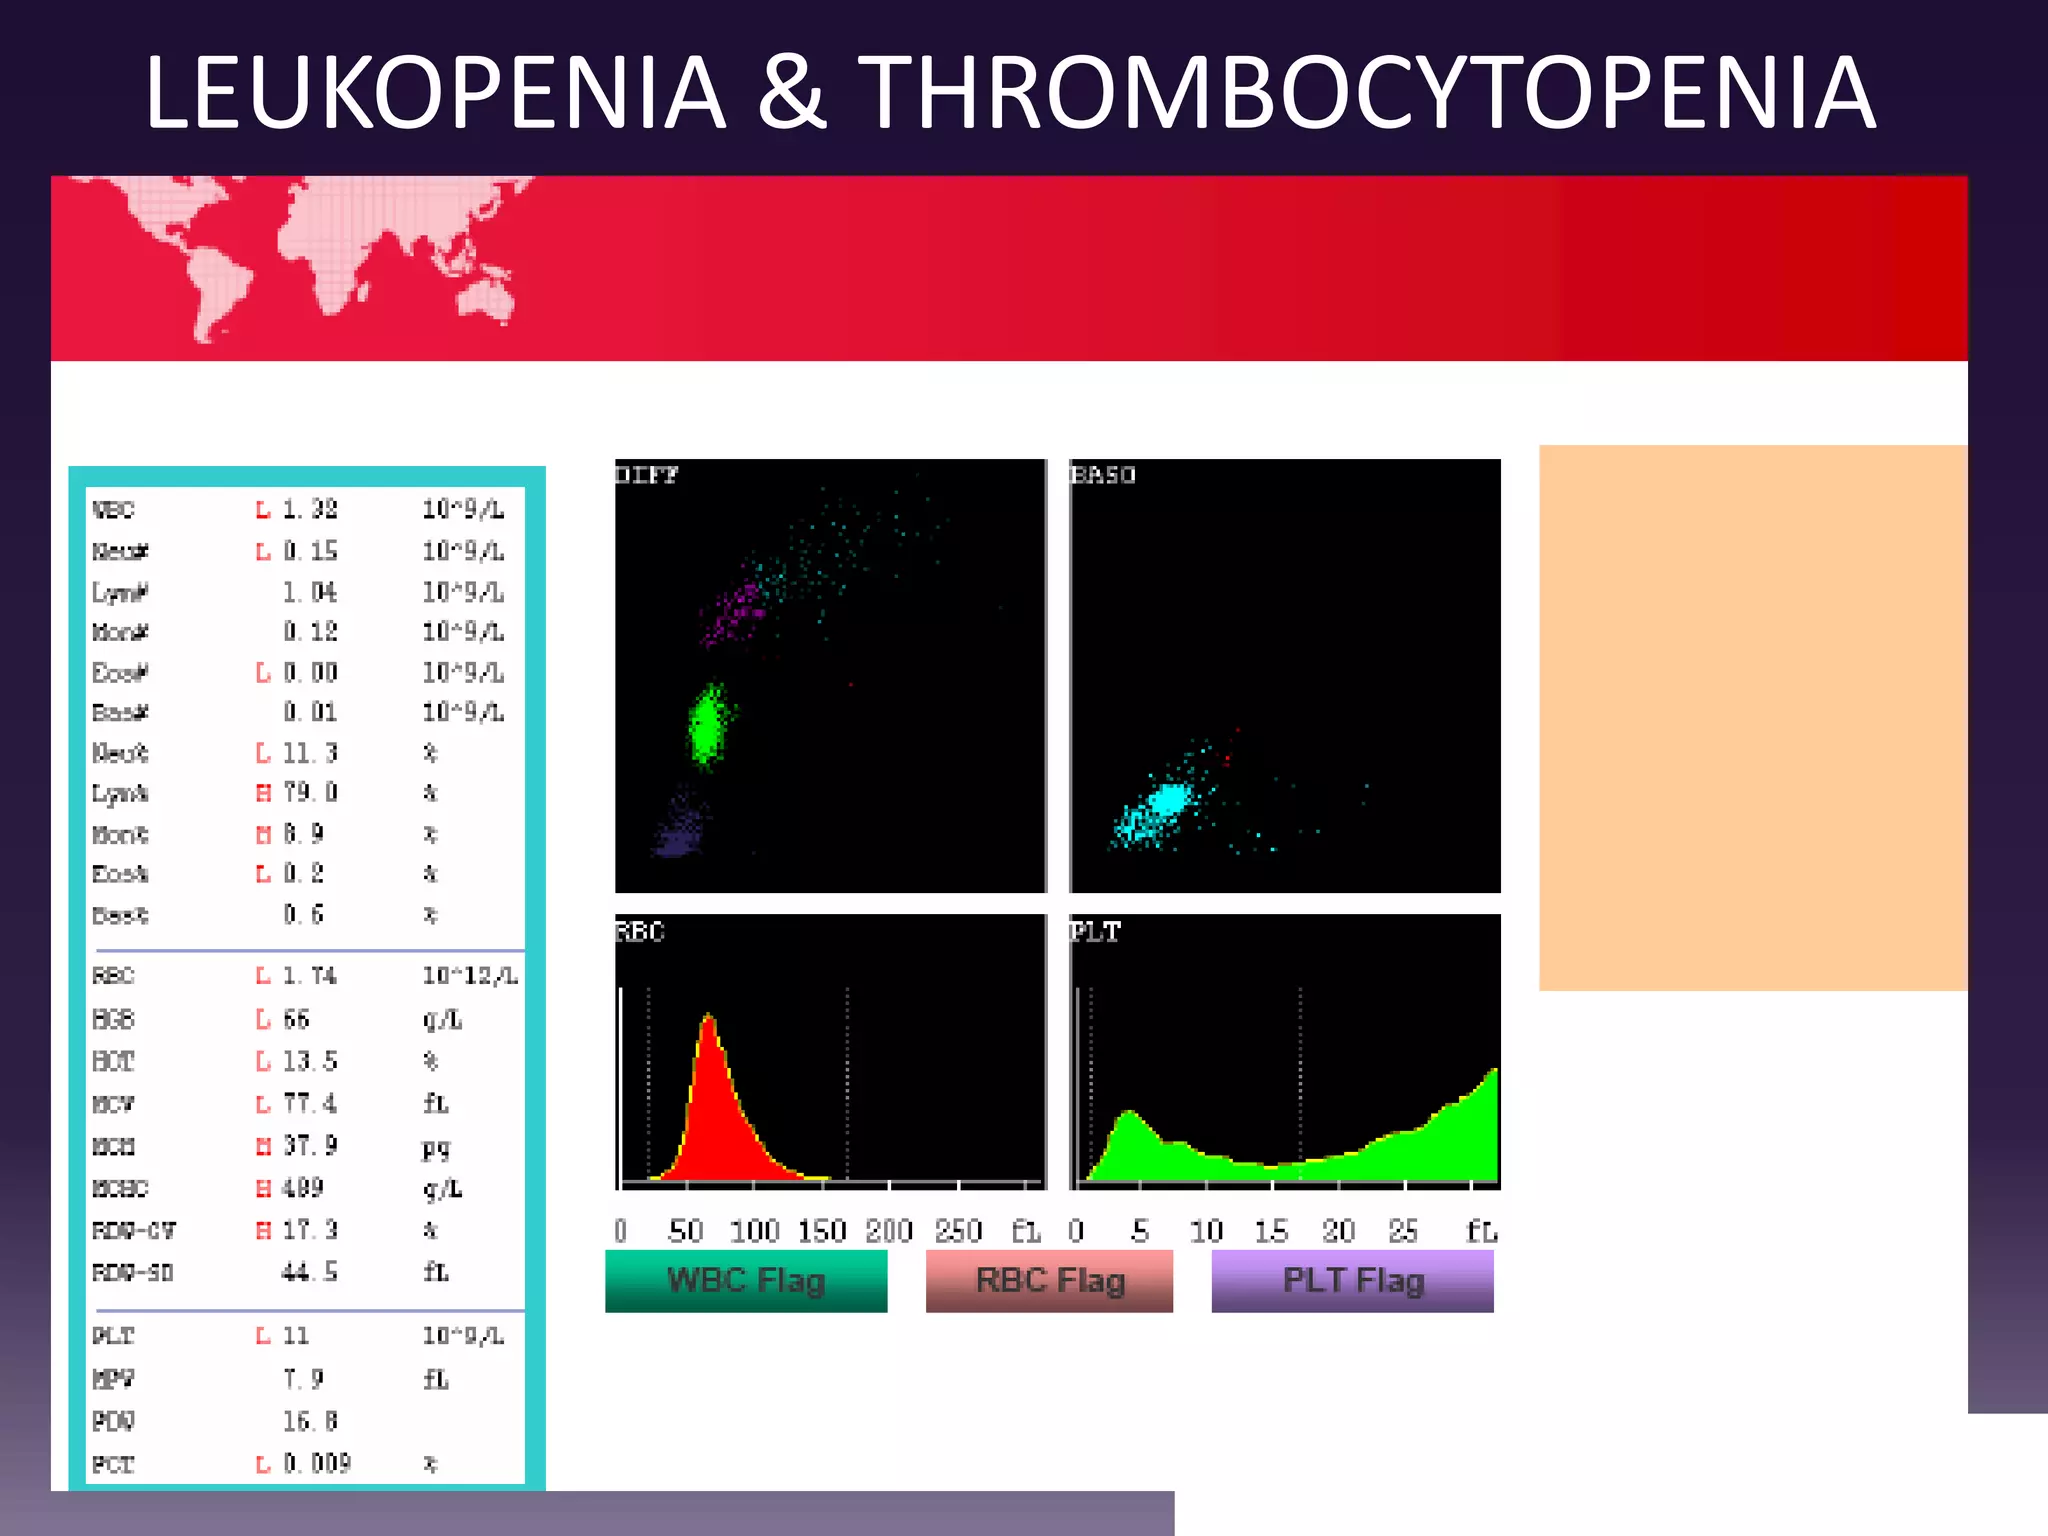


1. The document discusses the principles and techniques of automated complete blood count (CBC) analysis using automated hematology analyzers. It covers topics like the Coulter principle, optical scatter techniques, histogram analysis and differentiatial counting. 2. Advantages of automated CBC include speed, accuracy, ability to perform multiple tests on a single platform, and reduced labor requirements. Disadvantages include inability to assess red cell morphology and potential errors from interfering factors. 3. Automated analyzers can differentiate white blood cells into three, five or seven parts depending on the instrument. Histograms are analyzed to determine parameters like red and white blood cell counts, hemoglobin, hematocrit, and platelet indices.