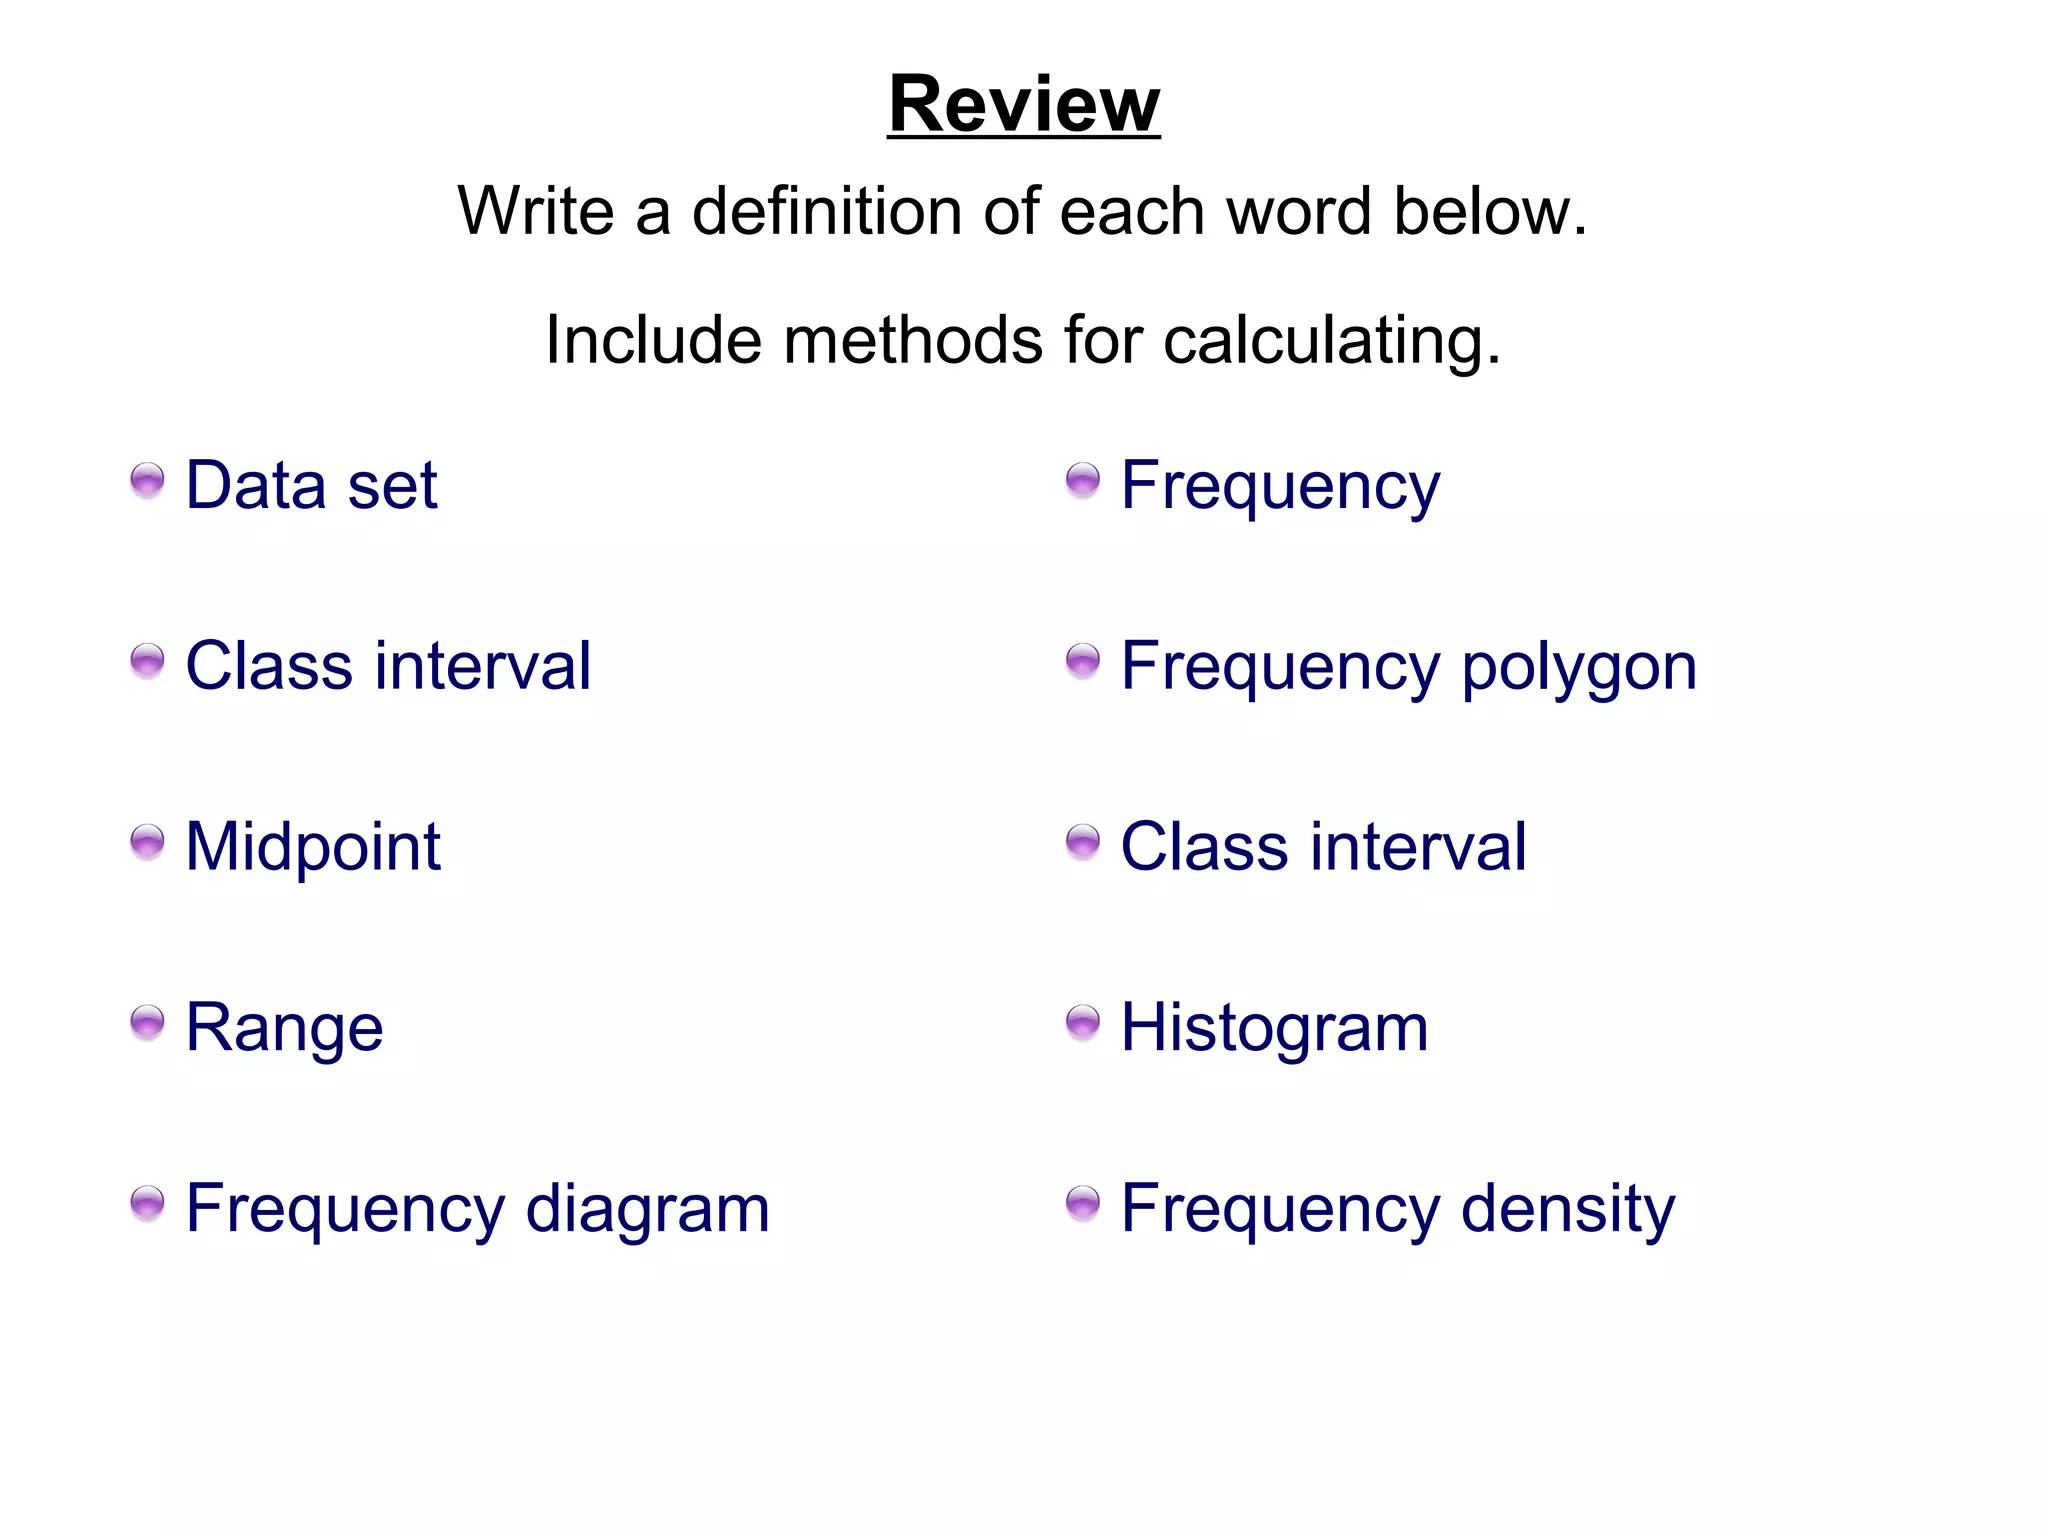
Here are definitions for the key terms related to histograms:
- Data set: A collection of data values.
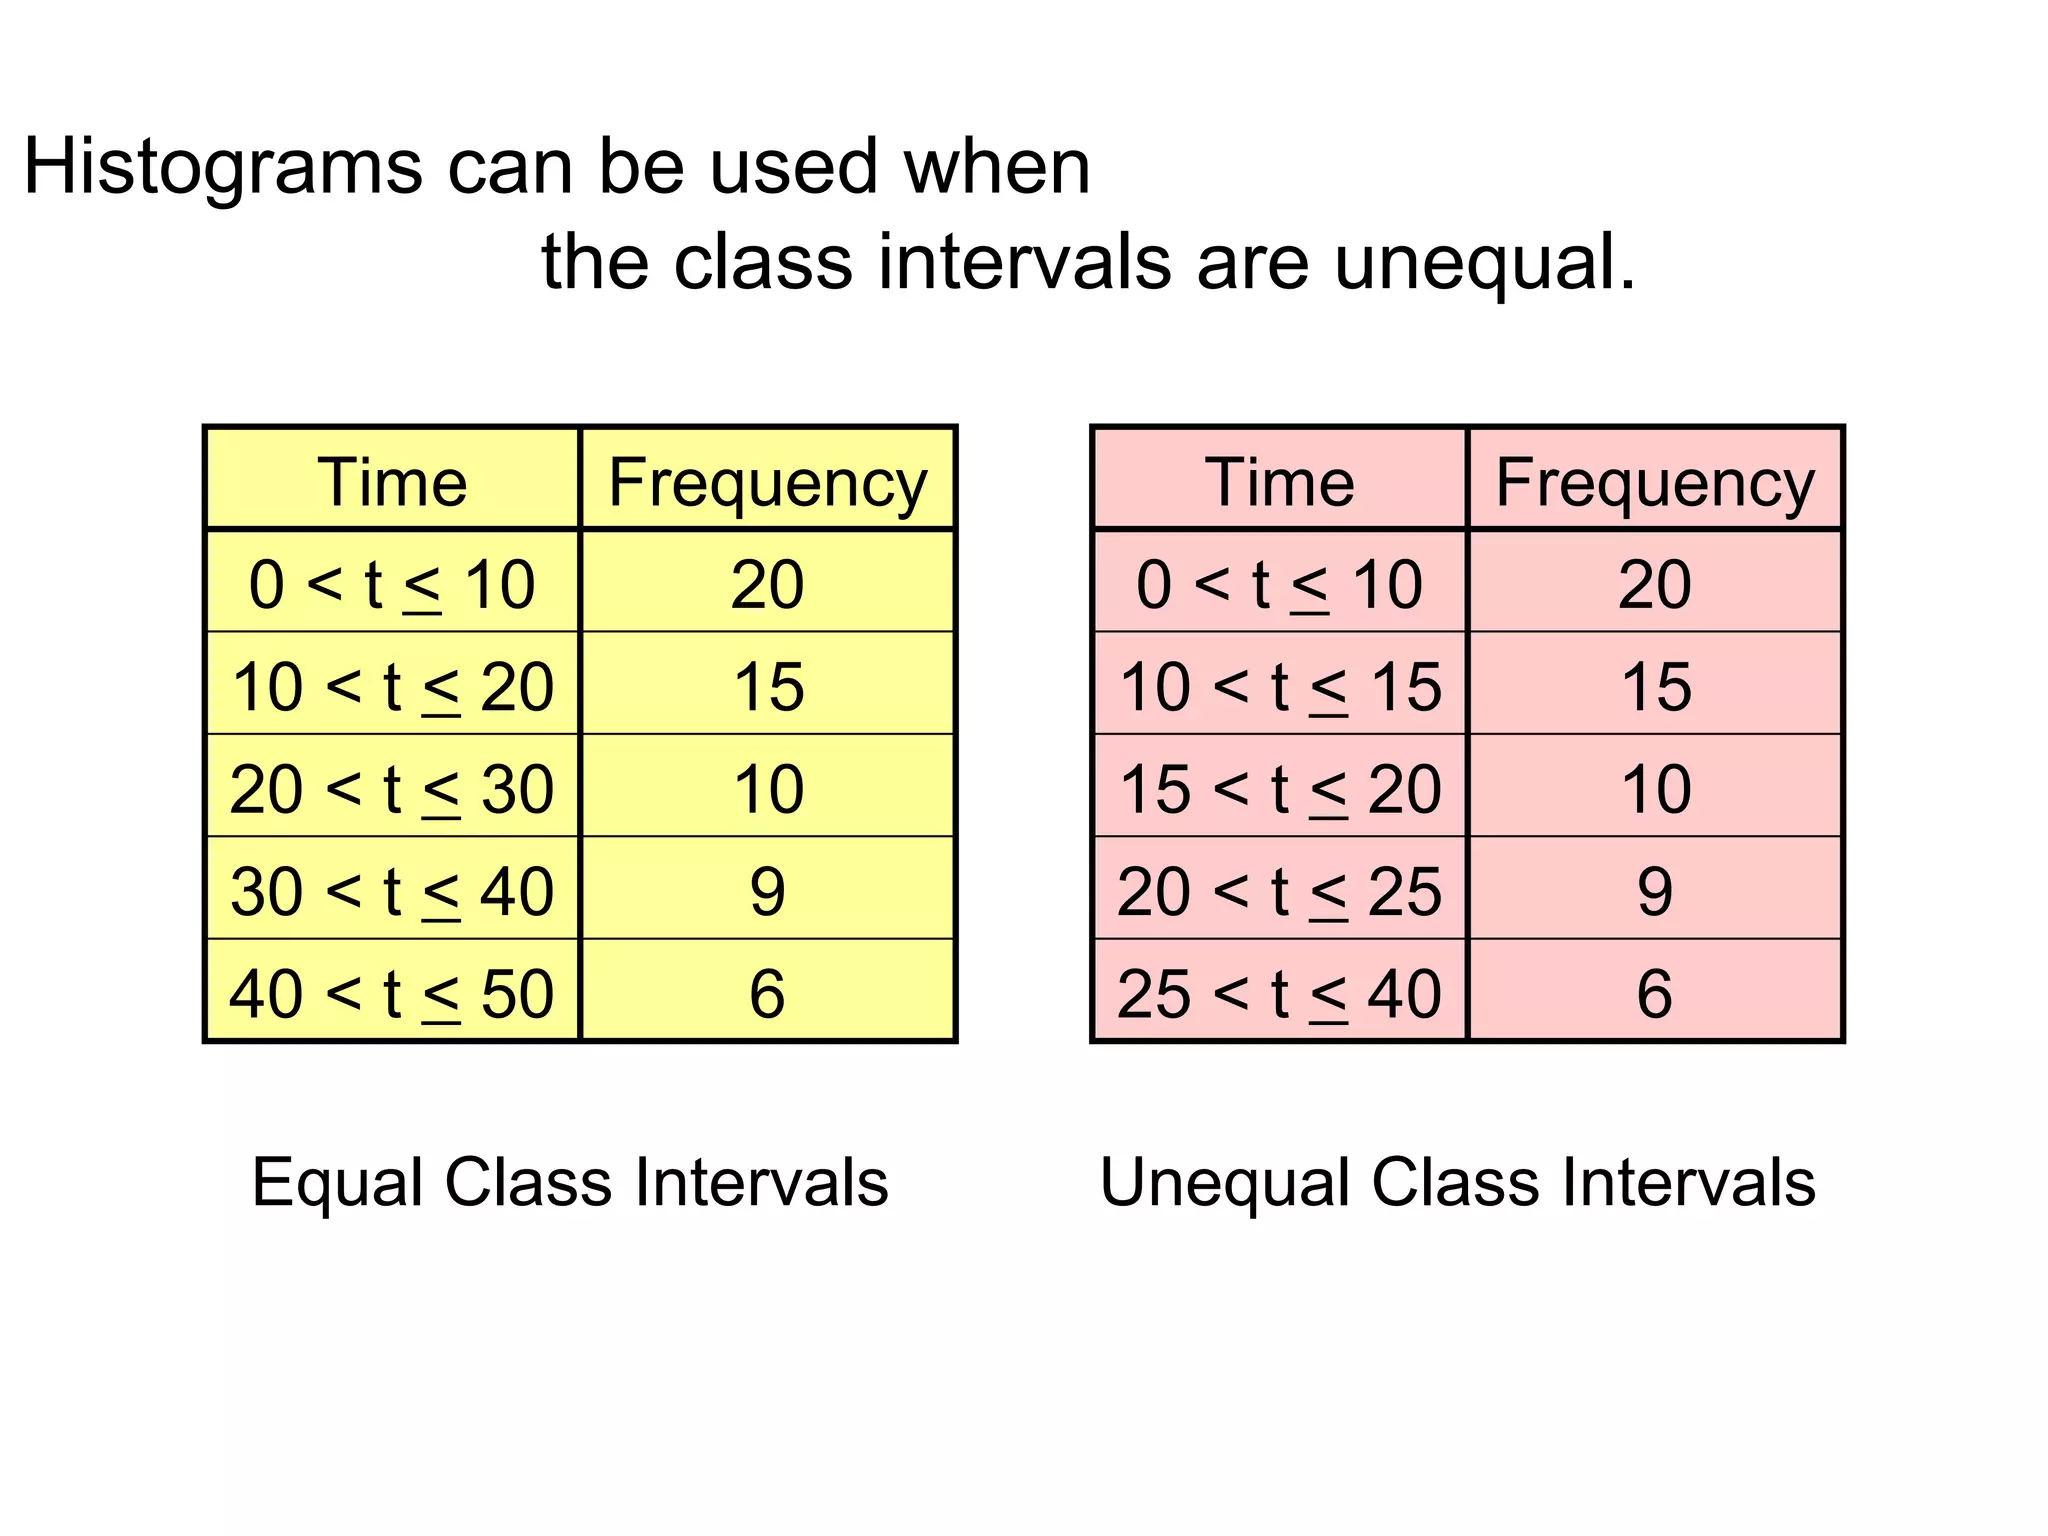
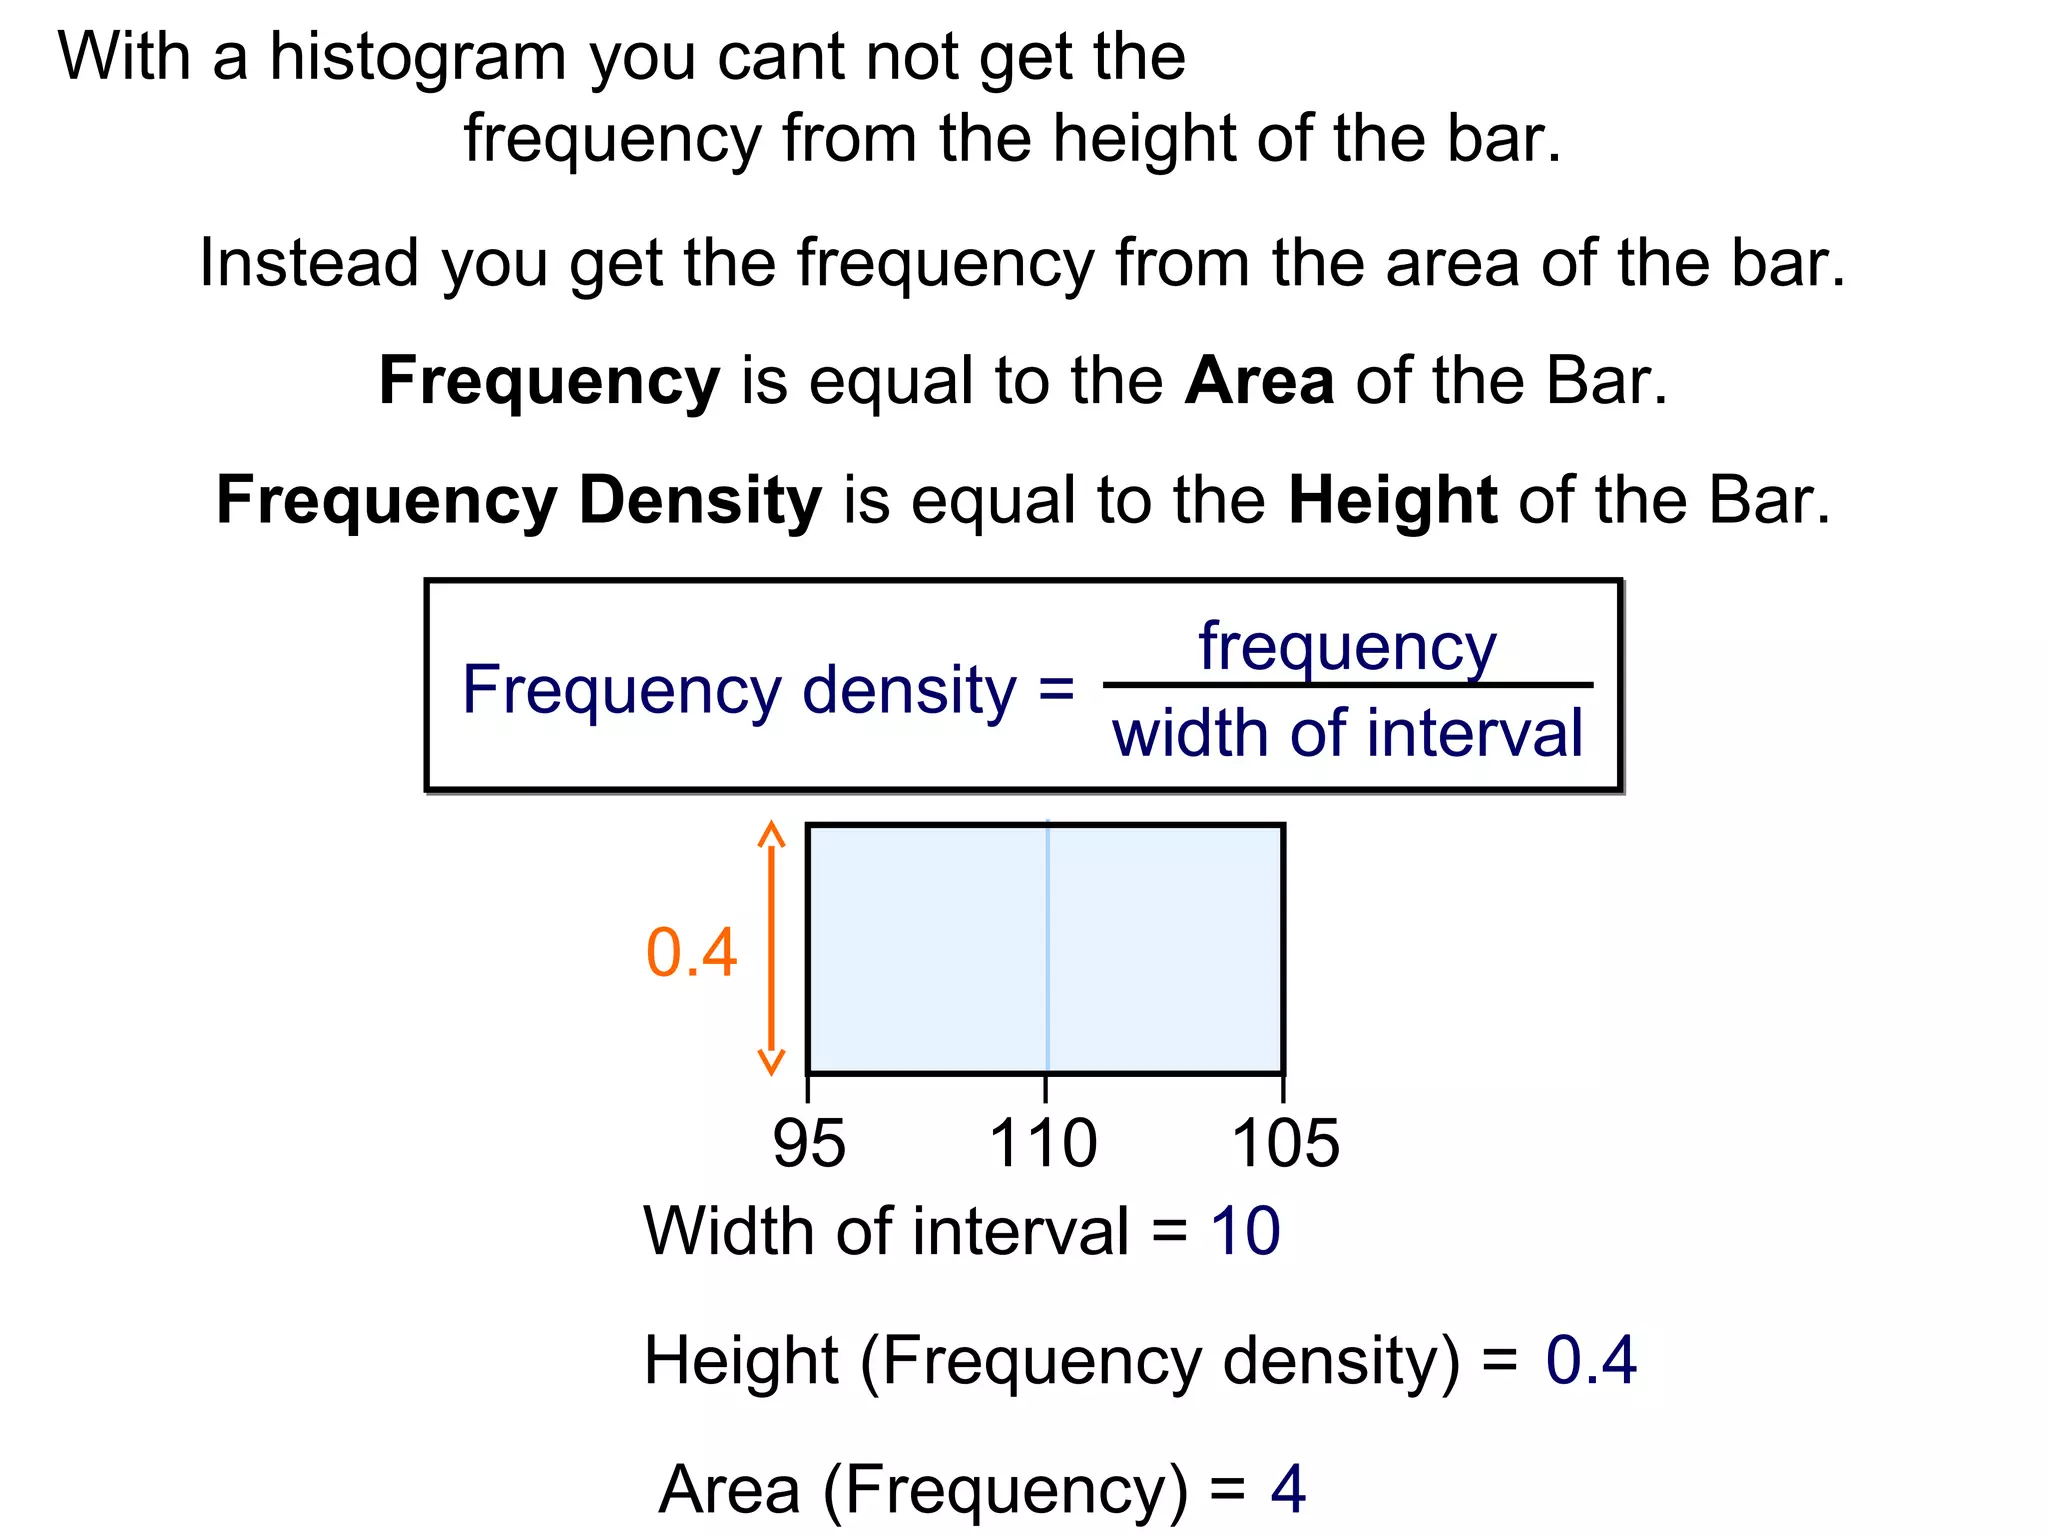
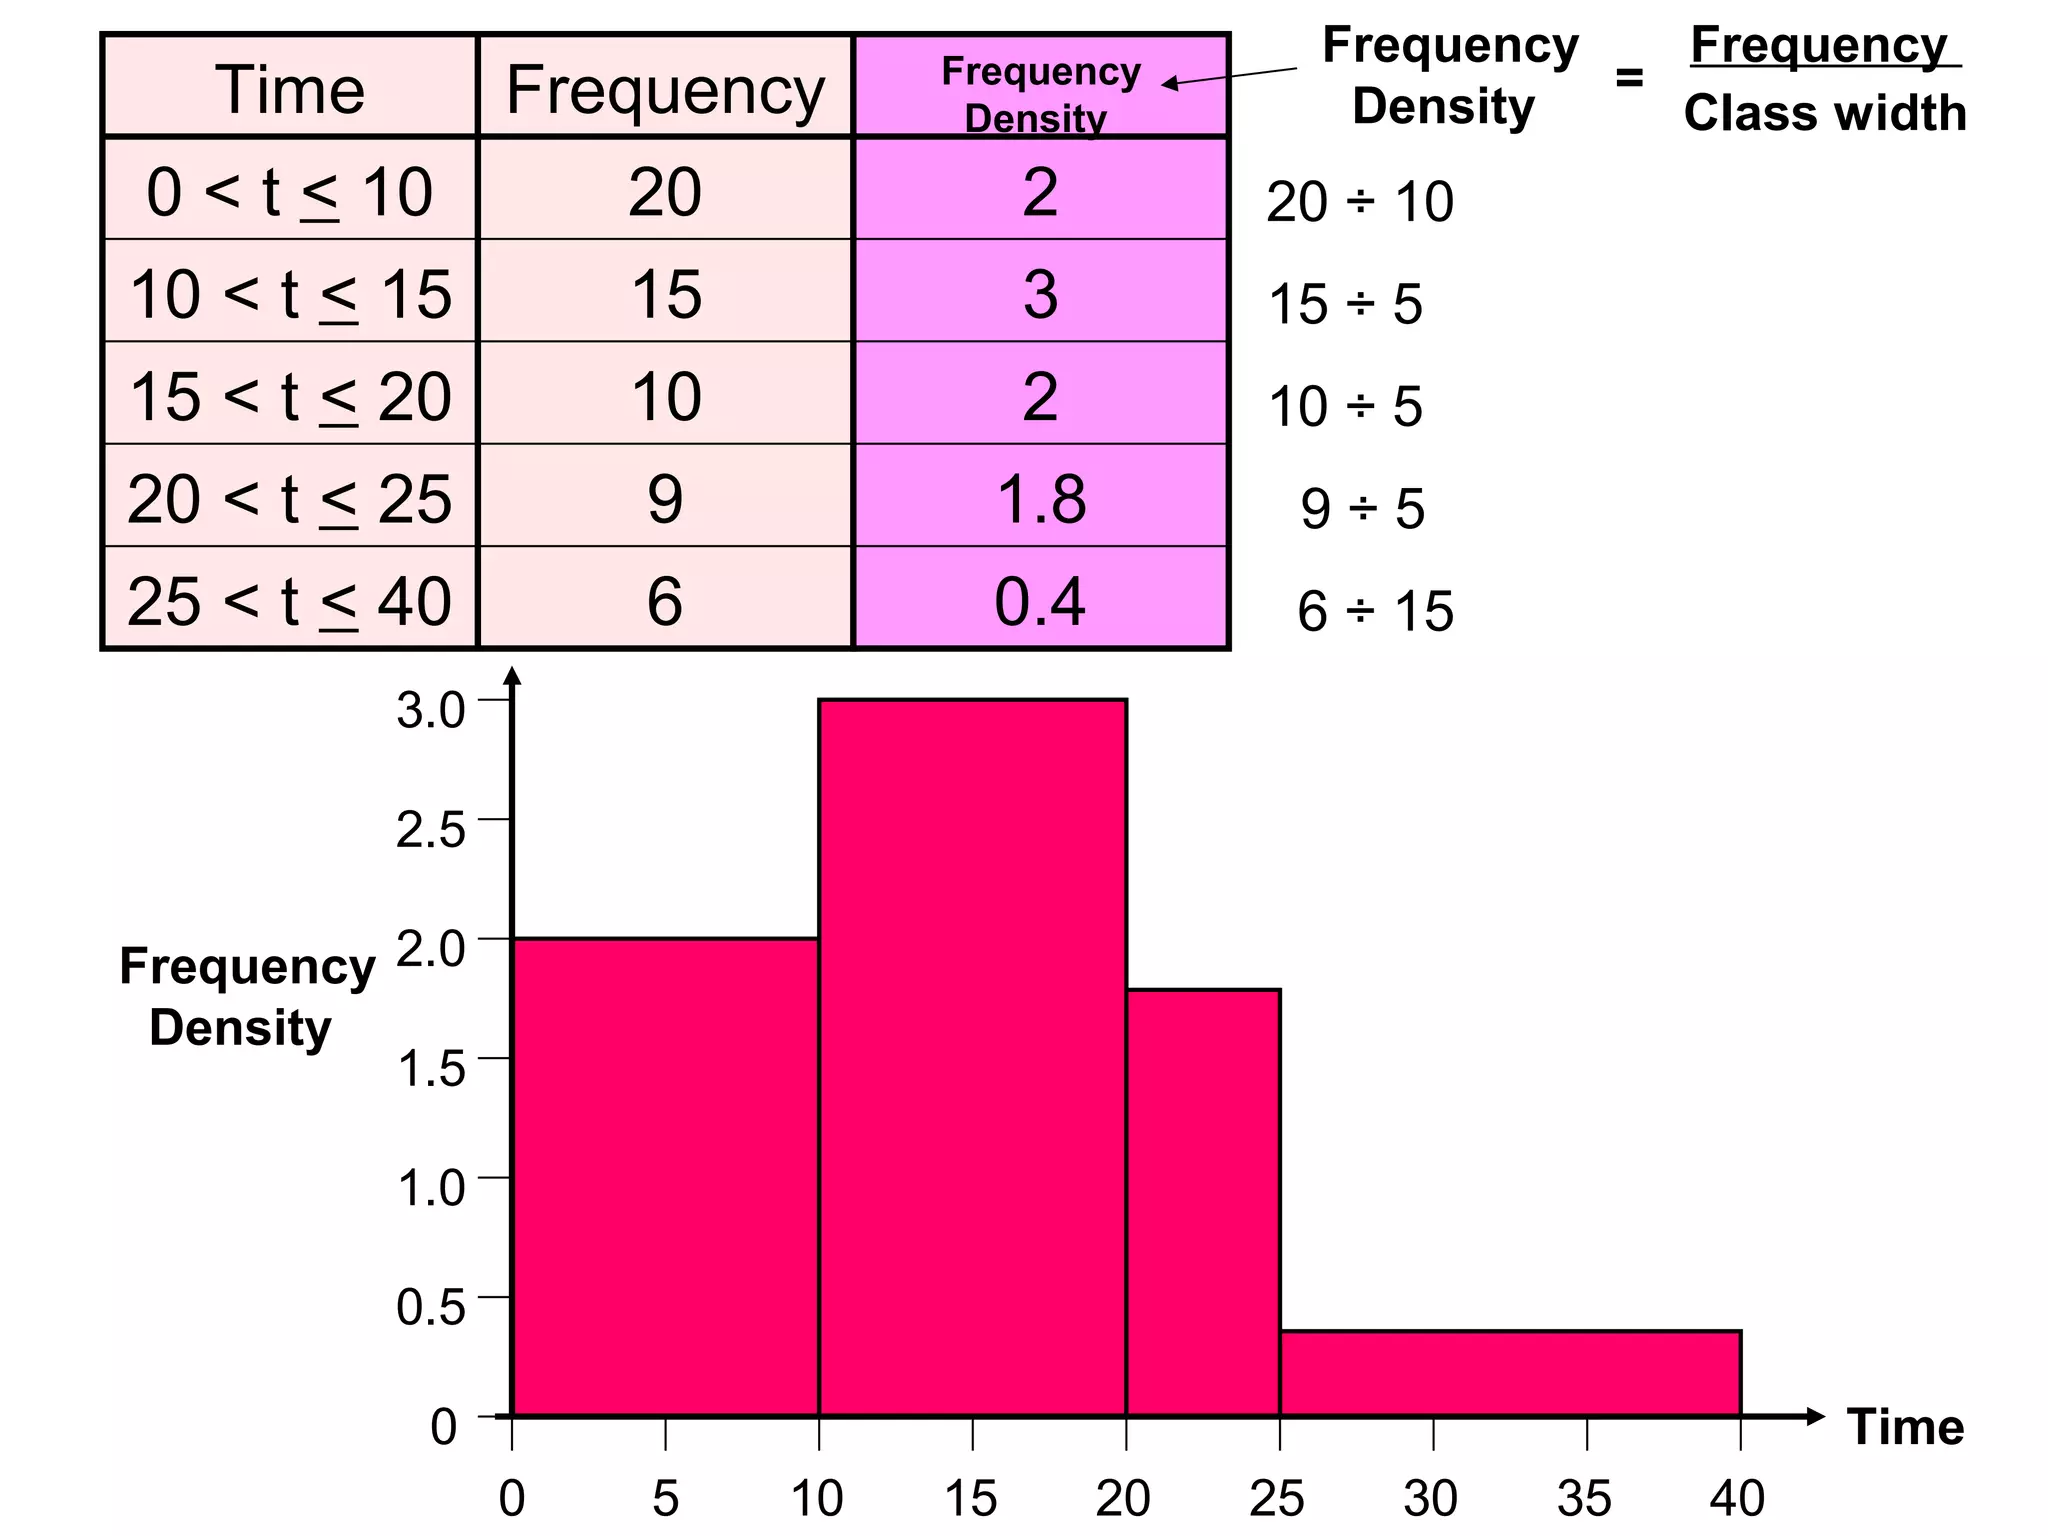
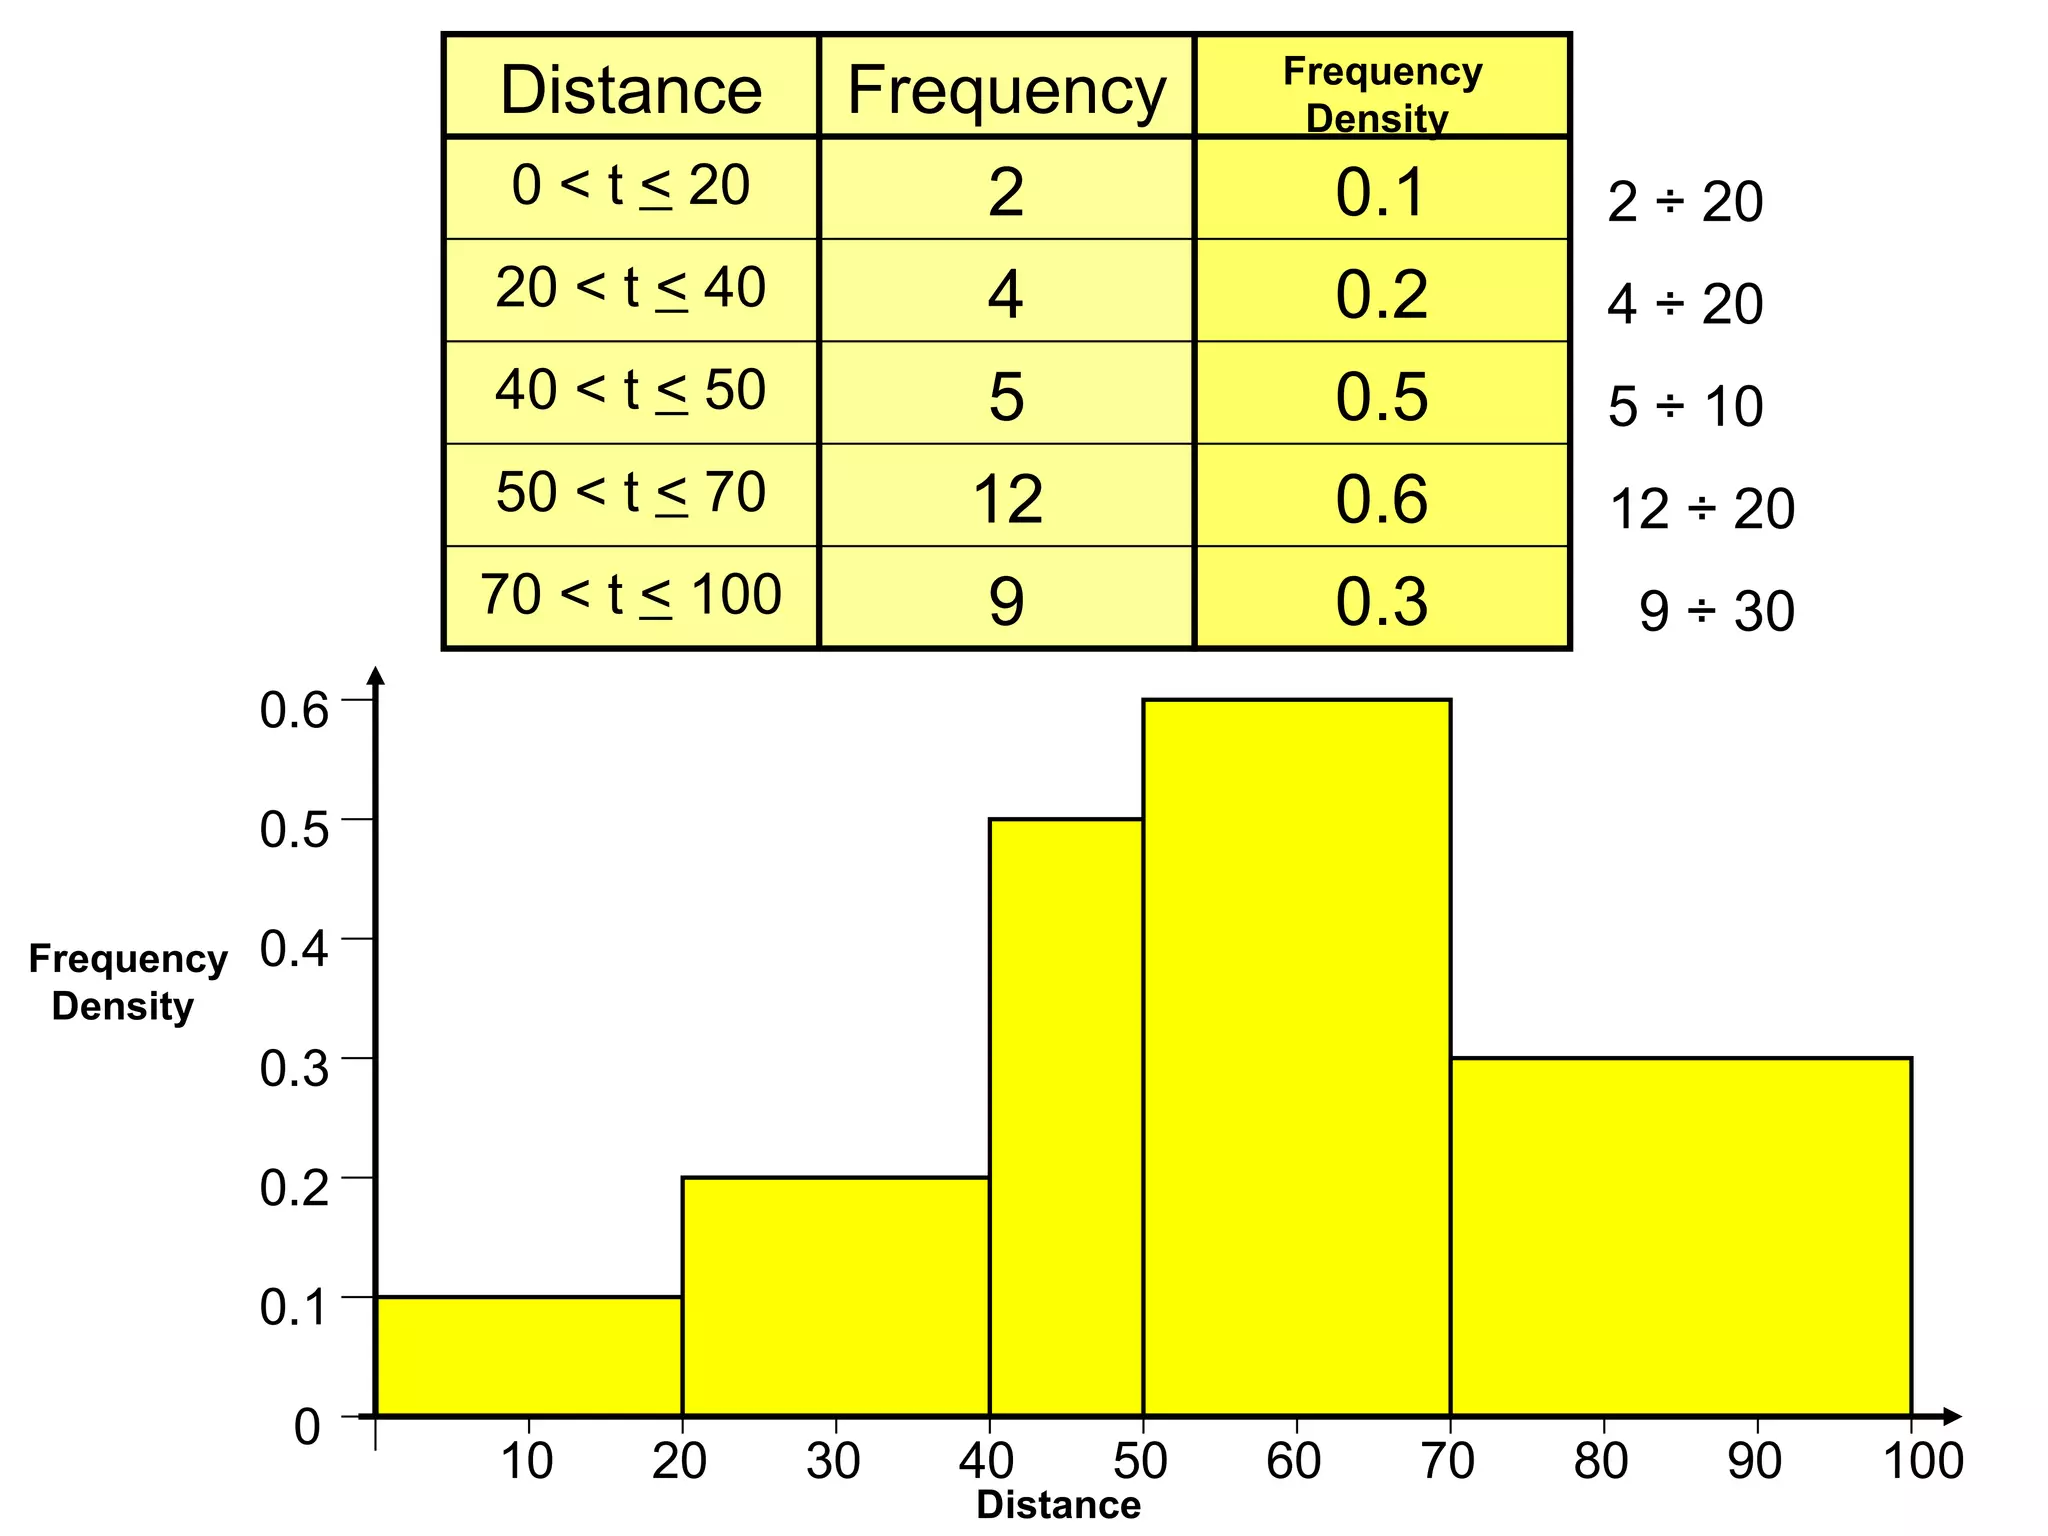
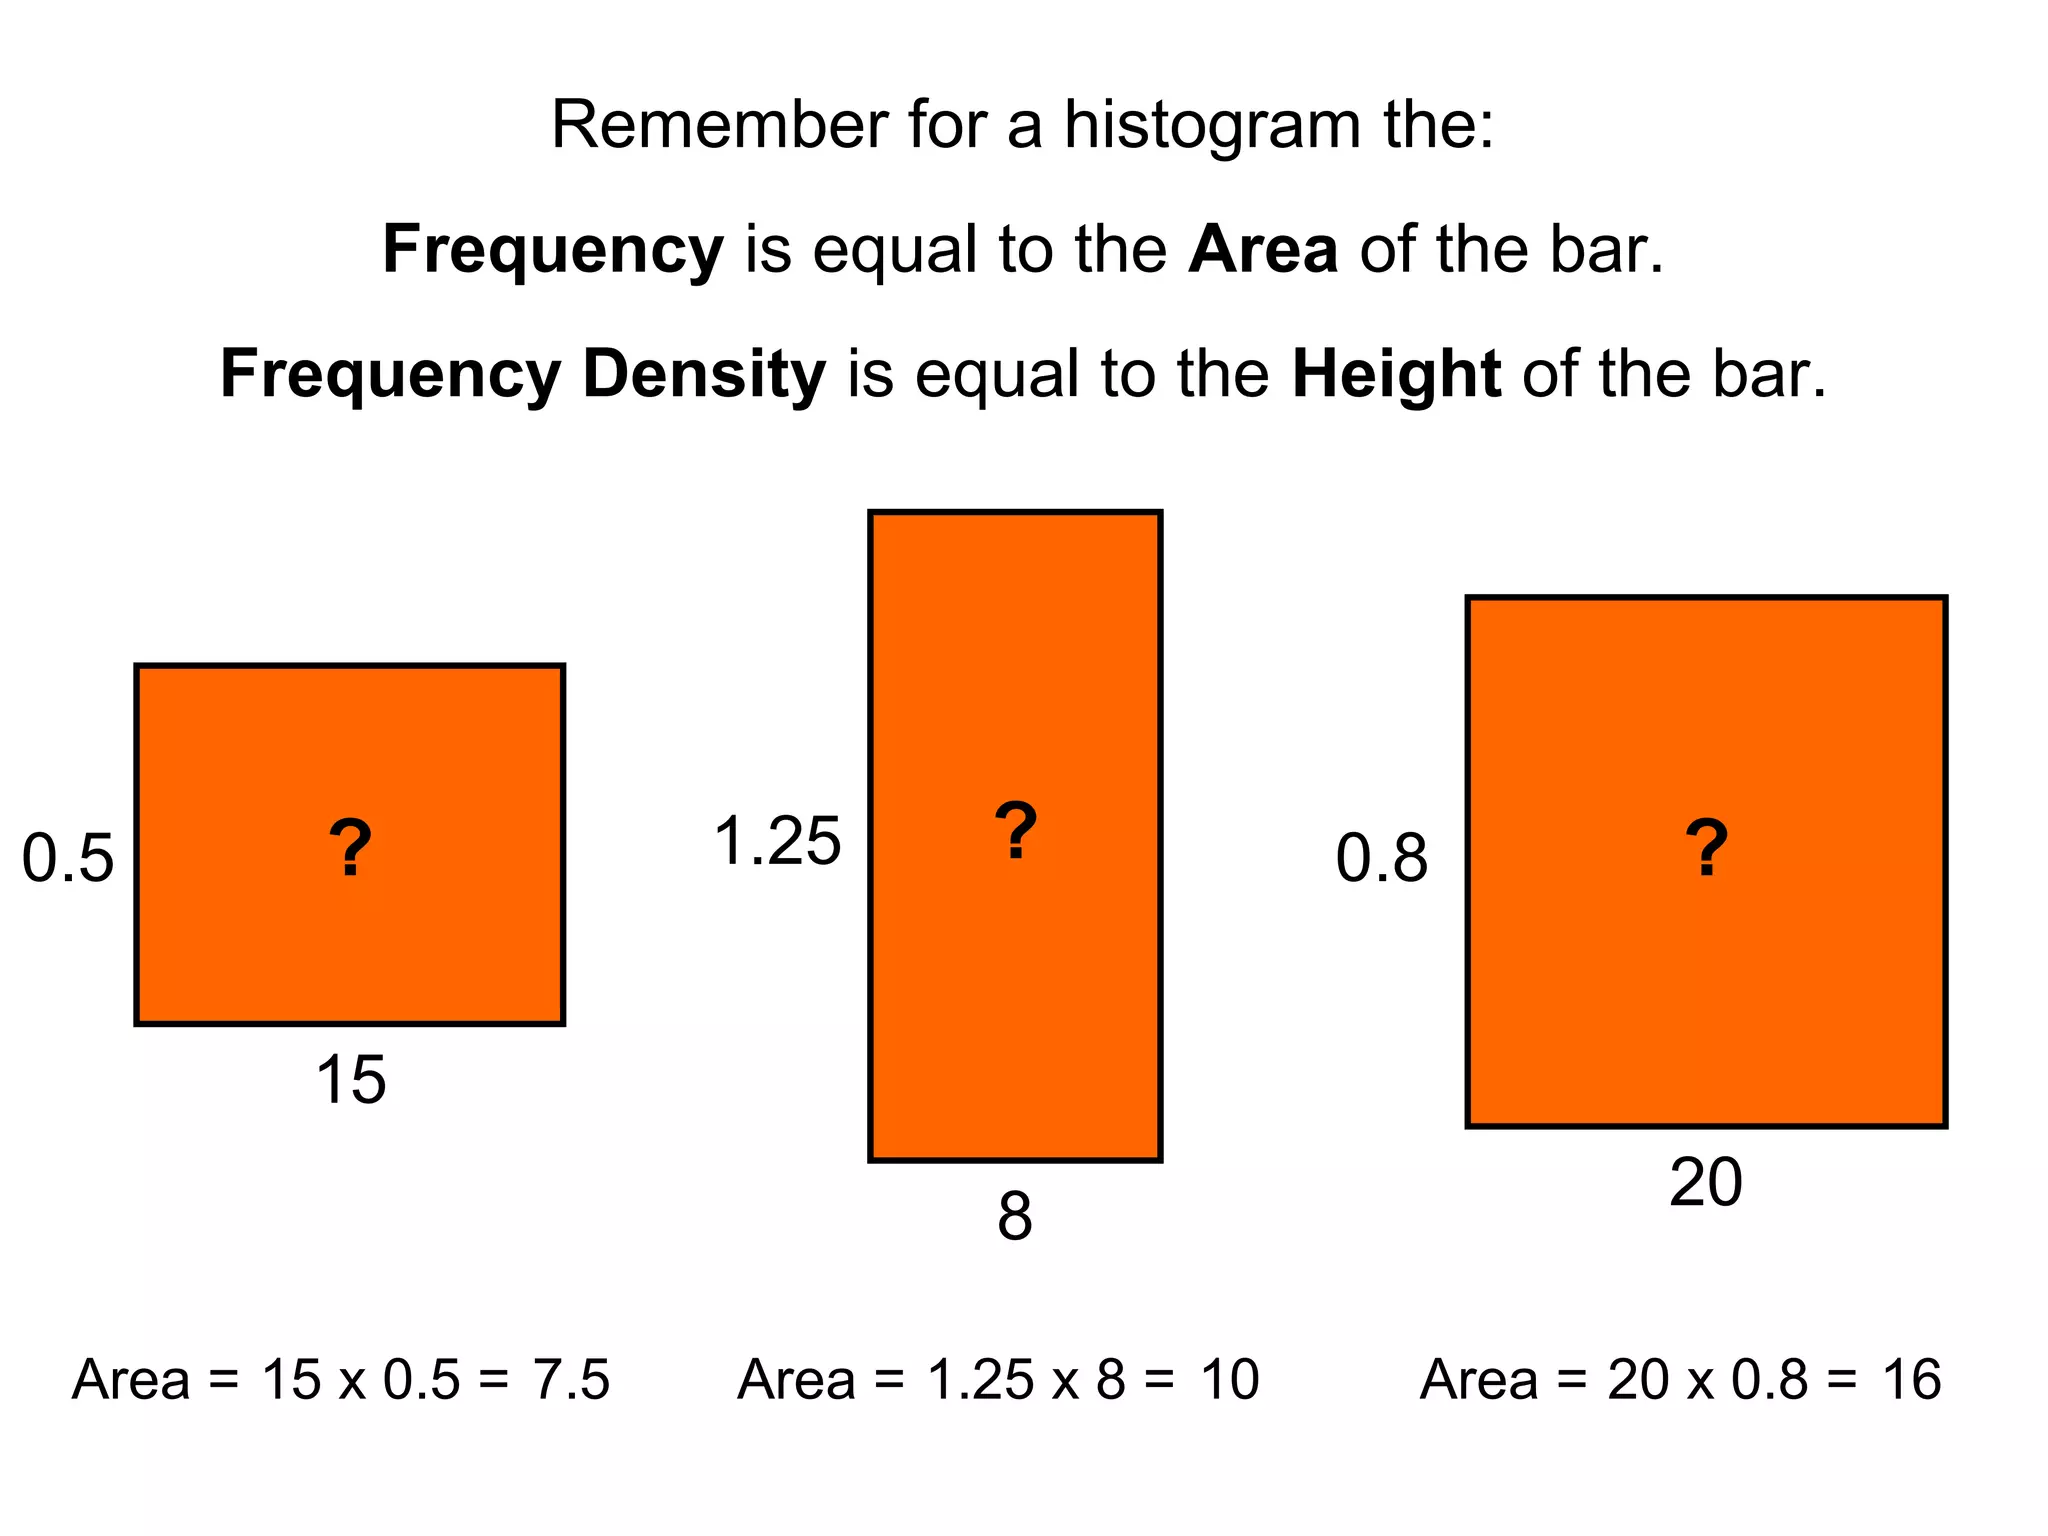
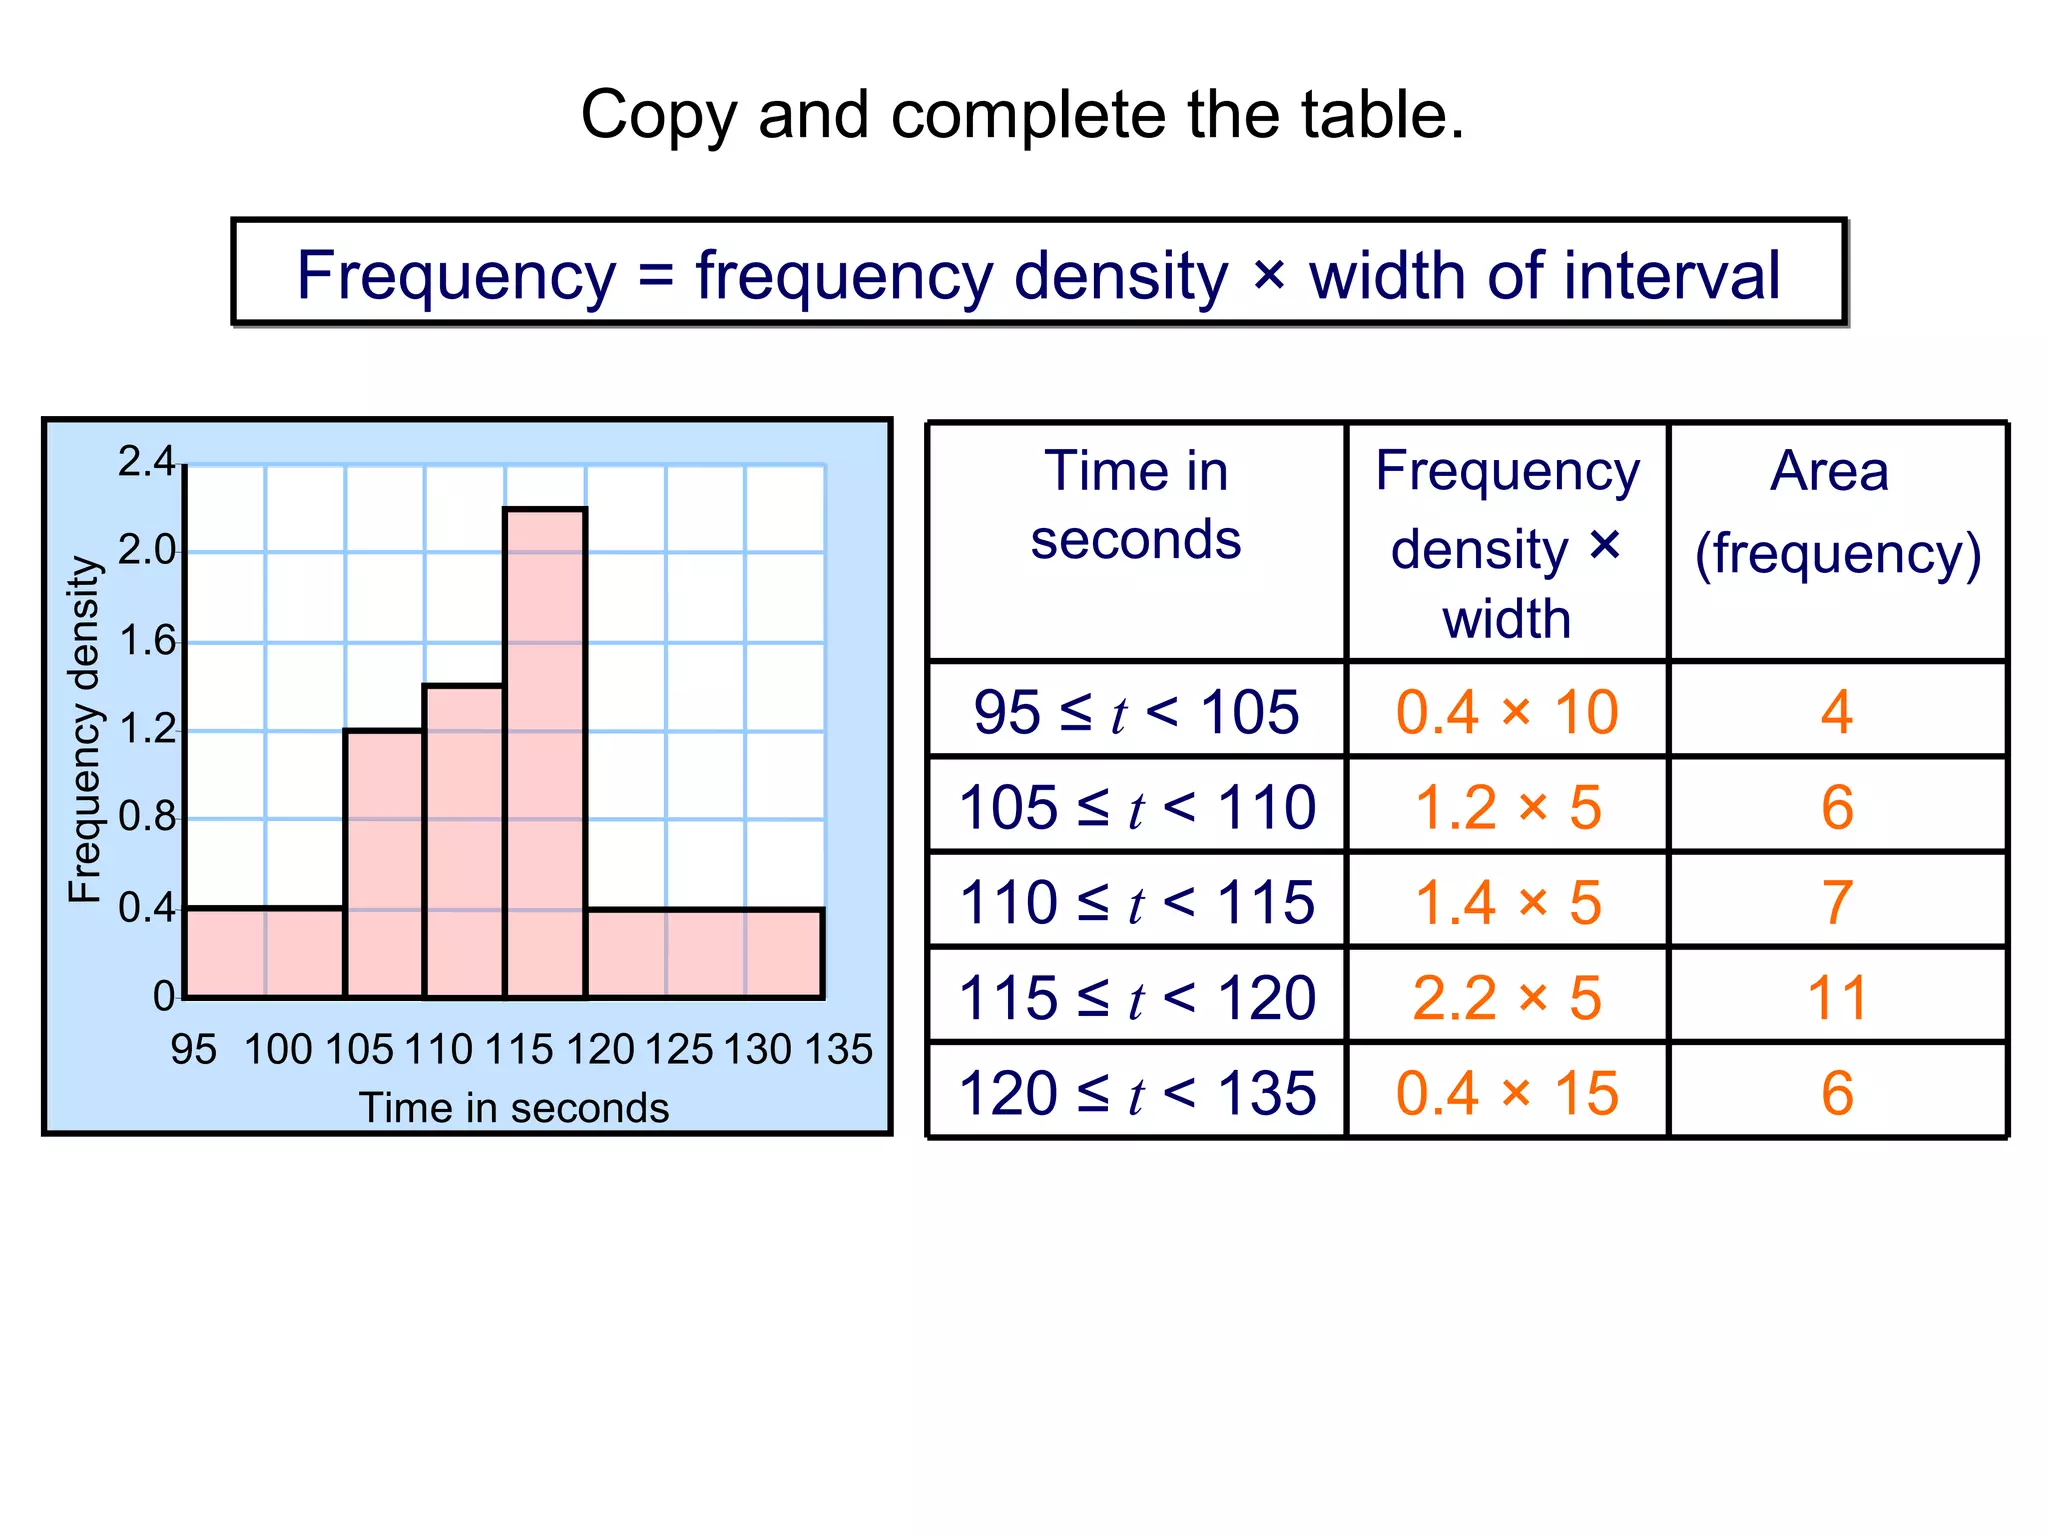
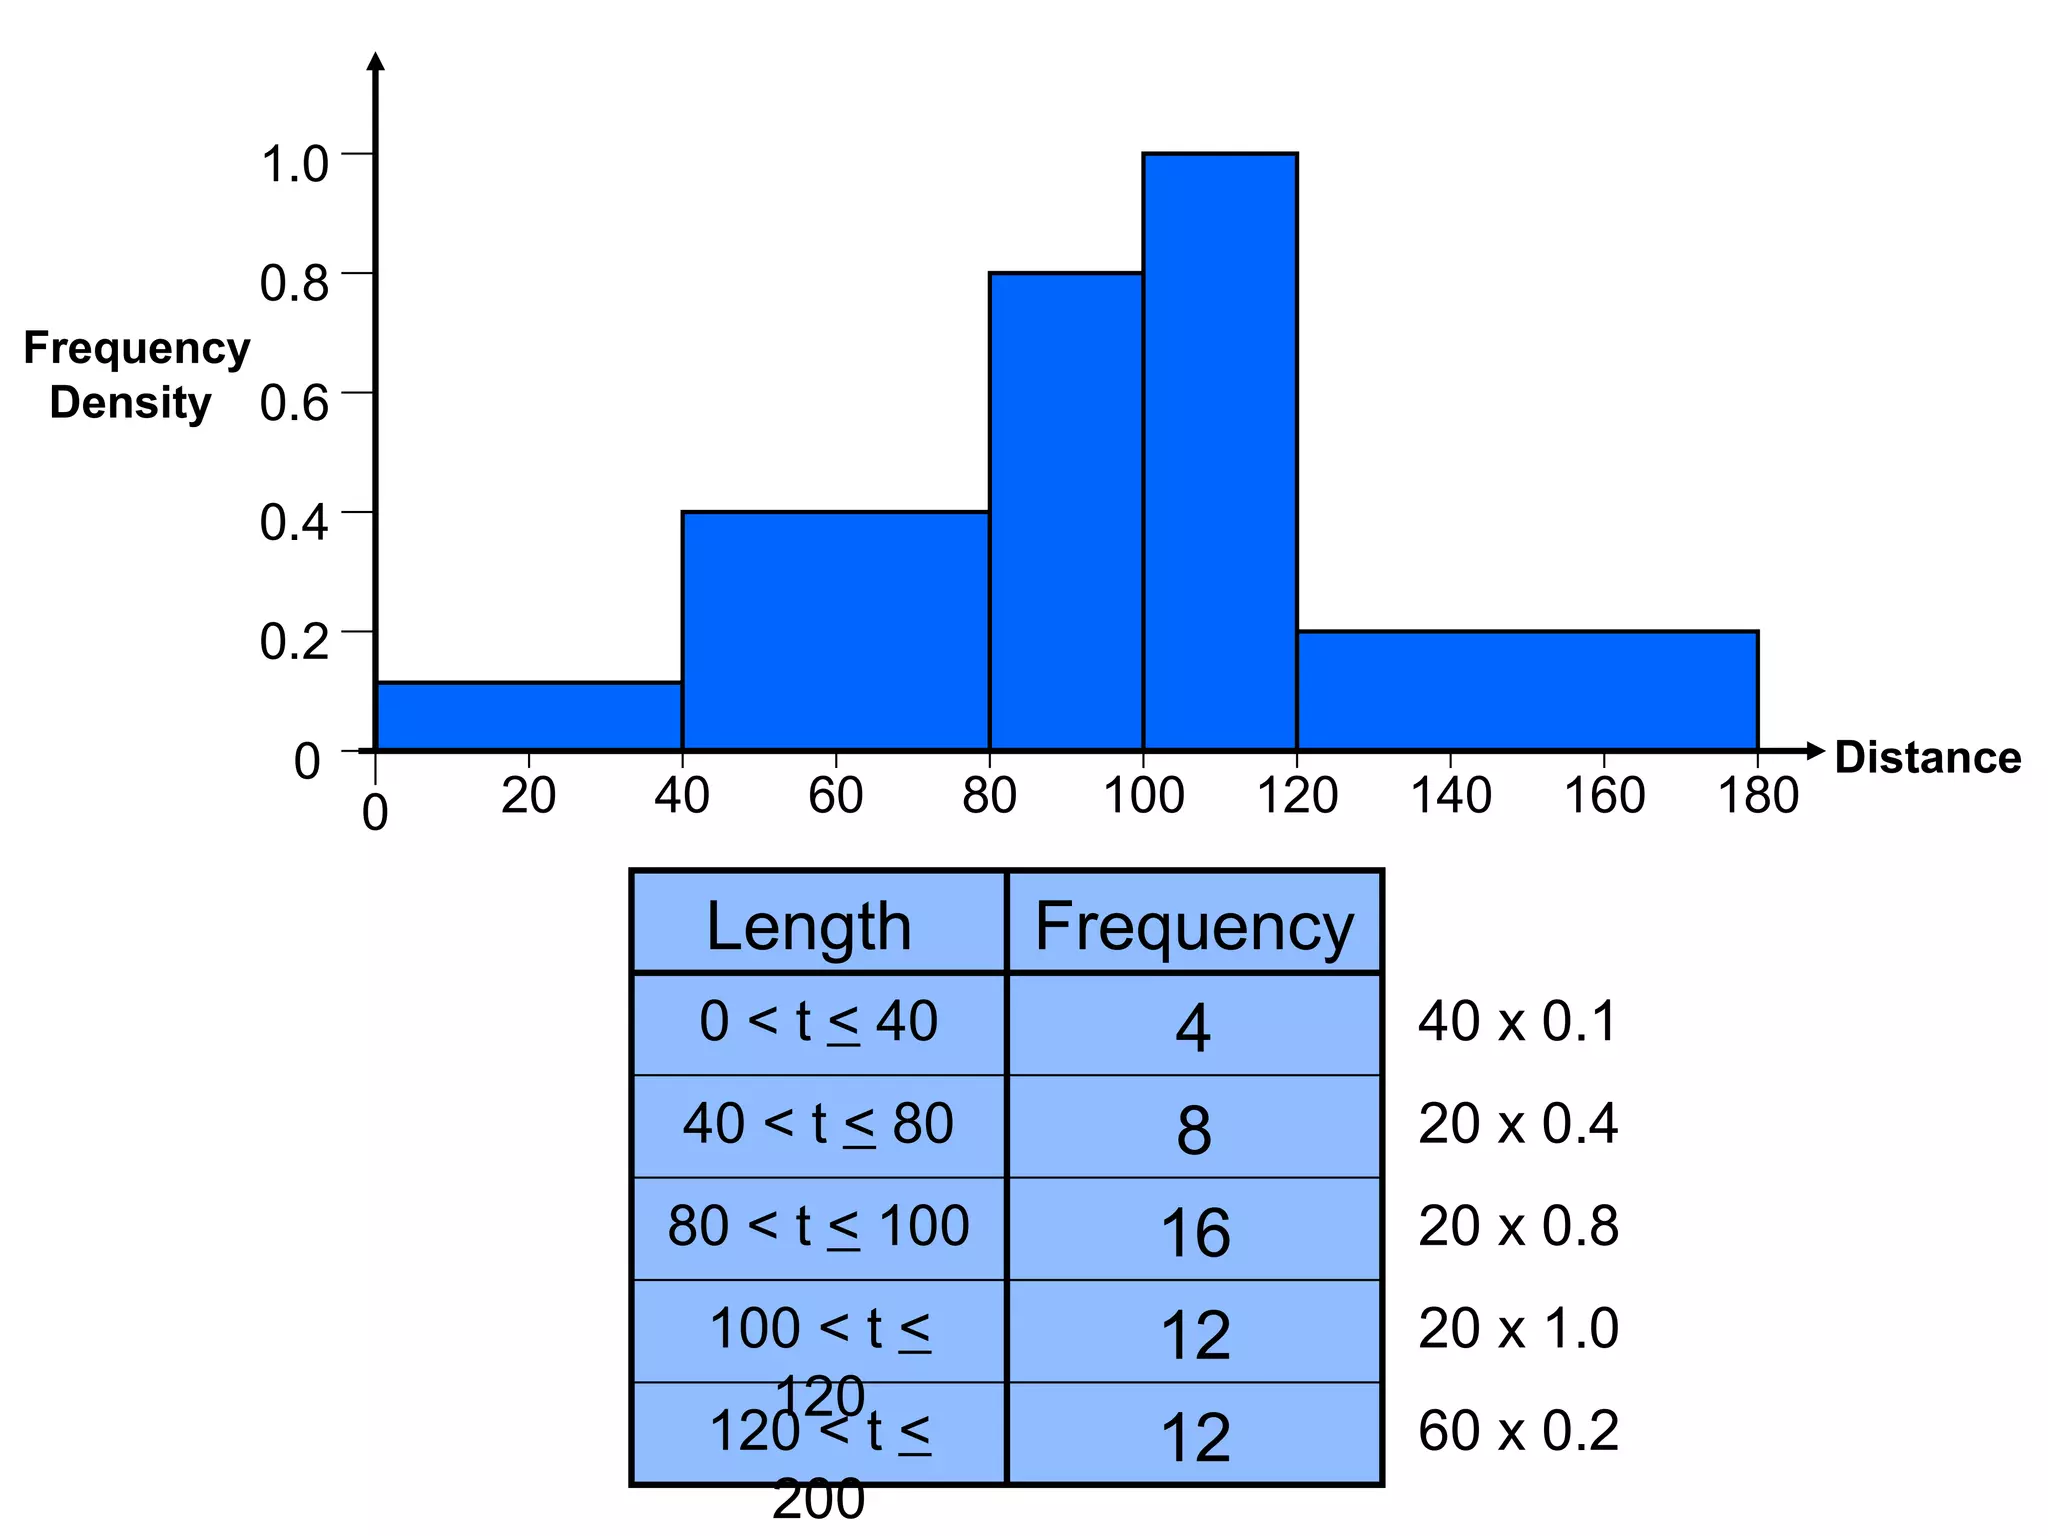
- Frequency: The number of observations (data values) that fall into a particular class interval. Calculated by counting the number of data values within the interval.
- Class interval: A range of values into which individual observations are categorized. Calculated by dividing the range of the data set into equal-sized sections.
- Frequency polygon: A graph that connects the midpoints of the class intervals to the corresponding frequencies using line segments.
- Midpoint: The average value of the class interval. Calculated by taking the average of the lower and upper class interval boundaries.
- Range: The