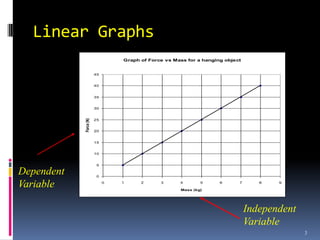
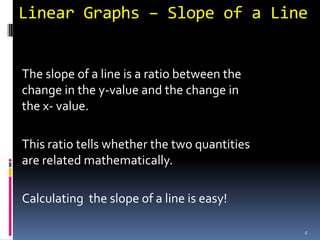
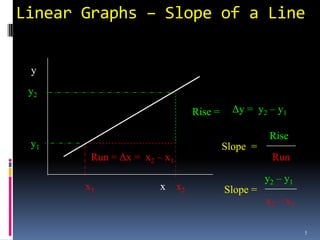
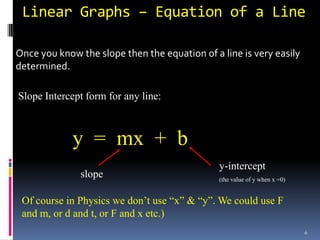
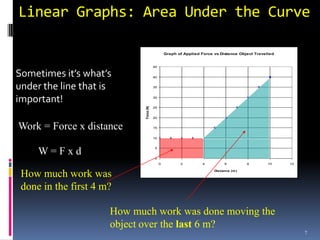
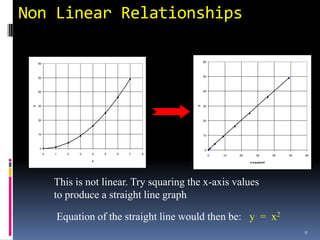
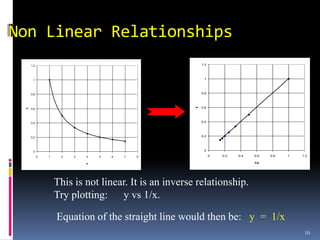
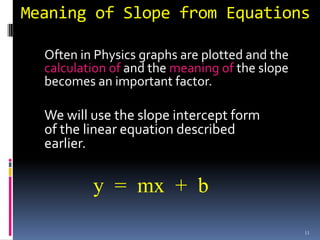
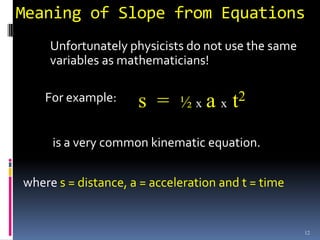
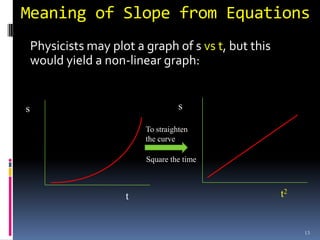
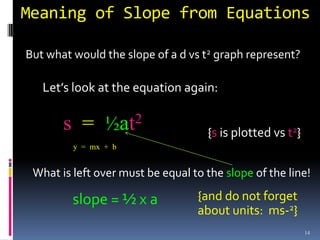
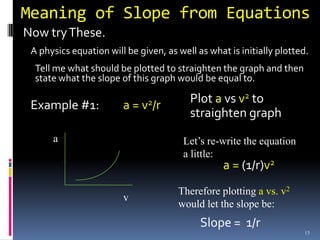
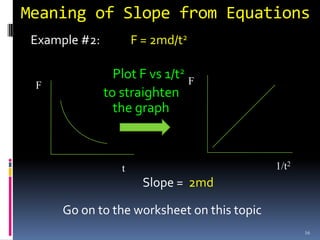
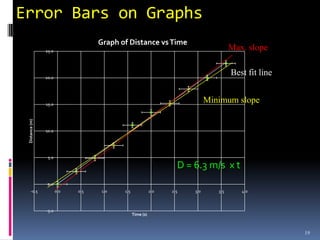
SlideShare a Scribd company logo
GRAPHS IN PHYSICS


                    1
Linear Graphs

Graphing data shows if a relationship exists
between two quantities also called variables.
If two variables show a linear relationship they
are directly proportional to each other.


 Examine the following graph:


                                                   2
Linear Graphs
                                 Graph of Force vs Mass for a hanging object


                        45


                        40


                        35


                        30
            Force (N)


                        25


                        20


                        15


                        10


                         5

Dependent                0


Variable                     0   1     2      3      4       5

                                                     Mass (kg)
                                                                    6      7      8   9


                                                                               Independent
                                                                               Variable
                                                                                             3
Linear Graphs – Slope of a Line


The slope of a line is a ratio between the
change in the y-value and the change in
the x- value.

This ratio tells whether the two quantities
are related mathematically.

Calculating the slope of a line is easy!

                                              4
Linear Graphs – Slope of a Line


 y
 y2
                                  Rise =     Δy = y2 – y1

                                                      Rise
 y1                                        Slope =
        Run = Δx = x2 – x1                            Run

                                                     y2 – y1
       x1              x     x2            Slope =
                                                     x2 – x1

                                                               5
Linear Graphs – Equation of a Line

Once you know the slope then the equation of a line is very easily
determined.

Slope Intercept form for any line:


             y = mx + b
                                               y-intercept
               slope                           (the value of y when x =0)


 Of course in Physics we don’t use “x” & “y”. We could use F
 and m, or d and t, or F and x etc.)
                                                                            6
Linear Graphs: Area Under the Curve

                                                  Graph of Applied Force vs Distance Object Travelled


                                         45

Sometimes it’s what’s                    40


under the line that is                   35


important!                               30


                             Force (N)
                                         25


                                         20


Work = Force x distance                  15


                                         10


     W=Fxd                               5


                                         0
                                              0          2          4         6          8        10    12


 How much work was                                                       Distance (m )


 done in the first 4 m?

                      How much work was done moving the
                      object over the last 6 m?
                                                                                                             7
Non Linear Relationships

 Not all relationships between variables are linear.
 Some are curves which show a squared or square
 root relationship


In this course we use simple techniques to
“straighten the curve” into linear relationship.


                                                        8
Non Linear Relationships

                                                      60
     60


     50                                               50


     40                                               40


                                                  y
     30                                               30
 y


     20                                               20


     10                                               10


     0                                                0
          0   1     2   3   4   5   6   7   8              0   10   20      30       40   50   60
                            x                                            x-squared


              This is not linear. Try squaring the x-axis values
              to produce a straight line graph

                  Equation of the straight line would then be: y = x2
                                                                                               9
Non Linear Relationships
     1.2                                                   1.2


      1                                                     1


     0.8                                                   0.8


                                                           0.6


                                                       y
 y


     0.6


     0.4                                                   0.4


     0.2                                                   0.2


      0                                                     0

           0   1    2   3   4   5   6   7   8                    0   0.2   0.4   0.6   0.8   1   1.2

                            x                                                    1/x


                   This is not linear. It is an inverse relationship.
                   Try plotting: y vs 1/x.

                   Equation of the straight line would then be: y = 1/x
                                                                                                  10
Meaning of Slope from Equations

  Often in Physics graphs are plotted and the
  calculation of and the meaning of the slope
  becomes an important factor.

  We will use the slope intercept form
  of the linear equation described
  earlier.


          y = mx + b
                                                11
Meaning of Slope from Equations
     Unfortunately physicists do not use the same
     variables as mathematicians!

    For example:     s =     ½xa     x t
                                        2


     is a very common kinematic equation.

where s = distance, a = acceleration and t = time


                                                    12
Meaning of Slope from Equations
    Physicists may plot a graph of s vs t, but this
    would yield a non-linear graph:


s                                   s

                          To straighten
                          the curve

                          Square the time


                      t                               t2


                                                           13
Meaning of Slope from Equations

But what would the slope of a d vs t2 graph represent?

   Let’s look at the equation again:

       s = ½at2                     {s is plotted vs t2}
         y = mx + b


 What is left over must be equal to the slope of the line!

         slope = ½ x a            {and do not forget
                                  about units: ms-2}
                                                           14
Meaning of Slope from Equations
Now try These.
 A physics equation will be given, as well as what is initially plotted.
  Tell me what should be plotted to straighten the graph and then
  state what the slope of this graph would be equal to.

 Example #1:            a = v2/r         Plot a vs v2 to
                                         straighten graph
      a                                Let’s re-write the equation
                                       a little:
                                                  a = (1/r)v2
                                      Therefore plotting a vs. v2
                        v
                                      would let the slope be:
                                            Slope = 1/r
                                                                       15
Meaning of Slope from Equations
 Example #2:          F = 2md/t2

                 Plot F vs 1/t2 F
 F
               to straighten
                 the graph


                  t                          1/t2
                        Slope = 2md

      Go on to the worksheet on this topic
                                                    16
Error Bars on Graphs
    You already know about including errors with all
    measured values.
    These errors must be included in any graph that is
    created using these measured value. The errors are
    shown as bars both in the horizontal and vertical
    direction.
     For example:
   2.3 + 0.2 (horizontal )       15.7 + 0.5 (vertical)

This would be shown
like this on the graph.            Error Bars!
                                                         17
Error Bars on Graphs
  Plot the following data and add in
  the error bars:
            time (s)   Distance (m)
             (+0.2)       (+0.5)

              0.0         0.0
              0.4         2.4
              0.8         4.9
              1.2         7.3
              1.6         11.1
              2.0         13.5
              2.4         15.2
              2.8         17.9
              3.2         20.0
              3.6         22.7


                                       18
Error Bars on Graphs
                                   Graph of Distance vs Time
                25.0
                                                                                      Max. slope


                20.0
                                                                                      Best fit line


                15.0
                                                                             Minimum slope
 Distance (m)


                10.0


                 5.0

                                                                   D = 6.3 m/s x t
                 0.0
     -0.5              0.0   0.5   1.0    1.5              2.0   2.5   3.0      3.5      4.0


                -5.0
                                                Time (s)


                                                                                                      19

More Related Content

What's hot

Lesson3.1 The Derivative And The Tangent Line
Lesson3.1 The Derivative And The Tangent LineLesson3.1 The Derivative And The Tangent Line
Lesson3.1 The Derivative And The Tangent Lineseltzermath
 
Volume of solid revolution
Volume of solid revolutionVolume of solid revolution
Volume of solid revolution
beenishbeenish
 
Ch 1: Introduction and Math Concepts
Ch 1:  Introduction and Math ConceptsCh 1:  Introduction and Math Concepts
Ch 1: Introduction and Math ConceptsScott Thomas
 
Solving system of linear equations
Solving system of linear equationsSolving system of linear equations
Solving system of linear equations
Mew Aornwara
 
Components of vector
Components of vectorComponents of vector
Lesson 22: Optimization Problems (slides)
Lesson 22: Optimization Problems (slides)Lesson 22: Optimization Problems (slides)
Lesson 22: Optimization Problems (slides)
Matthew Leingang
 
Limits And Derivative
Limits And DerivativeLimits And Derivative
Limits And Derivative
Ashams kurian
 
INTEGRATION BY PARTS PPT
INTEGRATION BY PARTS PPT INTEGRATION BY PARTS PPT
INTEGRATION BY PARTS PPT
03062679929
 
Exponential and logarithmic functions
Exponential and logarithmic functionsExponential and logarithmic functions
Exponential and logarithmic functionsNjabulo Nkabinde
 
Work, energy & power physics
Work, energy & power physics Work, energy & power physics
Work, energy & power physics sashrilisdi
 
Ch 5 Uniform Circular Motion
Ch 5 Uniform Circular MotionCh 5 Uniform Circular Motion
Ch 5 Uniform Circular Motion
Scott Thomas
 
Physics 9
Physics 9Physics 9
Physics 9
M.T.H Group
 
Power
PowerPower
Relative velocity
Relative velocityRelative velocity
Relative velocityindrasir
 
L5 infinite limits squeeze theorem
L5 infinite limits squeeze theoremL5 infinite limits squeeze theorem
L5 infinite limits squeeze theorem
James Tagara
 
Simple Harmonic & Circular Motion
Simple Harmonic & Circular MotionSimple Harmonic & Circular Motion
Simple Harmonic & Circular MotionPaula Mills
 
Classical mechanics introduction
Classical mechanics   introductionClassical mechanics   introduction
Classical mechanics introduction
AmeenSoomro1
 
Physics - Chapter 3 Powerpoint
Physics - Chapter 3 PowerpointPhysics - Chapter 3 Powerpoint
Physics - Chapter 3 Powerpoint
Mrreynon
 

What's hot (20)

Lesson3.1 The Derivative And The Tangent Line
Lesson3.1 The Derivative And The Tangent LineLesson3.1 The Derivative And The Tangent Line
Lesson3.1 The Derivative And The Tangent Line
 
Volume of solid revolution
Volume of solid revolutionVolume of solid revolution
Volume of solid revolution
 
Ch 1: Introduction and Math Concepts
Ch 1:  Introduction and Math ConceptsCh 1:  Introduction and Math Concepts
Ch 1: Introduction and Math Concepts
 
Solving system of linear equations
Solving system of linear equationsSolving system of linear equations
Solving system of linear equations
 
Components of vector
Components of vectorComponents of vector
Components of vector
 
Rectilinear motion
Rectilinear motionRectilinear motion
Rectilinear motion
 
Work in physics
Work in physicsWork in physics
Work in physics
 
Lesson 22: Optimization Problems (slides)
Lesson 22: Optimization Problems (slides)Lesson 22: Optimization Problems (slides)
Lesson 22: Optimization Problems (slides)
 
Limits And Derivative
Limits And DerivativeLimits And Derivative
Limits And Derivative
 
INTEGRATION BY PARTS PPT
INTEGRATION BY PARTS PPT INTEGRATION BY PARTS PPT
INTEGRATION BY PARTS PPT
 
Exponential and logarithmic functions
Exponential and logarithmic functionsExponential and logarithmic functions
Exponential and logarithmic functions
 
Work, energy & power physics
Work, energy & power physics Work, energy & power physics
Work, energy & power physics
 
Ch 5 Uniform Circular Motion
Ch 5 Uniform Circular MotionCh 5 Uniform Circular Motion
Ch 5 Uniform Circular Motion
 
Physics 9
Physics 9Physics 9
Physics 9
 
Power
PowerPower
Power
 
Relative velocity
Relative velocityRelative velocity
Relative velocity
 
L5 infinite limits squeeze theorem
L5 infinite limits squeeze theoremL5 infinite limits squeeze theorem
L5 infinite limits squeeze theorem
 
Simple Harmonic & Circular Motion
Simple Harmonic & Circular MotionSimple Harmonic & Circular Motion
Simple Harmonic & Circular Motion
 
Classical mechanics introduction
Classical mechanics   introductionClassical mechanics   introduction
Classical mechanics introduction
 
Physics - Chapter 3 Powerpoint
Physics - Chapter 3 PowerpointPhysics - Chapter 3 Powerpoint
Physics - Chapter 3 Powerpoint
 

Similar to Graphs in physics

Scatter diagrams and correlation and simple linear regresssion
Scatter diagrams and correlation and simple linear regresssionScatter diagrams and correlation and simple linear regresssion
Scatter diagrams and correlation and simple linear regresssionAnkit Katiyar
 
talk9.ppt
talk9.ppttalk9.ppt
Straight line properties
Straight line propertiesStraight line properties
Straight line properties
Awais Khan
 
Statistics lecture 11 (chapter 11)
Statistics lecture 11 (chapter 11)Statistics lecture 11 (chapter 11)
Statistics lecture 11 (chapter 11)
jillmitchell8778
 
Matrices ppt
Matrices pptMatrices ppt
Matrices ppt
aakashray33
 
Signal Processing Course : Theory for Sparse Recovery
Signal Processing Course : Theory for Sparse RecoverySignal Processing Course : Theory for Sparse Recovery
Signal Processing Course : Theory for Sparse Recovery
Gabriel Peyré
 
Models
ModelsModels
Lesson all about Derivatives PPT (with examples)
Lesson all about Derivatives PPT (with examples)Lesson all about Derivatives PPT (with examples)
Lesson all about Derivatives PPT (with examples)
DorothyJuliaDelaCruz
 
DerivativesXP.ppt
DerivativesXP.pptDerivativesXP.ppt
DerivativesXP.ppt
SnehSinha6
 
Yangs First Lecture Ppt
Yangs First Lecture PptYangs First Lecture Ppt
Yangs First Lecture Ppt
yangcaoisu
 
Module 11 graph of functions PMR
Module 11 graph of functions PMRModule 11 graph of functions PMR
Module 11 graph of functions PMRroszelan
 
M2l11
M2l11M2l11
Demographic forecasting
Demographic forecastingDemographic forecasting
Demographic forecasting
Rob Hyndman
 
Regression
RegressionRegression
Regression
LavanyaK75
 

Similar to Graphs in physics (20)

Linear Transformations
Linear TransformationsLinear Transformations
Linear Transformations
 
T tests anovas and regression
T tests anovas and regressionT tests anovas and regression
T tests anovas and regression
 
Scatter diagrams and correlation and simple linear regresssion
Scatter diagrams and correlation and simple linear regresssionScatter diagrams and correlation and simple linear regresssion
Scatter diagrams and correlation and simple linear regresssion
 
talk9.ppt
talk9.ppttalk9.ppt
talk9.ppt
 
Straight line properties
Straight line propertiesStraight line properties
Straight line properties
 
Statistics lecture 11 (chapter 11)
Statistics lecture 11 (chapter 11)Statistics lecture 11 (chapter 11)
Statistics lecture 11 (chapter 11)
 
Matrices ppt
Matrices pptMatrices ppt
Matrices ppt
 
Signal Processing Course : Theory for Sparse Recovery
Signal Processing Course : Theory for Sparse RecoverySignal Processing Course : Theory for Sparse Recovery
Signal Processing Course : Theory for Sparse Recovery
 
Section 1
Section 1Section 1
Section 1
 
Section 1
Section 1Section 1
Section 1
 
Models
ModelsModels
Models
 
Lesson all about Derivatives PPT (with examples)
Lesson all about Derivatives PPT (with examples)Lesson all about Derivatives PPT (with examples)
Lesson all about Derivatives PPT (with examples)
 
DerivativesXP.ppt
DerivativesXP.pptDerivativesXP.ppt
DerivativesXP.ppt
 
Yangs First Lecture Ppt
Yangs First Lecture PptYangs First Lecture Ppt
Yangs First Lecture Ppt
 
Module 11 graph of functions PMR
Module 11 graph of functions PMRModule 11 graph of functions PMR
Module 11 graph of functions PMR
 
Chapter 1 straight line
Chapter 1 straight lineChapter 1 straight line
Chapter 1 straight line
 
M2l11
M2l11M2l11
M2l11
 
Demographic forecasting
Demographic forecastingDemographic forecasting
Demographic forecasting
 
Regression
RegressionRegression
Regression
 
Eigenvalues - Contd
Eigenvalues - ContdEigenvalues - Contd
Eigenvalues - Contd
 

More from simonandisa

12.1 - Lenz's law
12.1  - Lenz's law12.1  - Lenz's law
12.1 - Lenz's law
simonandisa
 
12.1 - Faraday's law
12.1  - Faraday's law12.1  - Faraday's law
12.1 - Faraday's law
simonandisa
 
6.3 - Magnetic Force and Field
6.3  - Magnetic Force and Field6.3  - Magnetic Force and Field
6.3 - Magnetic Force and Field
simonandisa
 
9.3 - Electric Potential
9.3 - Electric Potential9.3 - Electric Potential
9.3 - Electric Potential
simonandisa
 
6.2 - Electric Force and field
6.2 - Electric Force and field6.2 - Electric Force and field
6.2 - Electric Force and field
simonandisa
 
9.4 - Orbital Motion & Kepler's third law
9.4 - Orbital Motion & Kepler's third law9.4 - Orbital Motion & Kepler's third law
9.4 - Orbital Motion & Kepler's third law
simonandisa
 
6.1 - Gravitational Force and fields
6.1 - Gravitational Force and fields6.1 - Gravitational Force and fields
6.1 - Gravitational Force and fields
simonandisa
 
5.2 - Ammeters, Voltmeters & Potential Dividers
5.2 - Ammeters, Voltmeters & Potential Dividers5.2 - Ammeters, Voltmeters & Potential Dividers
5.2 - Ammeters, Voltmeters & Potential Dividers
simonandisa
 
5.2 - Internal Resistance, Power & Combining Resistors
5.2 - Internal Resistance, Power & Combining Resistors5.2 - Internal Resistance, Power & Combining Resistors
5.2 - Internal Resistance, Power & Combining Resistors
simonandisa
 
5.1 - Potential Difference, Current & Resistance
5.1 - Potential Difference, Current & Resistance5.1 - Potential Difference, Current & Resistance
5.1 - Potential Difference, Current & Resistance
simonandisa
 
The Scientific Method
The Scientific Method The Scientific Method
The Scientific Method simonandisa
 
10.3 - Entropy and the 2nd law
10.3 - Entropy and the 2nd law10.3 - Entropy and the 2nd law
10.3 - Entropy and the 2nd lawsimonandisa
 
10.2 - First law of Thermodynamics and PV graphs
10.2 - First law of Thermodynamics and PV graphs10.2 - First law of Thermodynamics and PV graphs
10.2 - First law of Thermodynamics and PV graphssimonandisa
 
10.3 - Second law of thermodynamics
10.3 - Second law of thermodynamics10.3 - Second law of thermodynamics
10.3 - Second law of thermodynamicssimonandisa
 
Introduction to the analog mobile phone system
Introduction to the analog mobile phone systemIntroduction to the analog mobile phone system
Introduction to the analog mobile phone systemsimonandisa
 
Organic chemistry
Organic chemistryOrganic chemistry
Organic chemistrysimonandisa
 
How data storage is changing
How data storage is changingHow data storage is changing
How data storage is changingsimonandisa
 
Analogue to digital conversion
Analogue to digital conversionAnalogue to digital conversion
Analogue to digital conversionsimonandisa
 

More from simonandisa (20)

12.1 - Lenz's law
12.1  - Lenz's law12.1  - Lenz's law
12.1 - Lenz's law
 
12.1 - Faraday's law
12.1  - Faraday's law12.1  - Faraday's law
12.1 - Faraday's law
 
6.3 - Magnetic Force and Field
6.3  - Magnetic Force and Field6.3  - Magnetic Force and Field
6.3 - Magnetic Force and Field
 
9.3 - Electric Potential
9.3 - Electric Potential9.3 - Electric Potential
9.3 - Electric Potential
 
6.2 - Electric Force and field
6.2 - Electric Force and field6.2 - Electric Force and field
6.2 - Electric Force and field
 
9.4 - Orbital Motion & Kepler's third law
9.4 - Orbital Motion & Kepler's third law9.4 - Orbital Motion & Kepler's third law
9.4 - Orbital Motion & Kepler's third law
 
6.1 - Gravitational Force and fields
6.1 - Gravitational Force and fields6.1 - Gravitational Force and fields
6.1 - Gravitational Force and fields
 
5.2 - Ammeters, Voltmeters & Potential Dividers
5.2 - Ammeters, Voltmeters & Potential Dividers5.2 - Ammeters, Voltmeters & Potential Dividers
5.2 - Ammeters, Voltmeters & Potential Dividers
 
5.2 - Internal Resistance, Power & Combining Resistors
5.2 - Internal Resistance, Power & Combining Resistors5.2 - Internal Resistance, Power & Combining Resistors
5.2 - Internal Resistance, Power & Combining Resistors
 
5.1 - Potential Difference, Current & Resistance
5.1 - Potential Difference, Current & Resistance5.1 - Potential Difference, Current & Resistance
5.1 - Potential Difference, Current & Resistance
 
The Scientific Method
The Scientific Method The Scientific Method
The Scientific Method
 
10.3 - Entropy and the 2nd law
10.3 - Entropy and the 2nd law10.3 - Entropy and the 2nd law
10.3 - Entropy and the 2nd law
 
10.2 - First law of Thermodynamics and PV graphs
10.2 - First law of Thermodynamics and PV graphs10.2 - First law of Thermodynamics and PV graphs
10.2 - First law of Thermodynamics and PV graphs
 
10.3 - Second law of thermodynamics
10.3 - Second law of thermodynamics10.3 - Second law of thermodynamics
10.3 - Second law of thermodynamics
 
Introduction to the analog mobile phone system
Introduction to the analog mobile phone systemIntroduction to the analog mobile phone system
Introduction to the analog mobile phone system
 
Organic chemistry
Organic chemistryOrganic chemistry
Organic chemistry
 
Cc ds
Cc dsCc ds
Cc ds
 
How data storage is changing
How data storage is changingHow data storage is changing
How data storage is changing
 
Cd's & dvd's
Cd's & dvd'sCd's & dvd's
Cd's & dvd's
 
Analogue to digital conversion
Analogue to digital conversionAnalogue to digital conversion
Analogue to digital conversion
 

Recently uploaded

Thesis Statement for students diagnonsed withADHD.ppt
Thesis Statement for students diagnonsed withADHD.pptThesis Statement for students diagnonsed withADHD.ppt
Thesis Statement for students diagnonsed withADHD.ppt
EverAndrsGuerraGuerr
 
Embracing GenAI - A Strategic Imperative
Embracing GenAI - A Strategic ImperativeEmbracing GenAI - A Strategic Imperative
Embracing GenAI - A Strategic Imperative
Peter Windle
 
Adversarial Attention Modeling for Multi-dimensional Emotion Regression.pdf
Adversarial Attention Modeling for Multi-dimensional Emotion Regression.pdfAdversarial Attention Modeling for Multi-dimensional Emotion Regression.pdf
Adversarial Attention Modeling for Multi-dimensional Emotion Regression.pdf
Po-Chuan Chen
 
Unit 8 - Information and Communication Technology (Paper I).pdf
Unit 8 - Information and Communication Technology (Paper I).pdfUnit 8 - Information and Communication Technology (Paper I).pdf
Unit 8 - Information and Communication Technology (Paper I).pdf
Thiyagu K
 
Digital Tools and AI for Teaching Learning and Research
Digital Tools and AI for Teaching Learning and ResearchDigital Tools and AI for Teaching Learning and Research
Digital Tools and AI for Teaching Learning and Research
Vikramjit Singh
 
Instructions for Submissions thorugh G- Classroom.pptx
Instructions for Submissions thorugh G- Classroom.pptxInstructions for Submissions thorugh G- Classroom.pptx
Instructions for Submissions thorugh G- Classroom.pptx
Jheel Barad
 
Francesca Gottschalk - How can education support child empowerment.pptx
Francesca Gottschalk - How can education support child empowerment.pptxFrancesca Gottschalk - How can education support child empowerment.pptx
Francesca Gottschalk - How can education support child empowerment.pptx
EduSkills OECD
 
The French Revolution Class 9 Study Material pdf free download
The French Revolution Class 9 Study Material pdf free downloadThe French Revolution Class 9 Study Material pdf free download
The French Revolution Class 9 Study Material pdf free download
Vivekanand Anglo Vedic Academy
 
Synthetic Fiber Construction in lab .pptx
Synthetic Fiber Construction in lab .pptxSynthetic Fiber Construction in lab .pptx
Synthetic Fiber Construction in lab .pptx
Pavel ( NSTU)
 
The geography of Taylor Swift - some ideas
The geography of Taylor Swift - some ideasThe geography of Taylor Swift - some ideas
The geography of Taylor Swift - some ideas
GeoBlogs
 
Supporting (UKRI) OA monographs at Salford.pptx
Supporting (UKRI) OA monographs at Salford.pptxSupporting (UKRI) OA monographs at Salford.pptx
Supporting (UKRI) OA monographs at Salford.pptx
Jisc
 
2024.06.01 Introducing a competency framework for languag learning materials ...
2024.06.01 Introducing a competency framework for languag learning materials ...2024.06.01 Introducing a competency framework for languag learning materials ...
2024.06.01 Introducing a competency framework for languag learning materials ...
Sandy Millin
 
A Strategic Approach: GenAI in Education
A Strategic Approach: GenAI in EducationA Strategic Approach: GenAI in Education
A Strategic Approach: GenAI in Education
Peter Windle
 
Sha'Carri Richardson Presentation 202345
Sha'Carri Richardson Presentation 202345Sha'Carri Richardson Presentation 202345
Sha'Carri Richardson Presentation 202345
beazzy04
 
How to Make a Field invisible in Odoo 17
How to Make a Field invisible in Odoo 17How to Make a Field invisible in Odoo 17
How to Make a Field invisible in Odoo 17
Celine George
 
The basics of sentences session 5pptx.pptx
The basics of sentences session 5pptx.pptxThe basics of sentences session 5pptx.pptx
The basics of sentences session 5pptx.pptx
heathfieldcps1
 
Welcome to TechSoup New Member Orientation and Q&A (May 2024).pdf
Welcome to TechSoup   New Member Orientation and Q&A (May 2024).pdfWelcome to TechSoup   New Member Orientation and Q&A (May 2024).pdf
Welcome to TechSoup New Member Orientation and Q&A (May 2024).pdf
TechSoup
 
Introduction to AI for Nonprofits with Tapp Network
Introduction to AI for Nonprofits with Tapp NetworkIntroduction to AI for Nonprofits with Tapp Network
Introduction to AI for Nonprofits with Tapp Network
TechSoup
 
"Protectable subject matters, Protection in biotechnology, Protection of othe...
"Protectable subject matters, Protection in biotechnology, Protection of othe..."Protectable subject matters, Protection in biotechnology, Protection of othe...
"Protectable subject matters, Protection in biotechnology, Protection of othe...
SACHIN R KONDAGURI
 
Palestine last event orientationfvgnh .pptx
Palestine last event orientationfvgnh .pptxPalestine last event orientationfvgnh .pptx
Palestine last event orientationfvgnh .pptx
RaedMohamed3
 

Recently uploaded (20)

Thesis Statement for students diagnonsed withADHD.ppt
Thesis Statement for students diagnonsed withADHD.pptThesis Statement for students diagnonsed withADHD.ppt
Thesis Statement for students diagnonsed withADHD.ppt
 
Embracing GenAI - A Strategic Imperative
Embracing GenAI - A Strategic ImperativeEmbracing GenAI - A Strategic Imperative
Embracing GenAI - A Strategic Imperative
 
Adversarial Attention Modeling for Multi-dimensional Emotion Regression.pdf
Adversarial Attention Modeling for Multi-dimensional Emotion Regression.pdfAdversarial Attention Modeling for Multi-dimensional Emotion Regression.pdf
Adversarial Attention Modeling for Multi-dimensional Emotion Regression.pdf
 
Unit 8 - Information and Communication Technology (Paper I).pdf
Unit 8 - Information and Communication Technology (Paper I).pdfUnit 8 - Information and Communication Technology (Paper I).pdf
Unit 8 - Information and Communication Technology (Paper I).pdf
 
Digital Tools and AI for Teaching Learning and Research
Digital Tools and AI for Teaching Learning and ResearchDigital Tools and AI for Teaching Learning and Research
Digital Tools and AI for Teaching Learning and Research
 
Instructions for Submissions thorugh G- Classroom.pptx
Instructions for Submissions thorugh G- Classroom.pptxInstructions for Submissions thorugh G- Classroom.pptx
Instructions for Submissions thorugh G- Classroom.pptx
 
Francesca Gottschalk - How can education support child empowerment.pptx
Francesca Gottschalk - How can education support child empowerment.pptxFrancesca Gottschalk - How can education support child empowerment.pptx
Francesca Gottschalk - How can education support child empowerment.pptx
 
The French Revolution Class 9 Study Material pdf free download
The French Revolution Class 9 Study Material pdf free downloadThe French Revolution Class 9 Study Material pdf free download
The French Revolution Class 9 Study Material pdf free download
 
Synthetic Fiber Construction in lab .pptx
Synthetic Fiber Construction in lab .pptxSynthetic Fiber Construction in lab .pptx
Synthetic Fiber Construction in lab .pptx
 
The geography of Taylor Swift - some ideas
The geography of Taylor Swift - some ideasThe geography of Taylor Swift - some ideas
The geography of Taylor Swift - some ideas
 
Supporting (UKRI) OA monographs at Salford.pptx
Supporting (UKRI) OA monographs at Salford.pptxSupporting (UKRI) OA monographs at Salford.pptx
Supporting (UKRI) OA monographs at Salford.pptx
 
2024.06.01 Introducing a competency framework for languag learning materials ...
2024.06.01 Introducing a competency framework for languag learning materials ...2024.06.01 Introducing a competency framework for languag learning materials ...
2024.06.01 Introducing a competency framework for languag learning materials ...
 
A Strategic Approach: GenAI in Education
A Strategic Approach: GenAI in EducationA Strategic Approach: GenAI in Education
A Strategic Approach: GenAI in Education
 
Sha'Carri Richardson Presentation 202345
Sha'Carri Richardson Presentation 202345Sha'Carri Richardson Presentation 202345
Sha'Carri Richardson Presentation 202345
 
How to Make a Field invisible in Odoo 17
How to Make a Field invisible in Odoo 17How to Make a Field invisible in Odoo 17
How to Make a Field invisible in Odoo 17
 
The basics of sentences session 5pptx.pptx
The basics of sentences session 5pptx.pptxThe basics of sentences session 5pptx.pptx
The basics of sentences session 5pptx.pptx
 
Welcome to TechSoup New Member Orientation and Q&A (May 2024).pdf
Welcome to TechSoup   New Member Orientation and Q&A (May 2024).pdfWelcome to TechSoup   New Member Orientation and Q&A (May 2024).pdf
Welcome to TechSoup New Member Orientation and Q&A (May 2024).pdf
 
Introduction to AI for Nonprofits with Tapp Network
Introduction to AI for Nonprofits with Tapp NetworkIntroduction to AI for Nonprofits with Tapp Network
Introduction to AI for Nonprofits with Tapp Network
 
"Protectable subject matters, Protection in biotechnology, Protection of othe...
"Protectable subject matters, Protection in biotechnology, Protection of othe..."Protectable subject matters, Protection in biotechnology, Protection of othe...
"Protectable subject matters, Protection in biotechnology, Protection of othe...
 
Palestine last event orientationfvgnh .pptx
Palestine last event orientationfvgnh .pptxPalestine last event orientationfvgnh .pptx
Palestine last event orientationfvgnh .pptx
 

Graphs in physics

  • 2. Linear Graphs Graphing data shows if a relationship exists between two quantities also called variables. If two variables show a linear relationship they are directly proportional to each other. Examine the following graph: 2
  • 3. Linear Graphs Graph of Force vs Mass for a hanging object 45 40 35 30 Force (N) 25 20 15 10 5 Dependent 0 Variable 0 1 2 3 4 5 Mass (kg) 6 7 8 9 Independent Variable 3
  • 4. Linear Graphs – Slope of a Line The slope of a line is a ratio between the change in the y-value and the change in the x- value. This ratio tells whether the two quantities are related mathematically. Calculating the slope of a line is easy! 4
  • 5. Linear Graphs – Slope of a Line y y2 Rise = Δy = y2 – y1 Rise y1 Slope = Run = Δx = x2 – x1 Run y2 – y1 x1 x x2 Slope = x2 – x1 5
  • 6. Linear Graphs – Equation of a Line Once you know the slope then the equation of a line is very easily determined. Slope Intercept form for any line: y = mx + b y-intercept slope (the value of y when x =0) Of course in Physics we don’t use “x” & “y”. We could use F and m, or d and t, or F and x etc.) 6
  • 7. Linear Graphs: Area Under the Curve Graph of Applied Force vs Distance Object Travelled 45 Sometimes it’s what’s 40 under the line that is 35 important! 30 Force (N) 25 20 Work = Force x distance 15 10 W=Fxd 5 0 0 2 4 6 8 10 12 How much work was Distance (m ) done in the first 4 m? How much work was done moving the object over the last 6 m? 7
  • 8. Non Linear Relationships  Not all relationships between variables are linear.  Some are curves which show a squared or square root relationship In this course we use simple techniques to “straighten the curve” into linear relationship. 8
  • 9. Non Linear Relationships 60 60 50 50 40 40 y 30 30 y 20 20 10 10 0 0 0 1 2 3 4 5 6 7 8 0 10 20 30 40 50 60 x x-squared This is not linear. Try squaring the x-axis values to produce a straight line graph Equation of the straight line would then be: y = x2 9
  • 10. Non Linear Relationships 1.2 1.2 1 1 0.8 0.8 0.6 y y 0.6 0.4 0.4 0.2 0.2 0 0 0 1 2 3 4 5 6 7 8 0 0.2 0.4 0.6 0.8 1 1.2 x 1/x This is not linear. It is an inverse relationship. Try plotting: y vs 1/x. Equation of the straight line would then be: y = 1/x 10
  • 11. Meaning of Slope from Equations Often in Physics graphs are plotted and the calculation of and the meaning of the slope becomes an important factor. We will use the slope intercept form of the linear equation described earlier. y = mx + b 11
  • 12. Meaning of Slope from Equations Unfortunately physicists do not use the same variables as mathematicians! For example: s = ½xa x t 2 is a very common kinematic equation. where s = distance, a = acceleration and t = time 12
  • 13. Meaning of Slope from Equations Physicists may plot a graph of s vs t, but this would yield a non-linear graph: s s To straighten the curve Square the time t t2 13
  • 14. Meaning of Slope from Equations But what would the slope of a d vs t2 graph represent? Let’s look at the equation again: s = ½at2 {s is plotted vs t2} y = mx + b What is left over must be equal to the slope of the line! slope = ½ x a {and do not forget about units: ms-2} 14
  • 15. Meaning of Slope from Equations Now try These. A physics equation will be given, as well as what is initially plotted. Tell me what should be plotted to straighten the graph and then state what the slope of this graph would be equal to. Example #1: a = v2/r Plot a vs v2 to straighten graph a Let’s re-write the equation a little: a = (1/r)v2 Therefore plotting a vs. v2 v would let the slope be: Slope = 1/r 15
  • 16. Meaning of Slope from Equations Example #2: F = 2md/t2 Plot F vs 1/t2 F F to straighten the graph t 1/t2 Slope = 2md Go on to the worksheet on this topic 16
  • 17. Error Bars on Graphs You already know about including errors with all measured values. These errors must be included in any graph that is created using these measured value. The errors are shown as bars both in the horizontal and vertical direction. For example: 2.3 + 0.2 (horizontal ) 15.7 + 0.5 (vertical) This would be shown like this on the graph. Error Bars! 17
  • 18. Error Bars on Graphs Plot the following data and add in the error bars: time (s) Distance (m) (+0.2) (+0.5) 0.0 0.0 0.4 2.4 0.8 4.9 1.2 7.3 1.6 11.1 2.0 13.5 2.4 15.2 2.8 17.9 3.2 20.0 3.6 22.7 18
  • 19. Error Bars on Graphs Graph of Distance vs Time 25.0 Max. slope 20.0 Best fit line 15.0 Minimum slope Distance (m) 10.0 5.0 D = 6.3 m/s x t 0.0 -0.5 0.0 0.5 1.0 1.5 2.0 2.5 3.0 3.5 4.0 -5.0 Time (s) 19