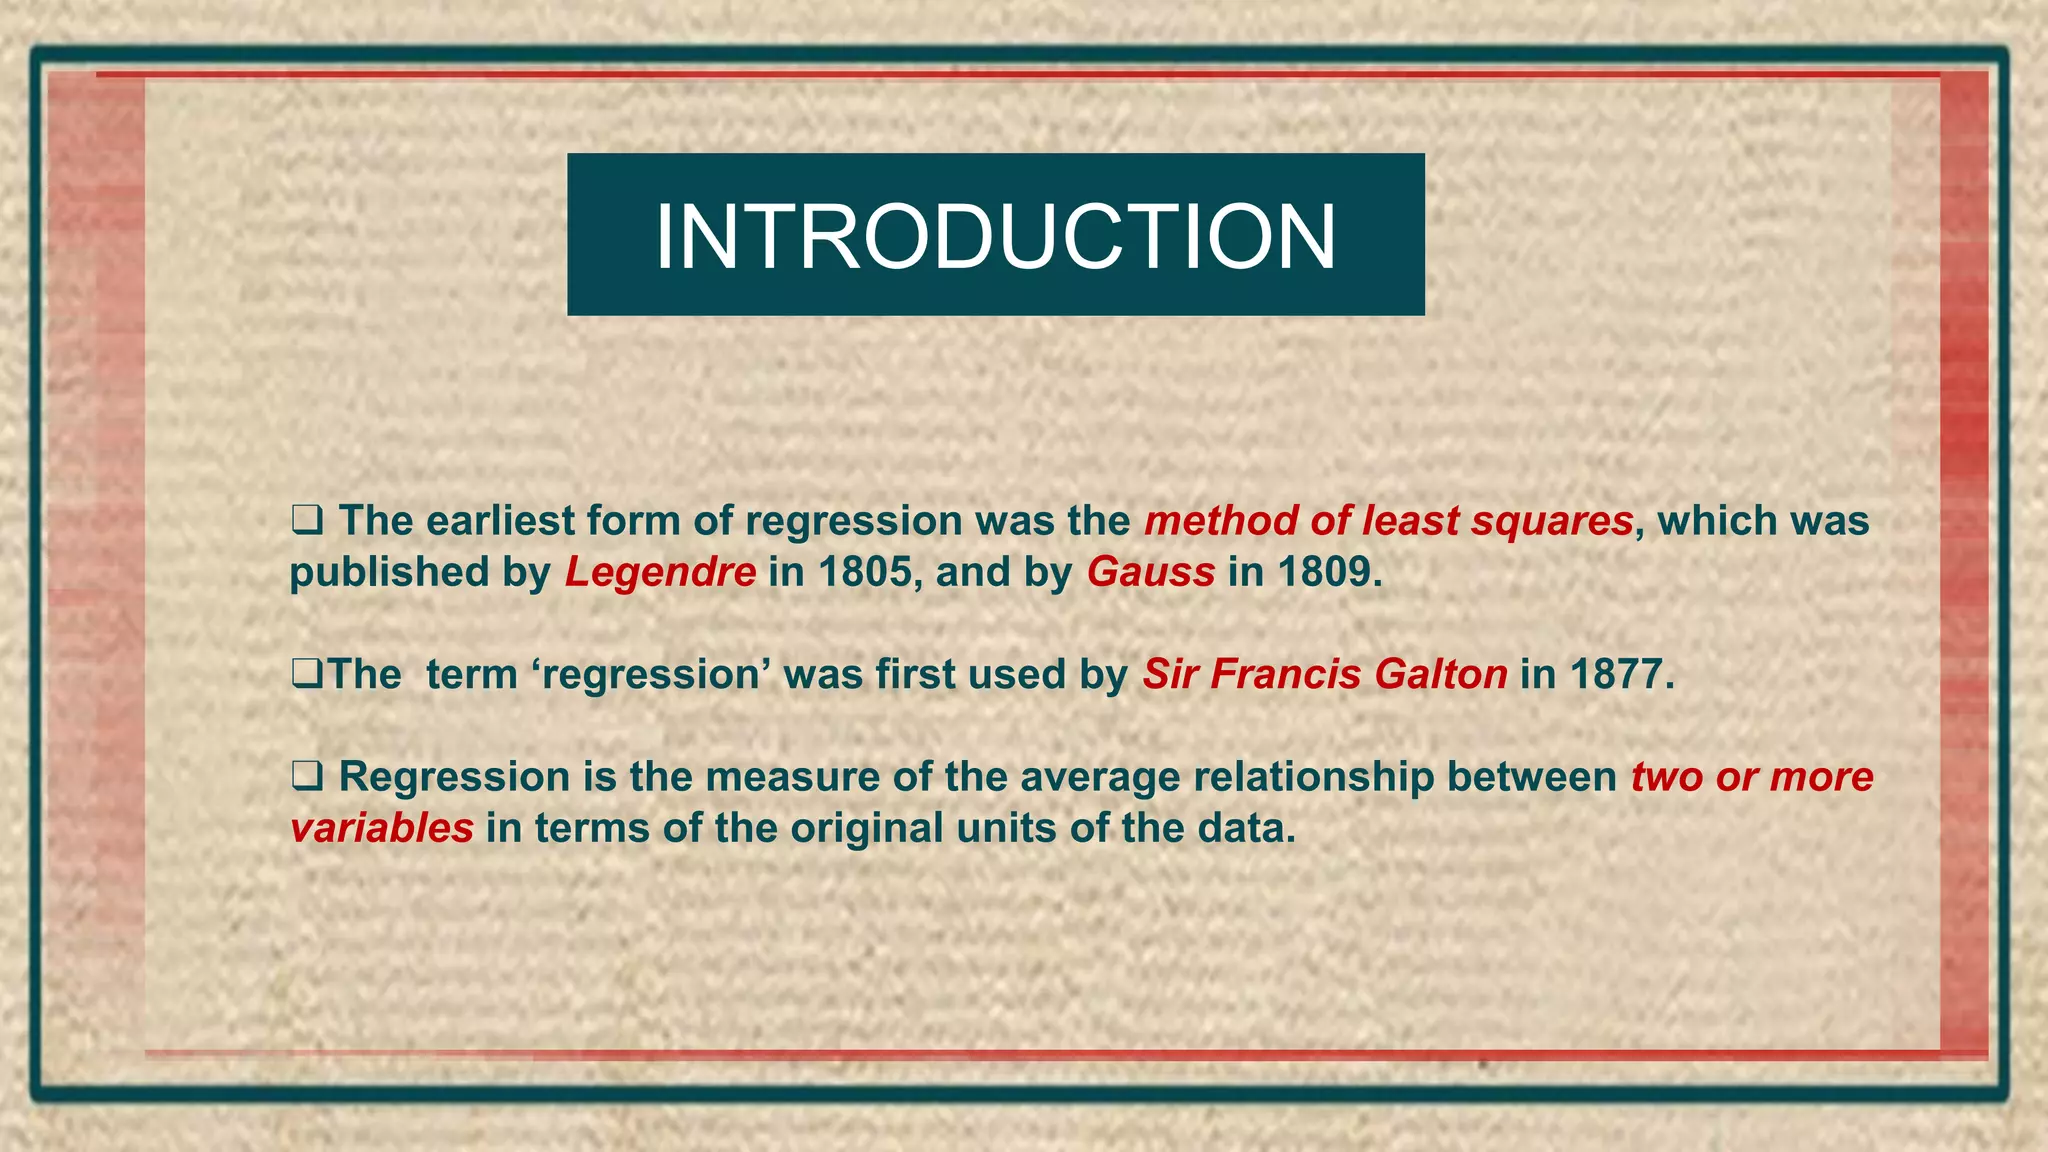
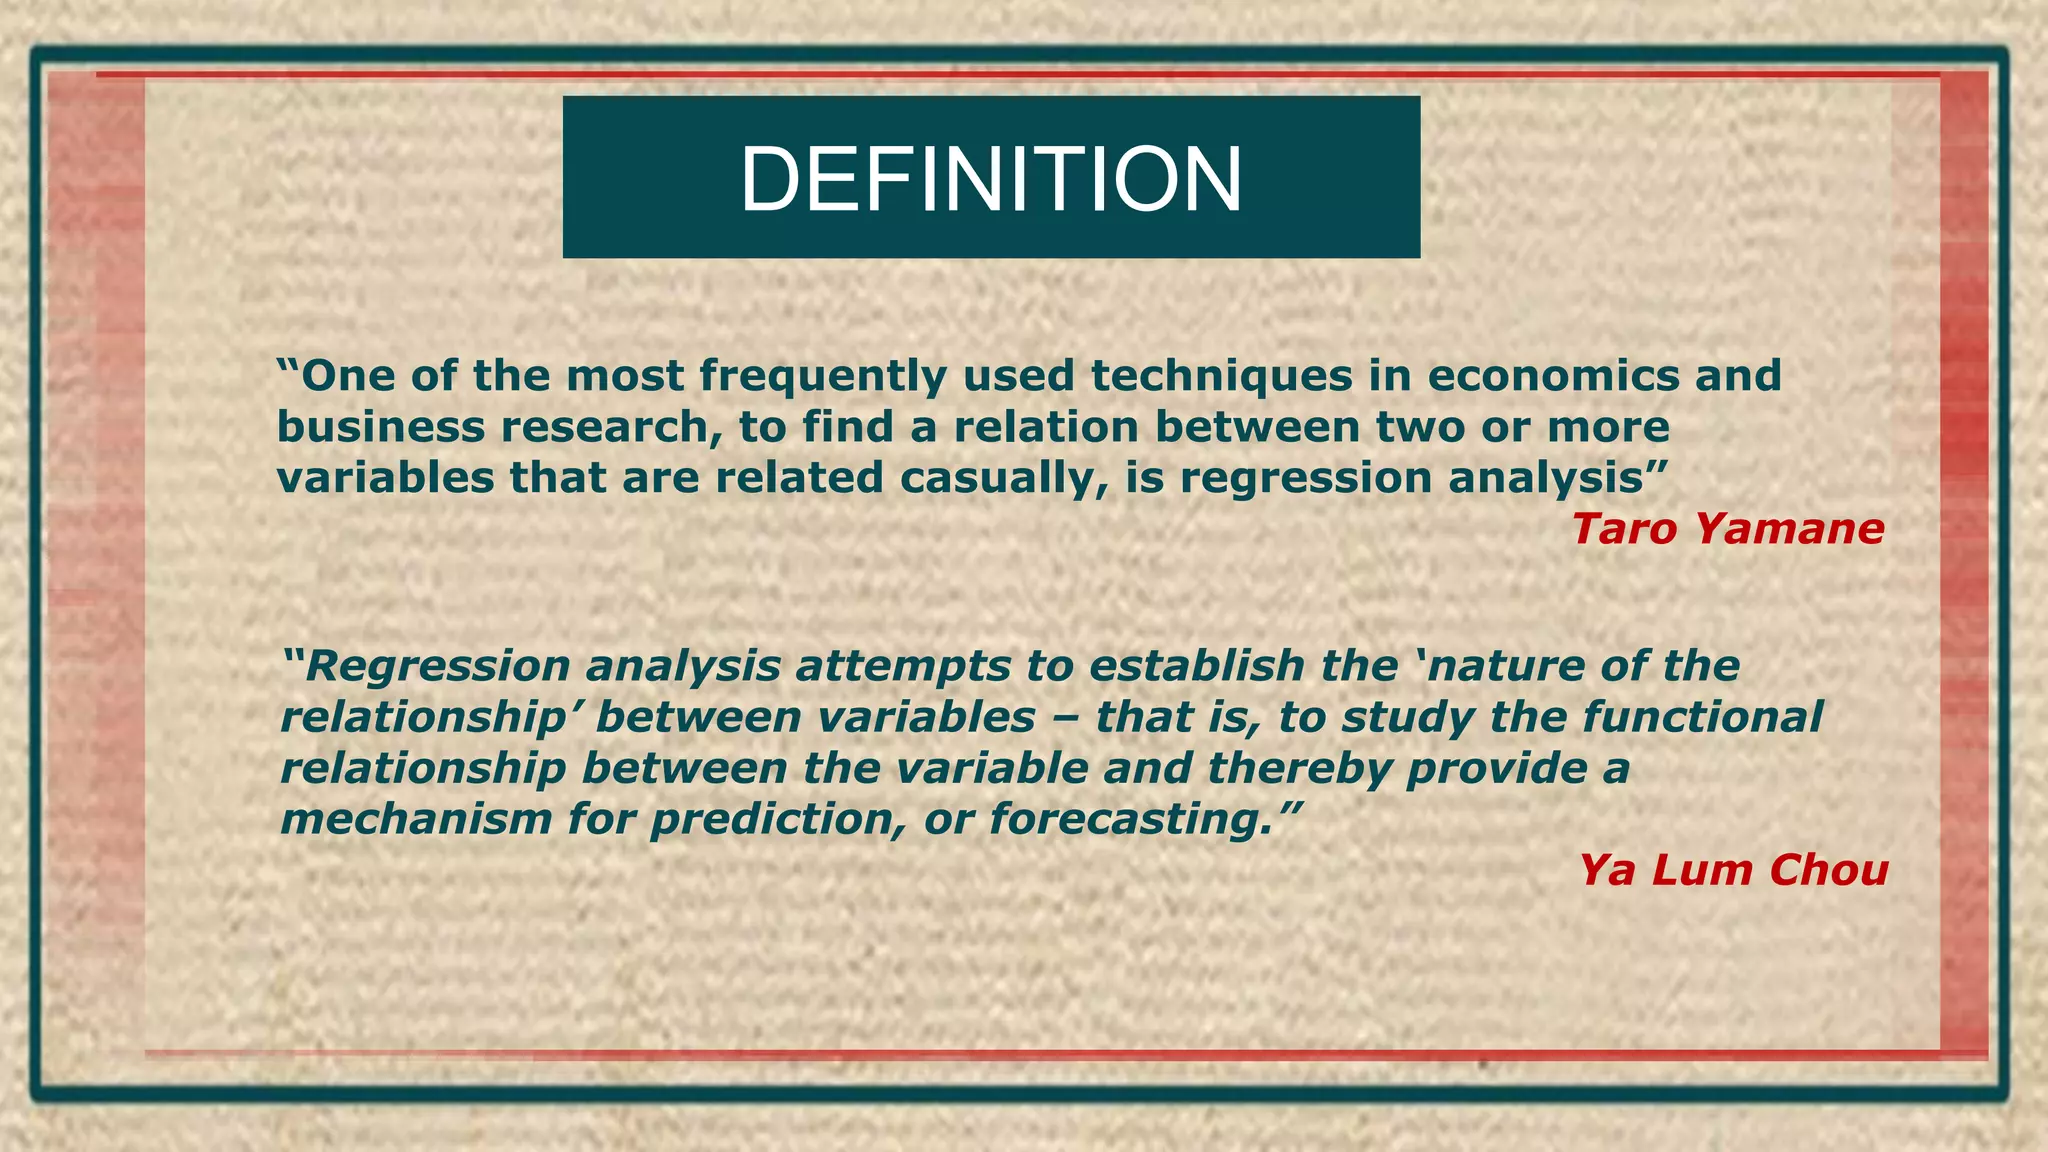
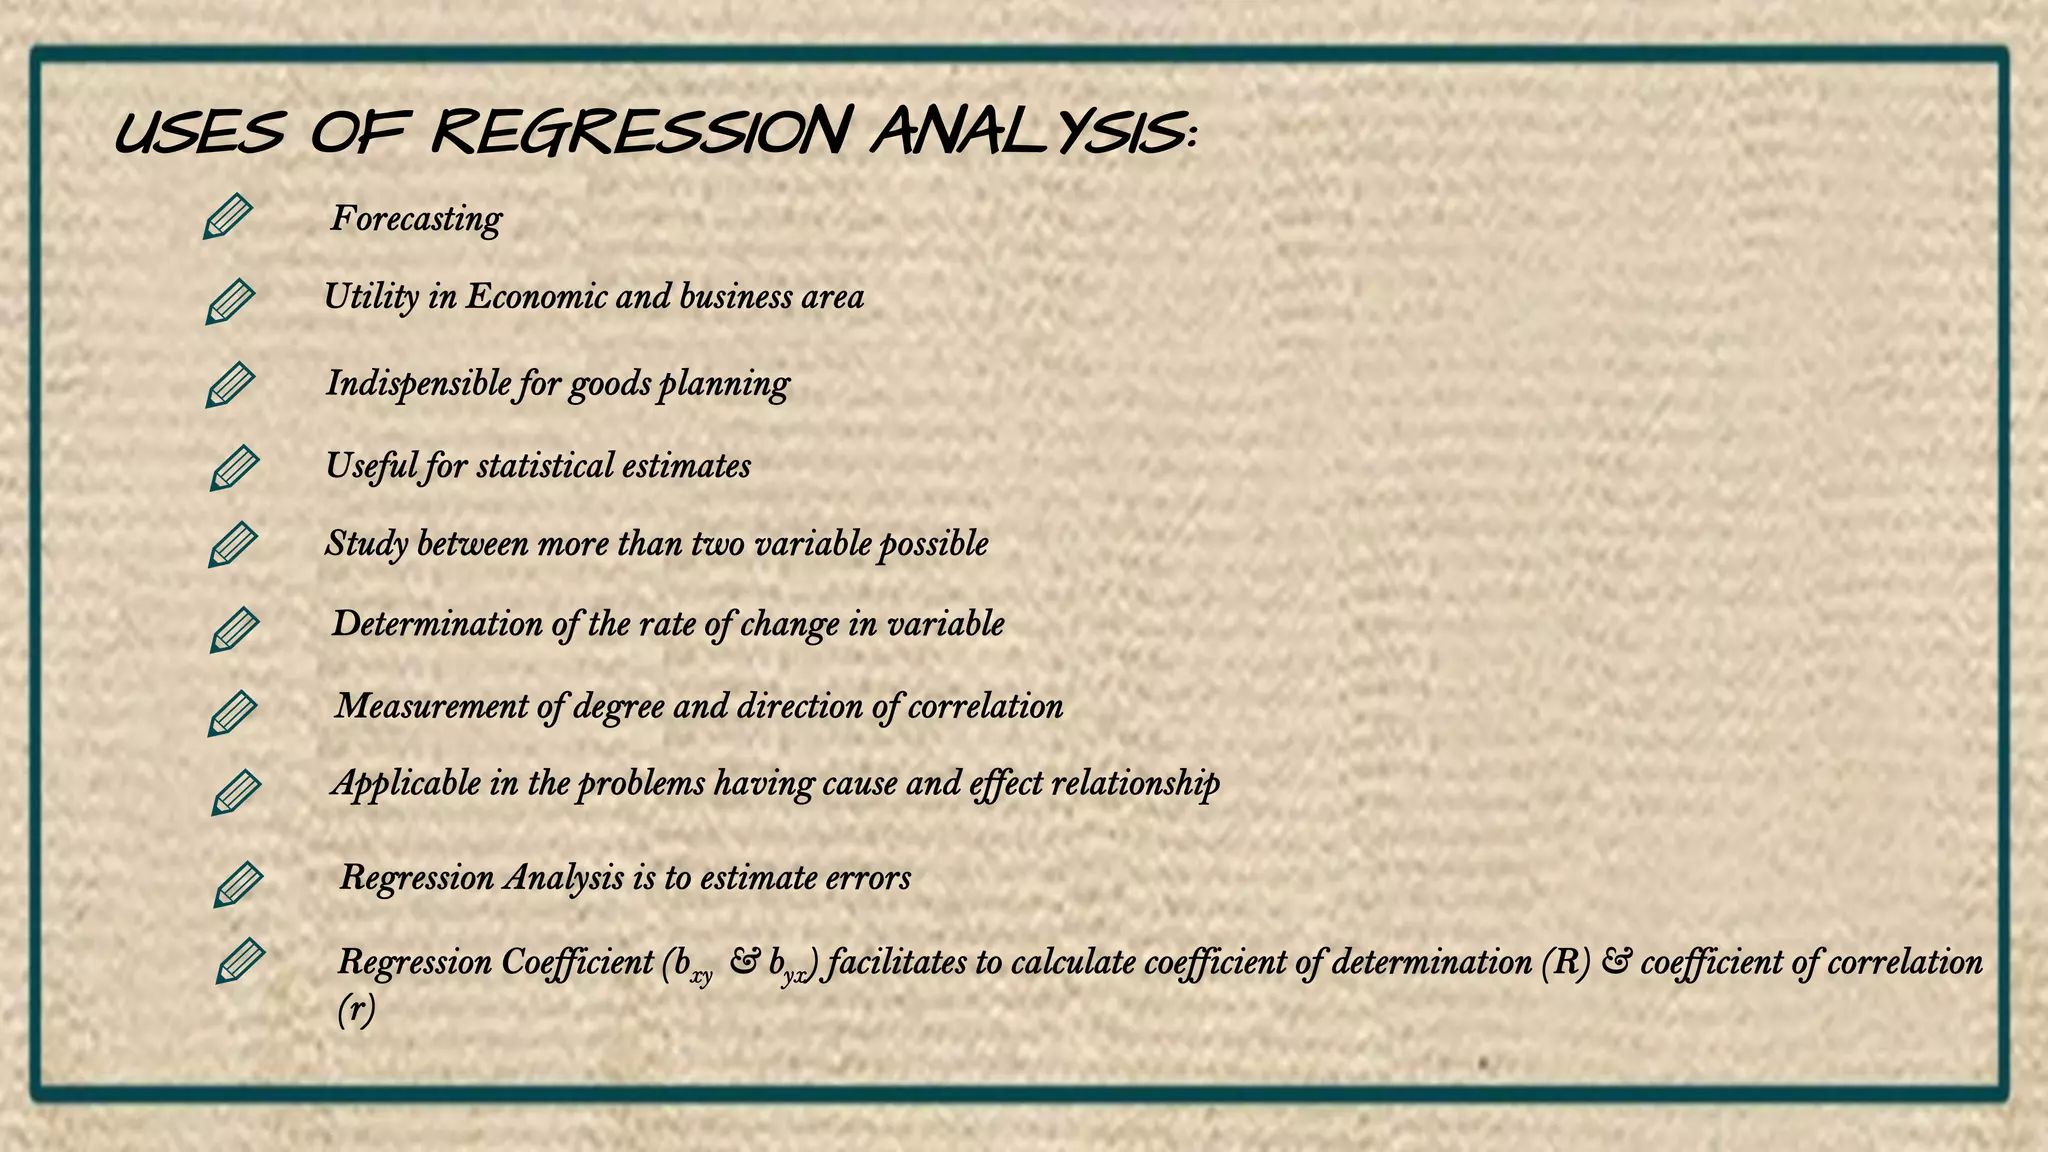
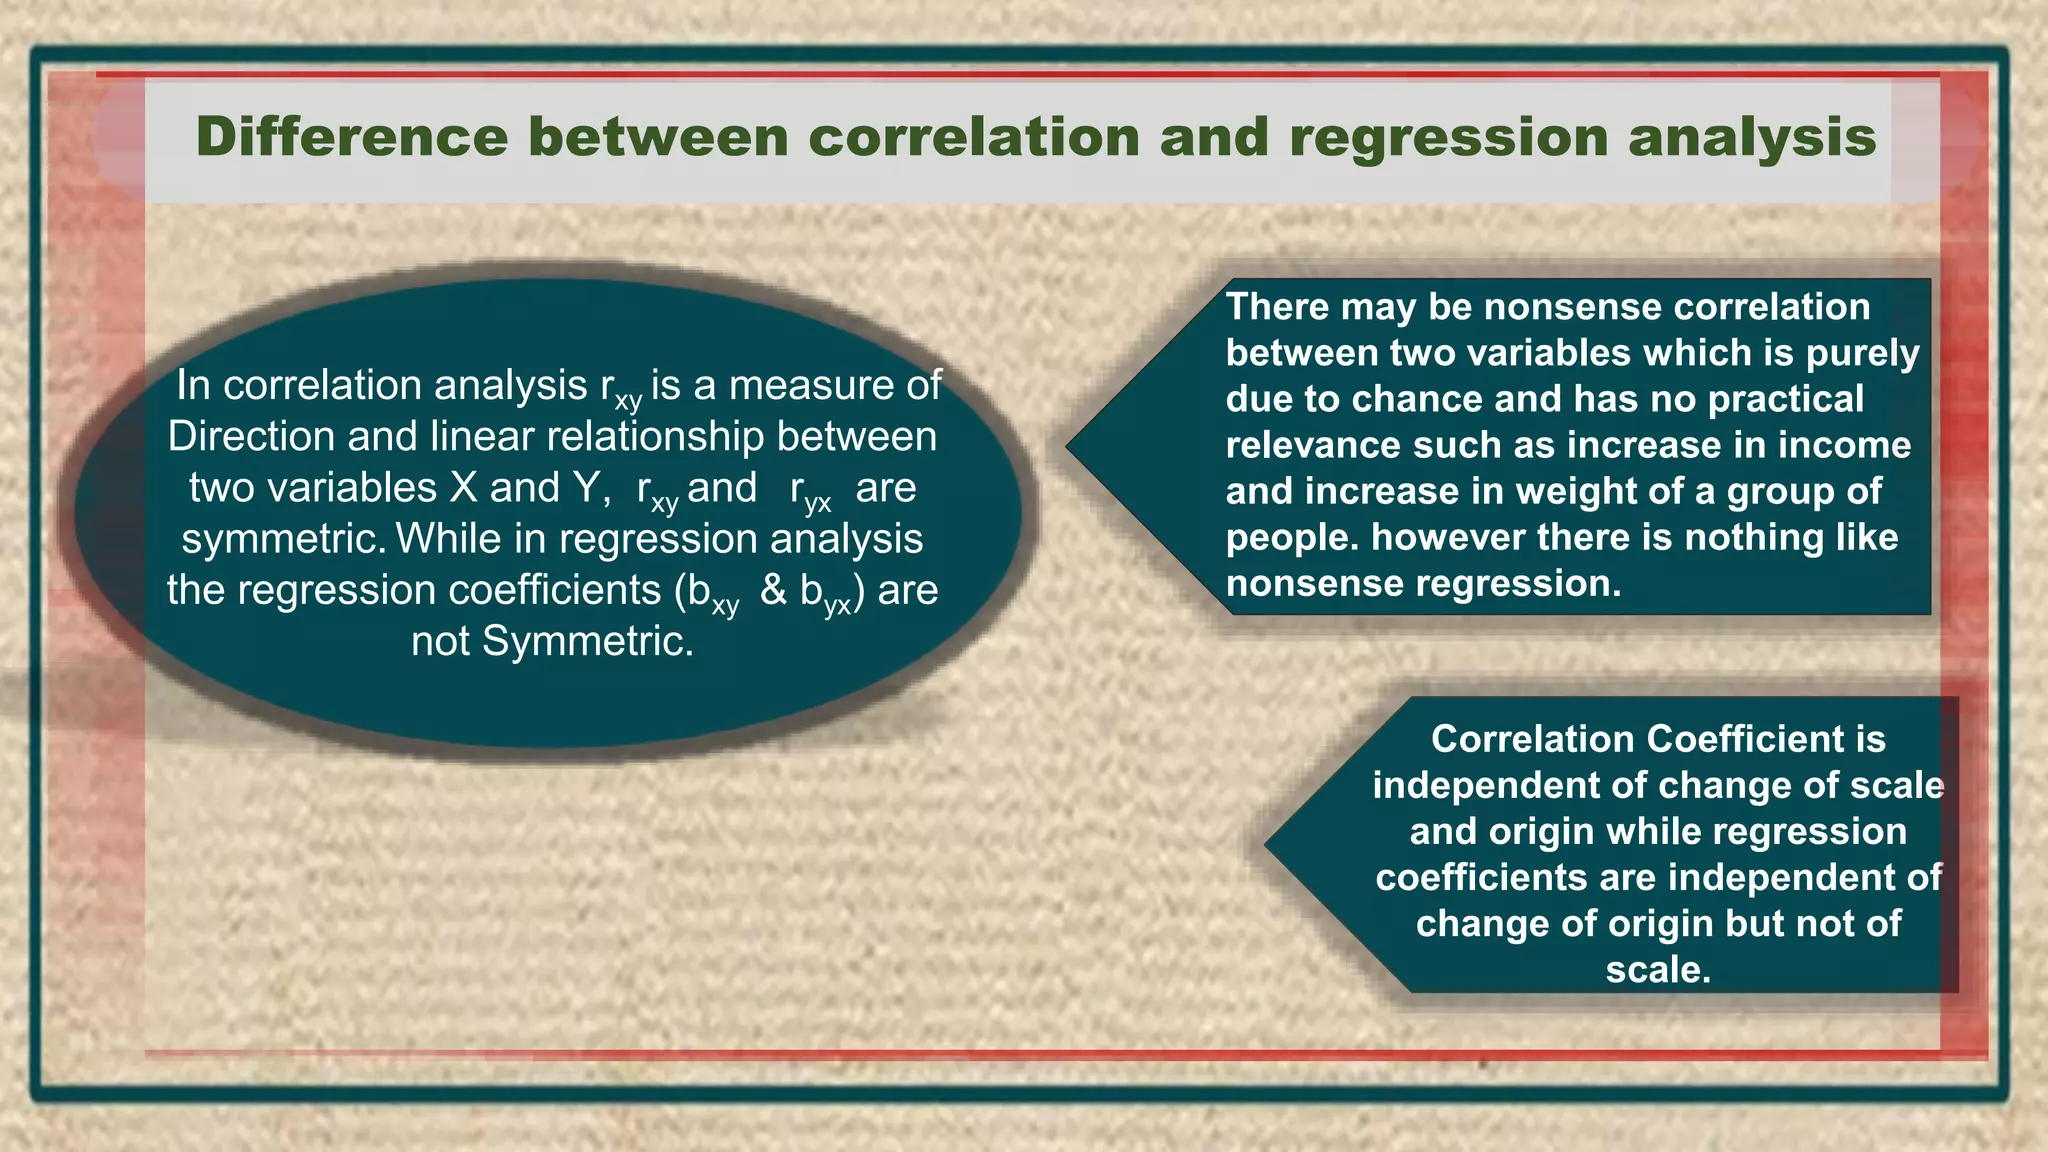
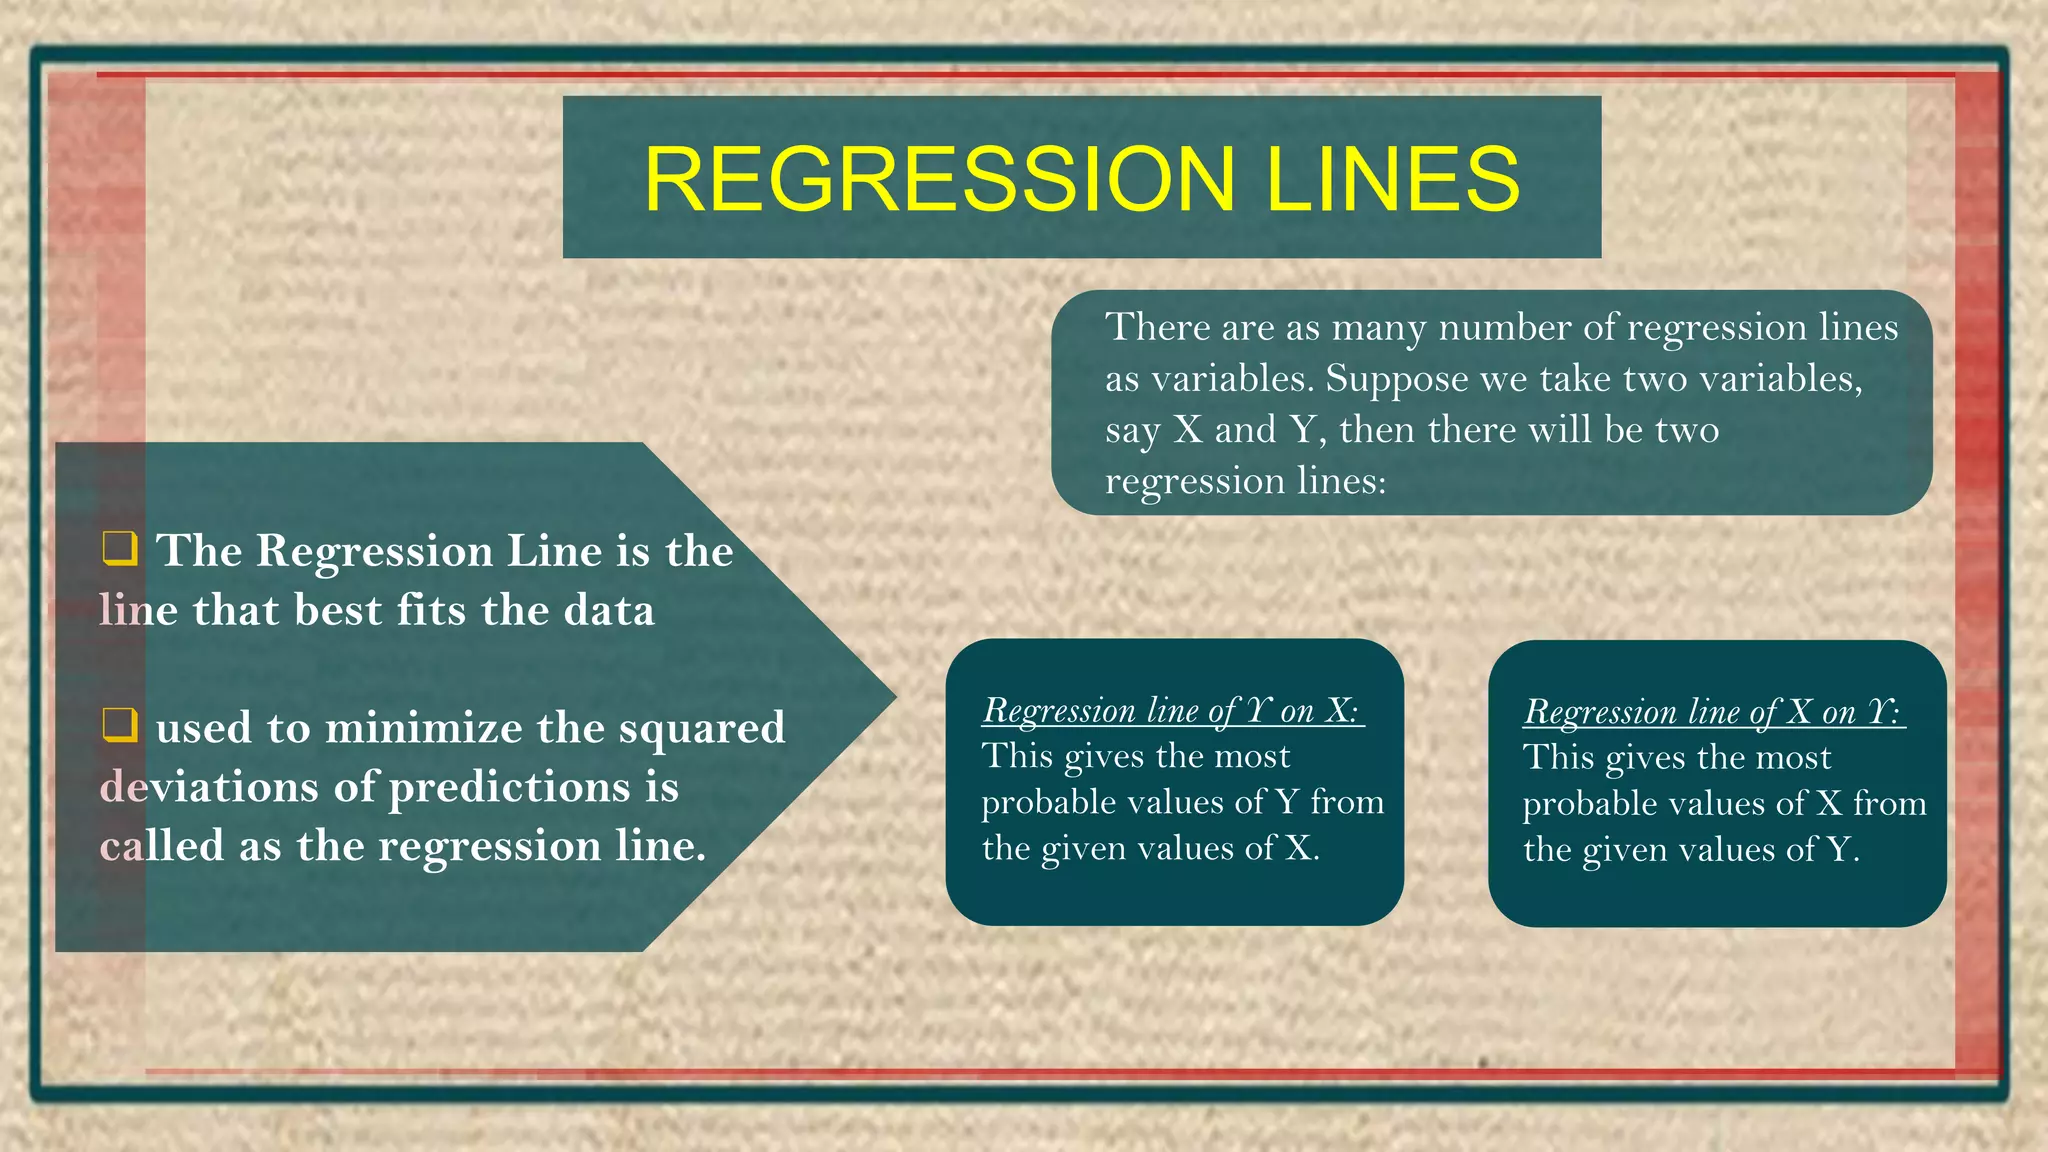
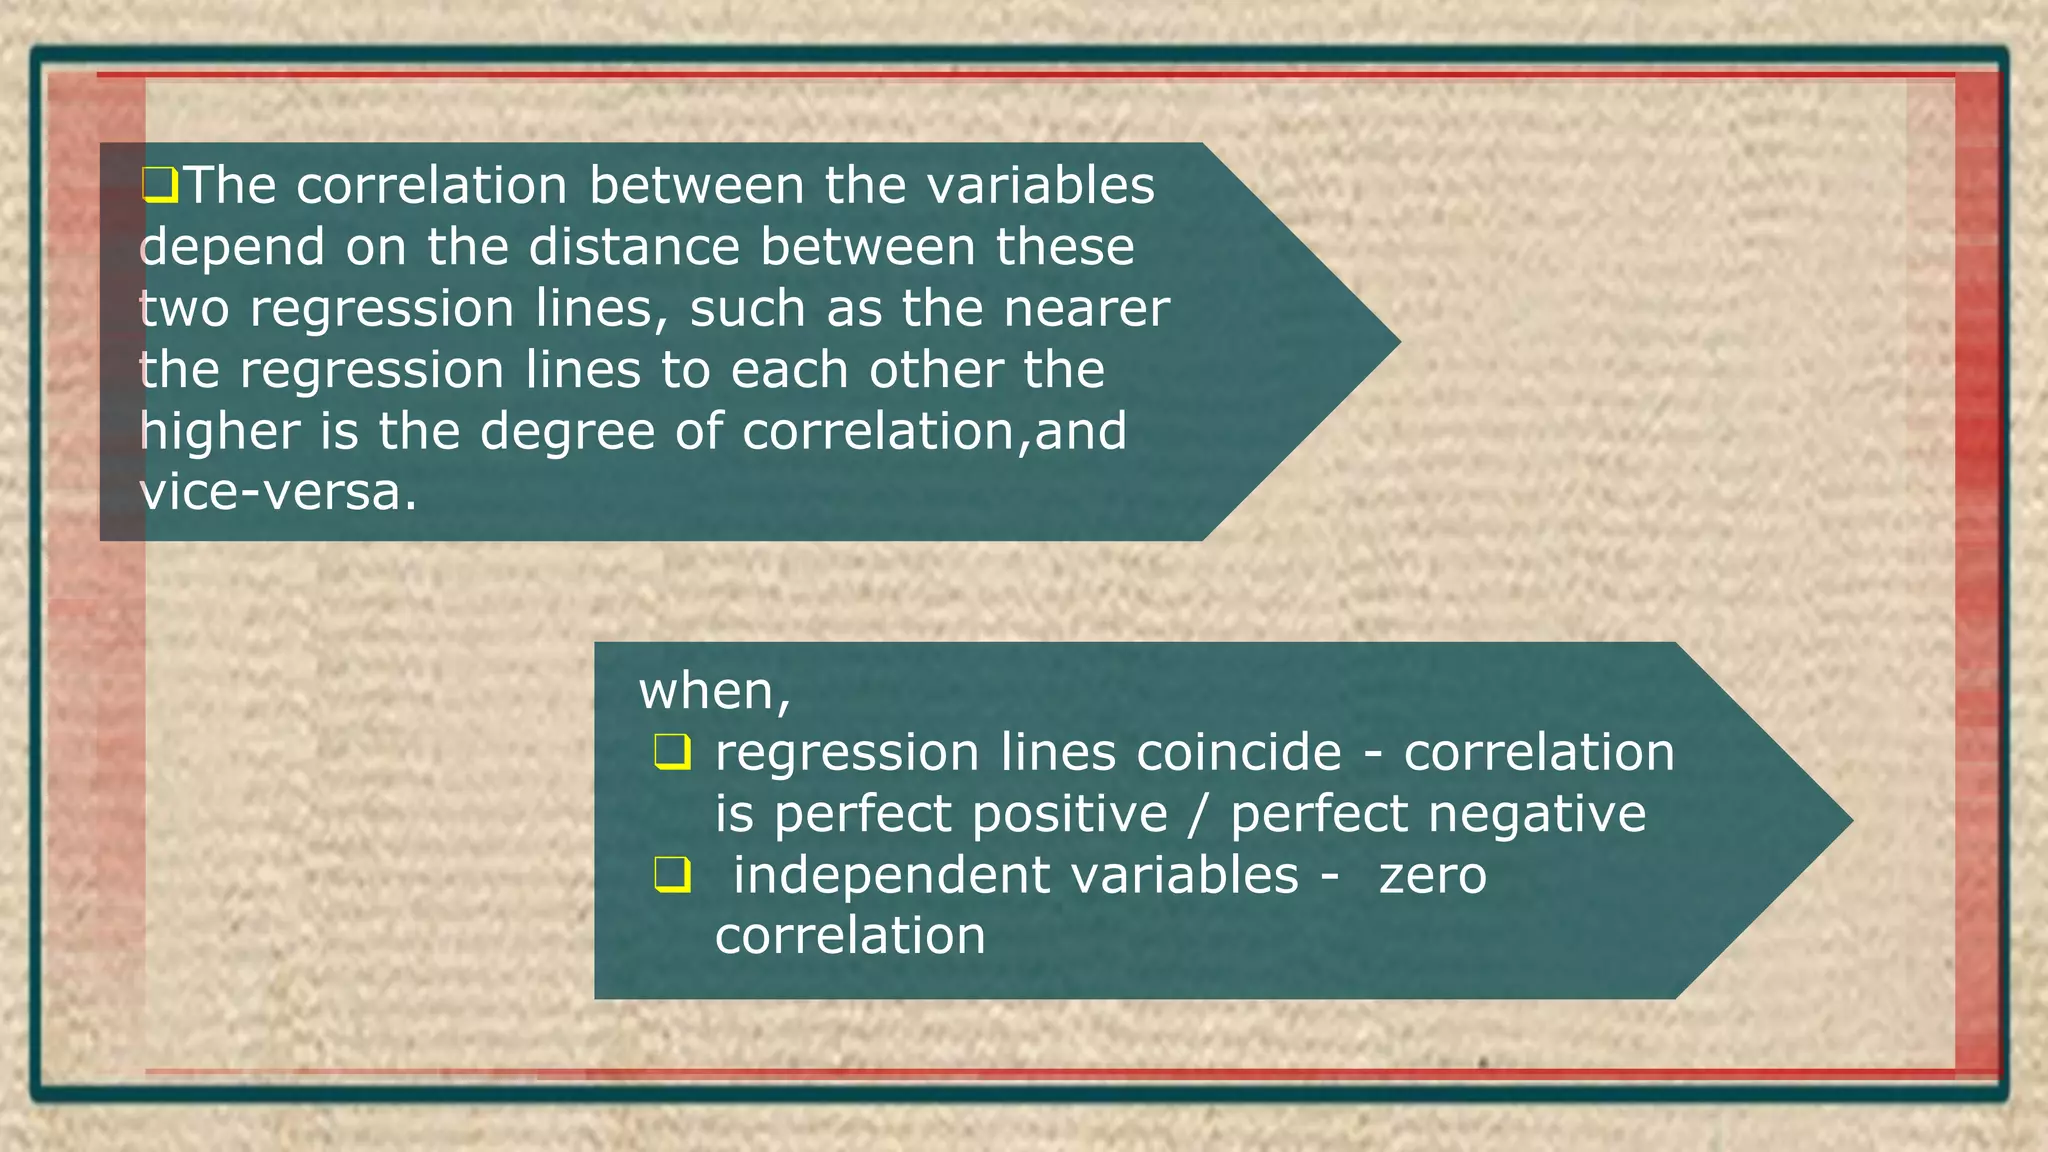
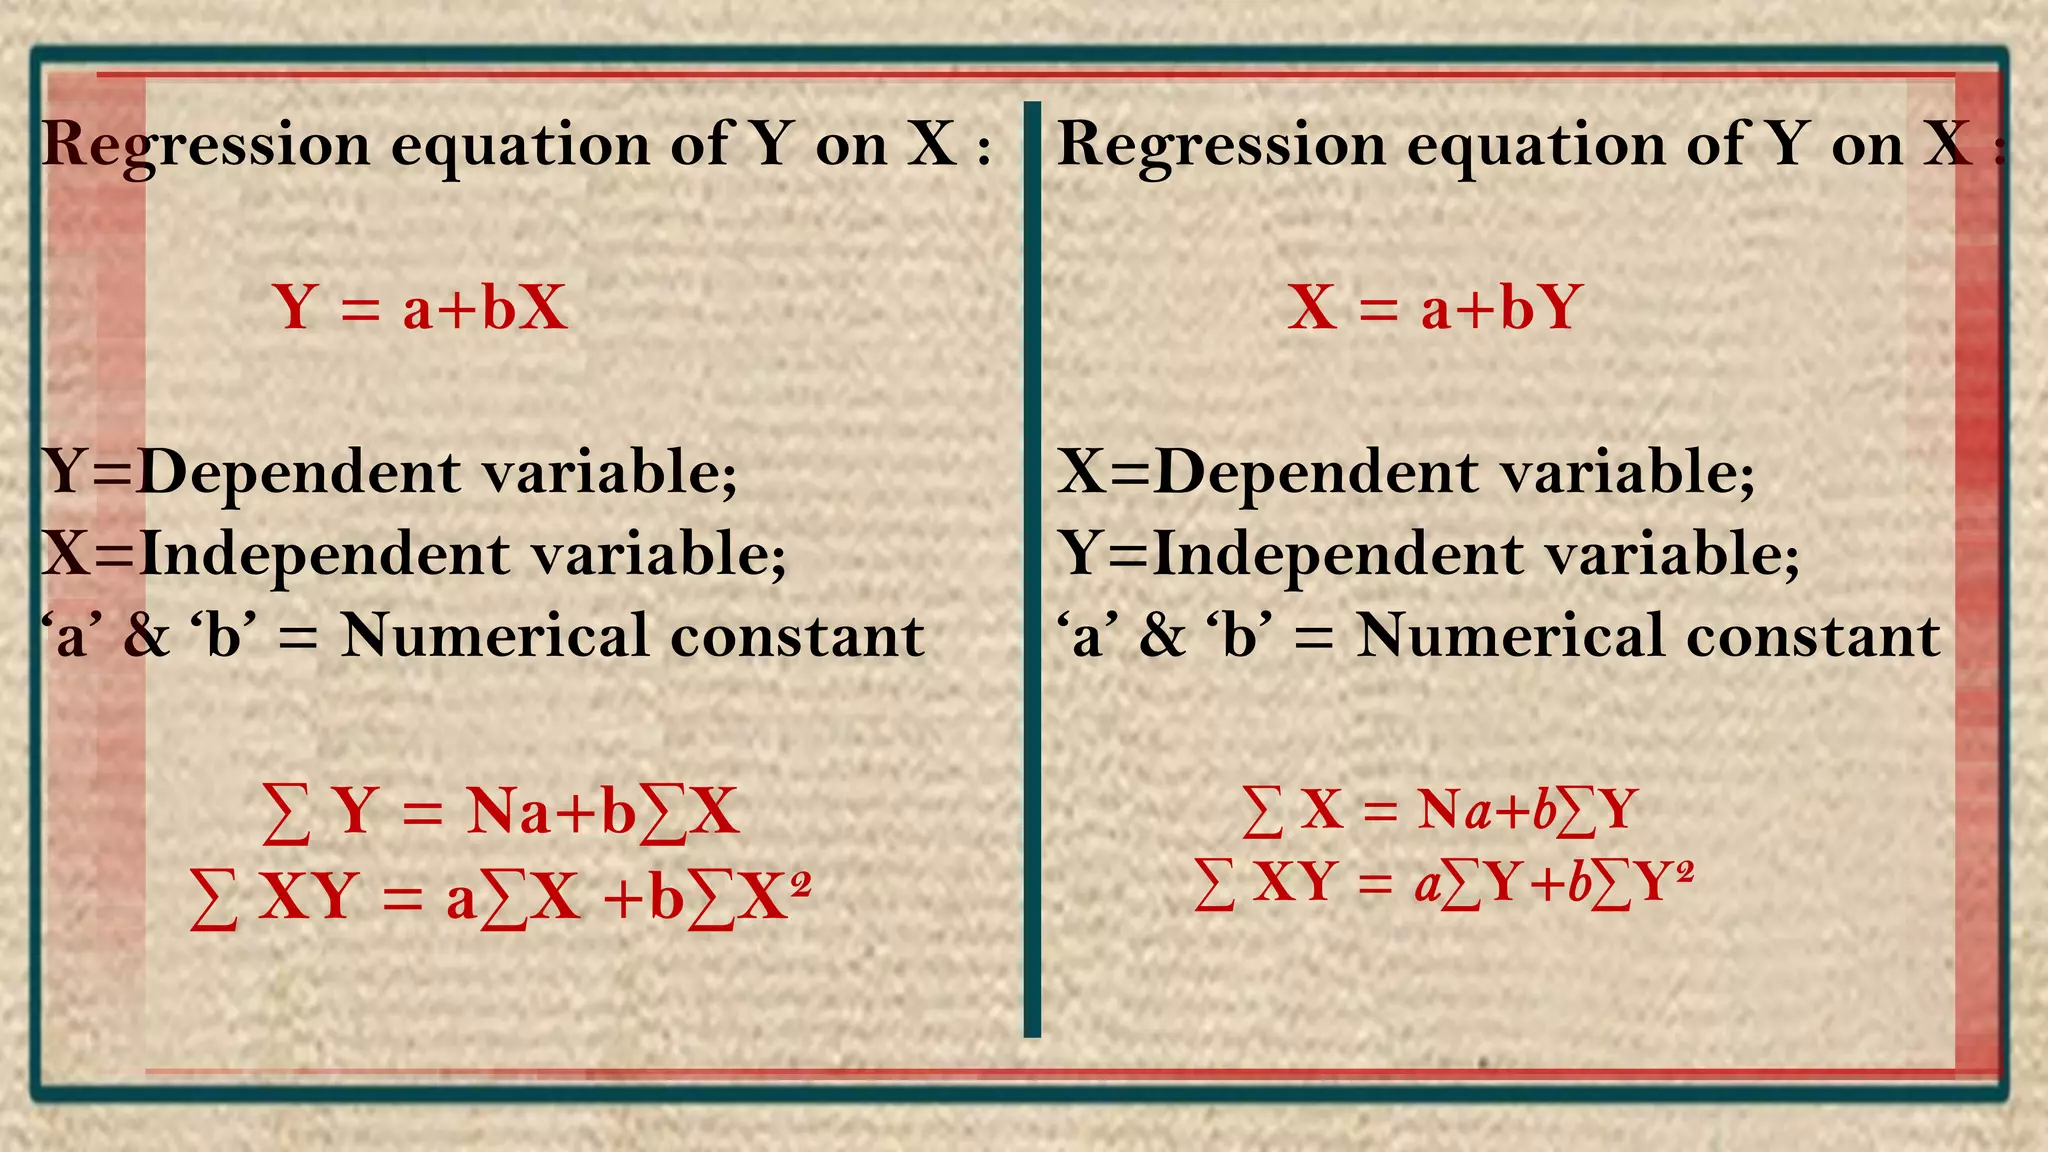
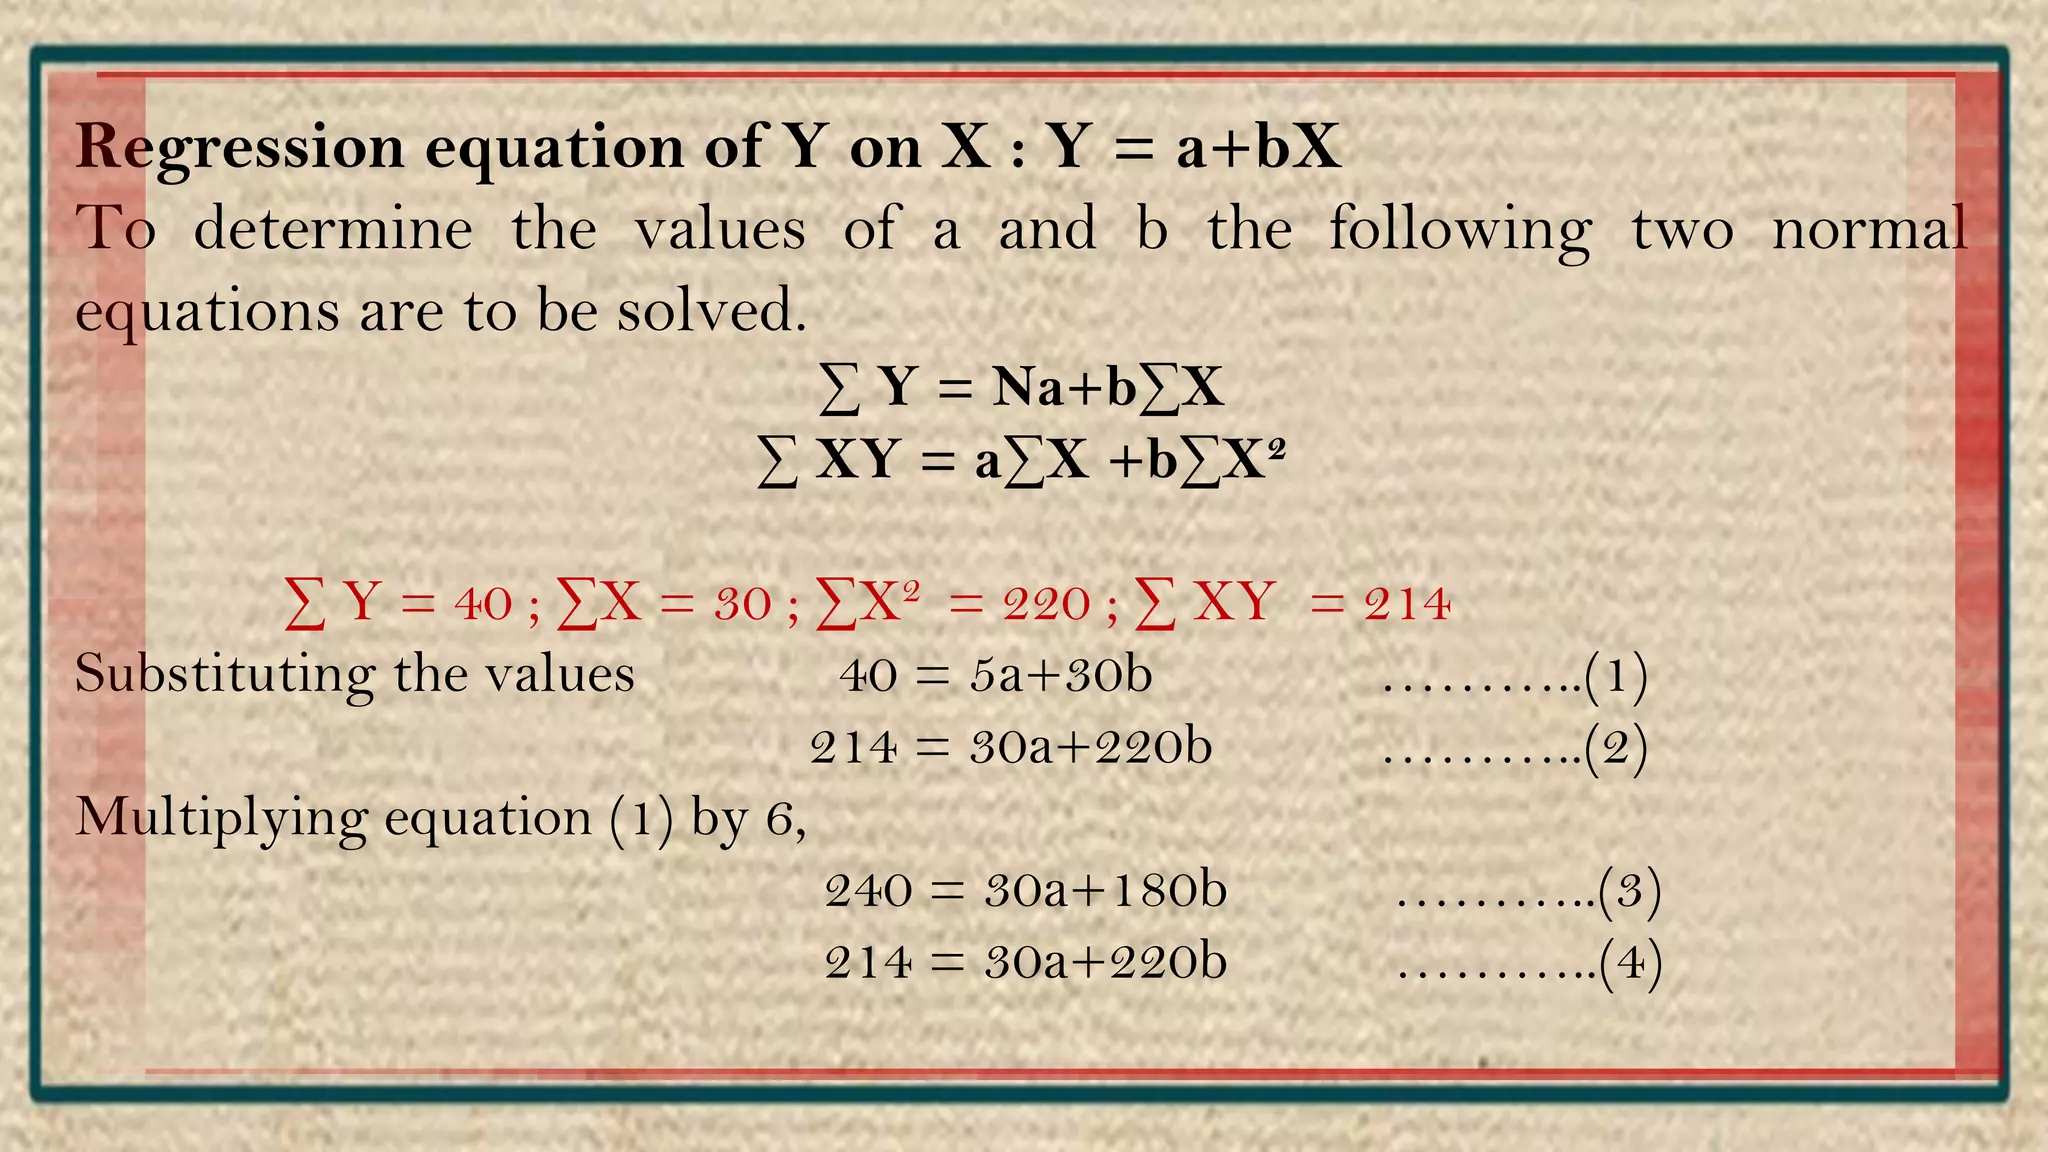
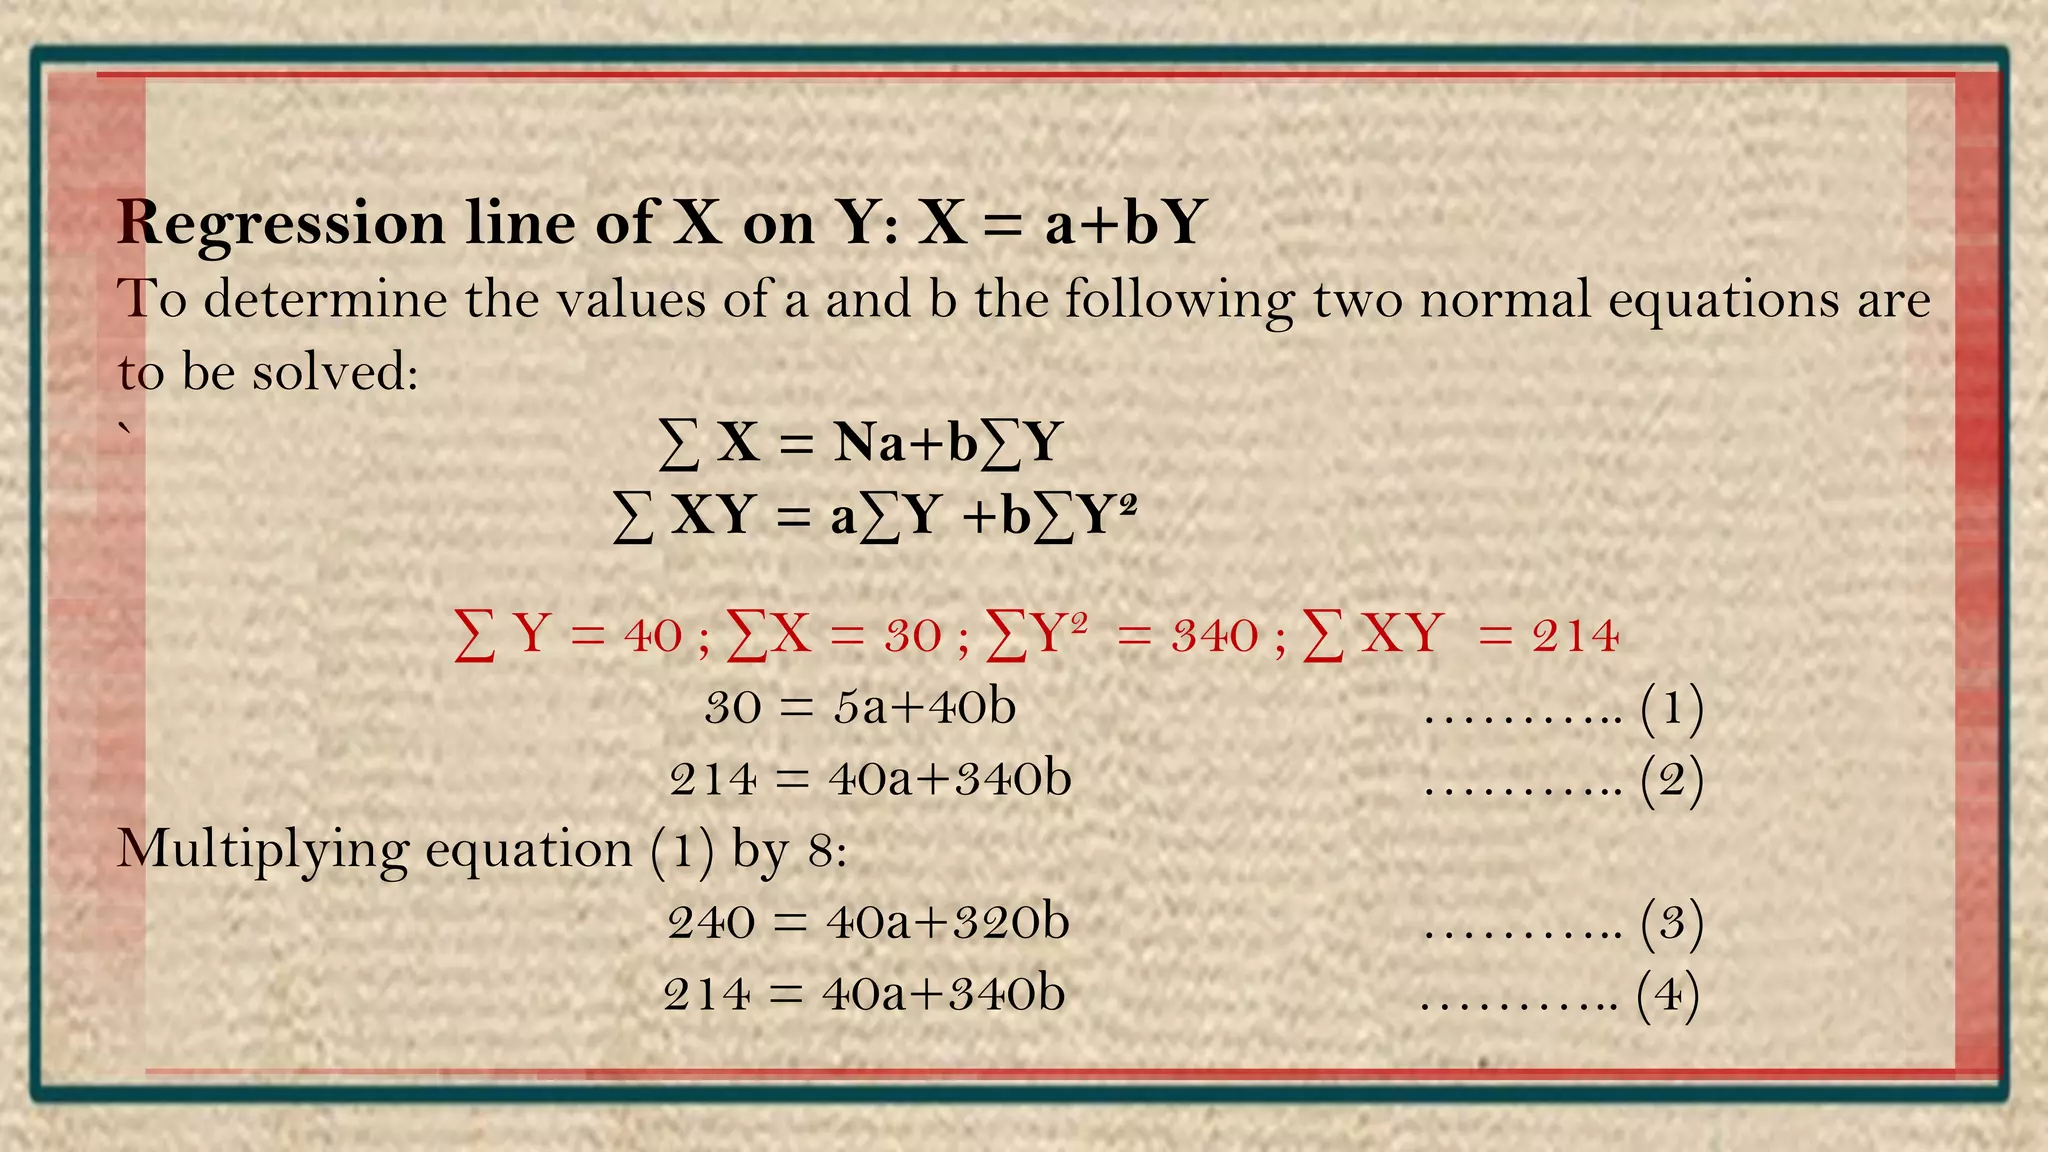
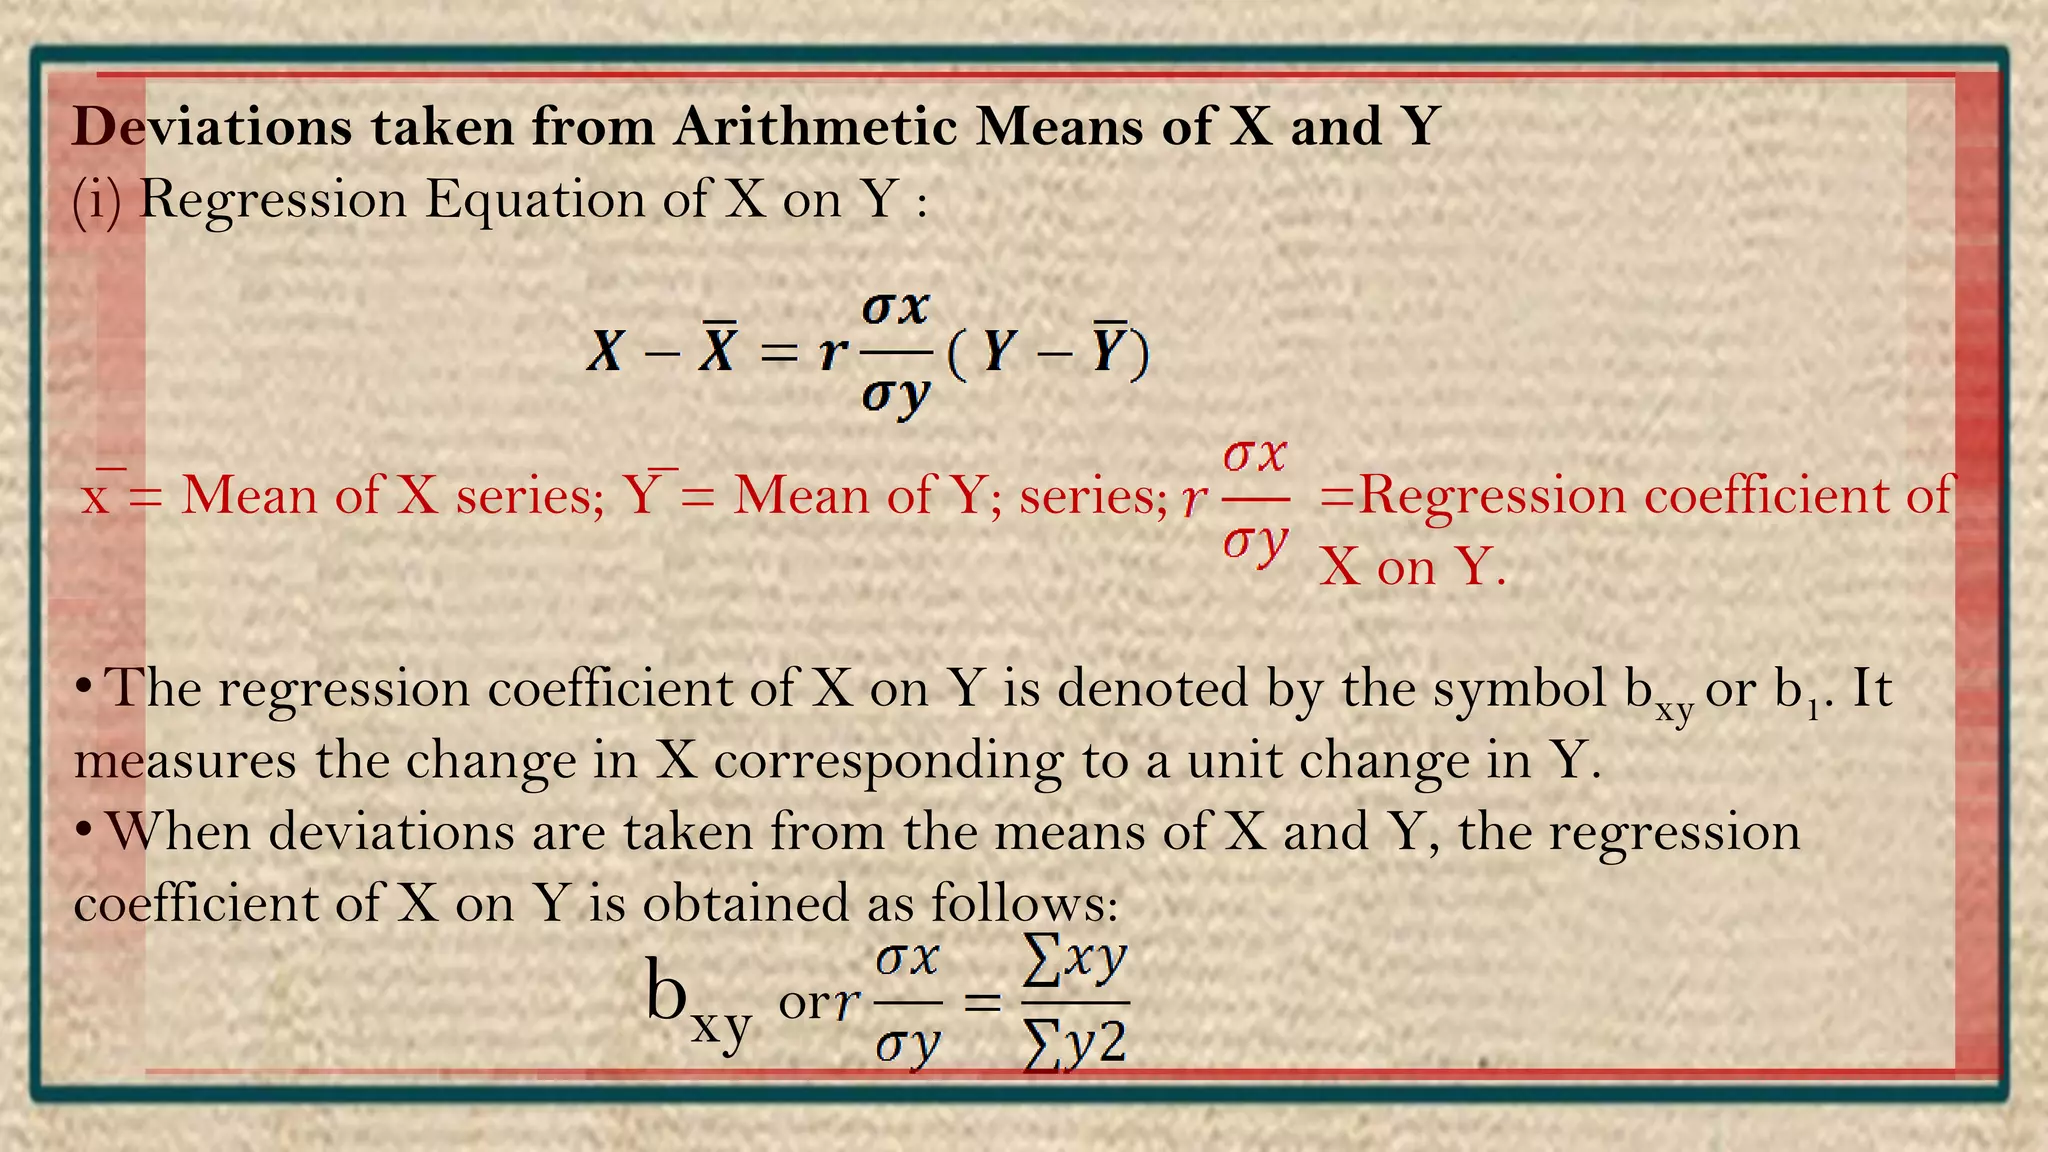
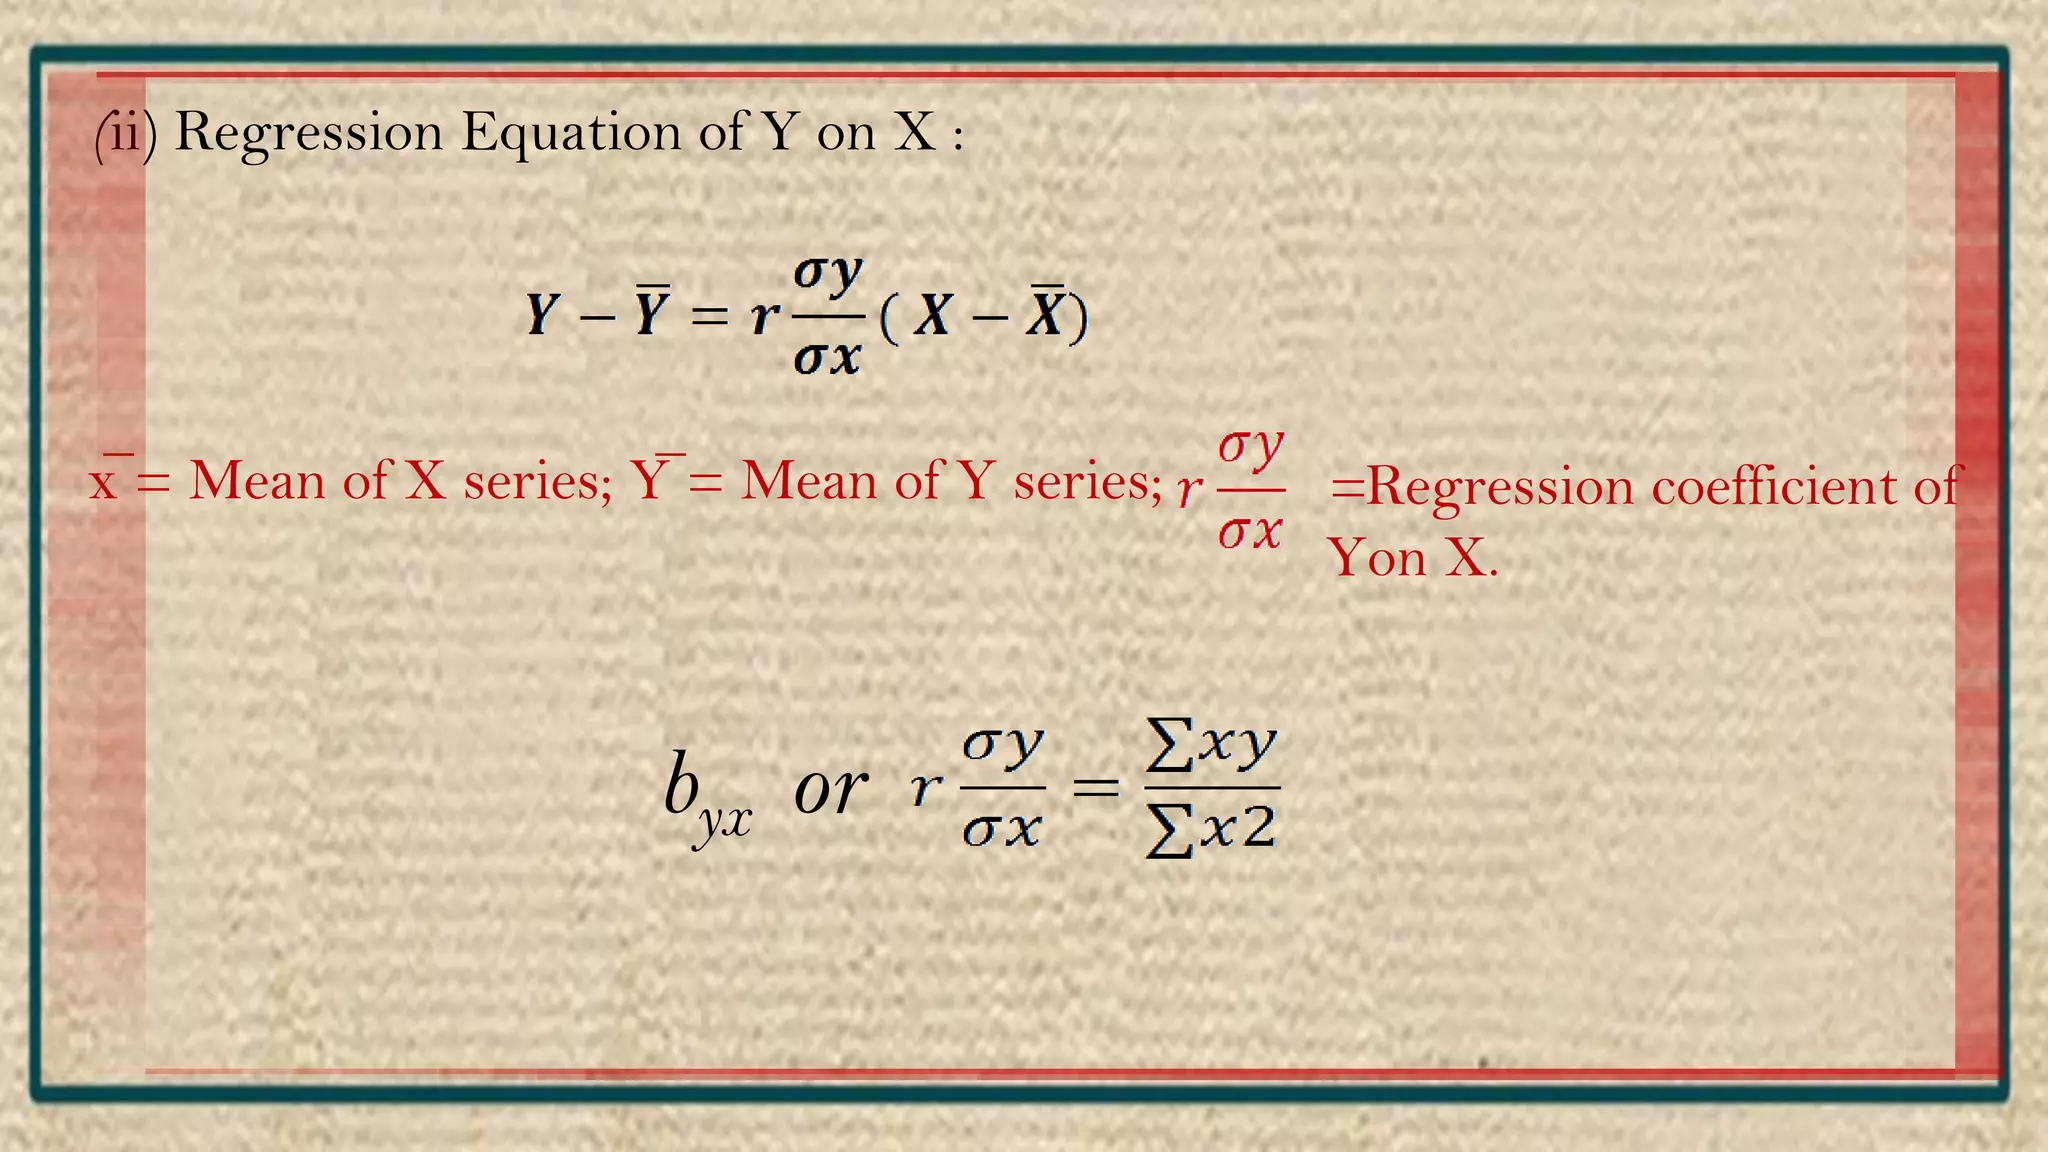
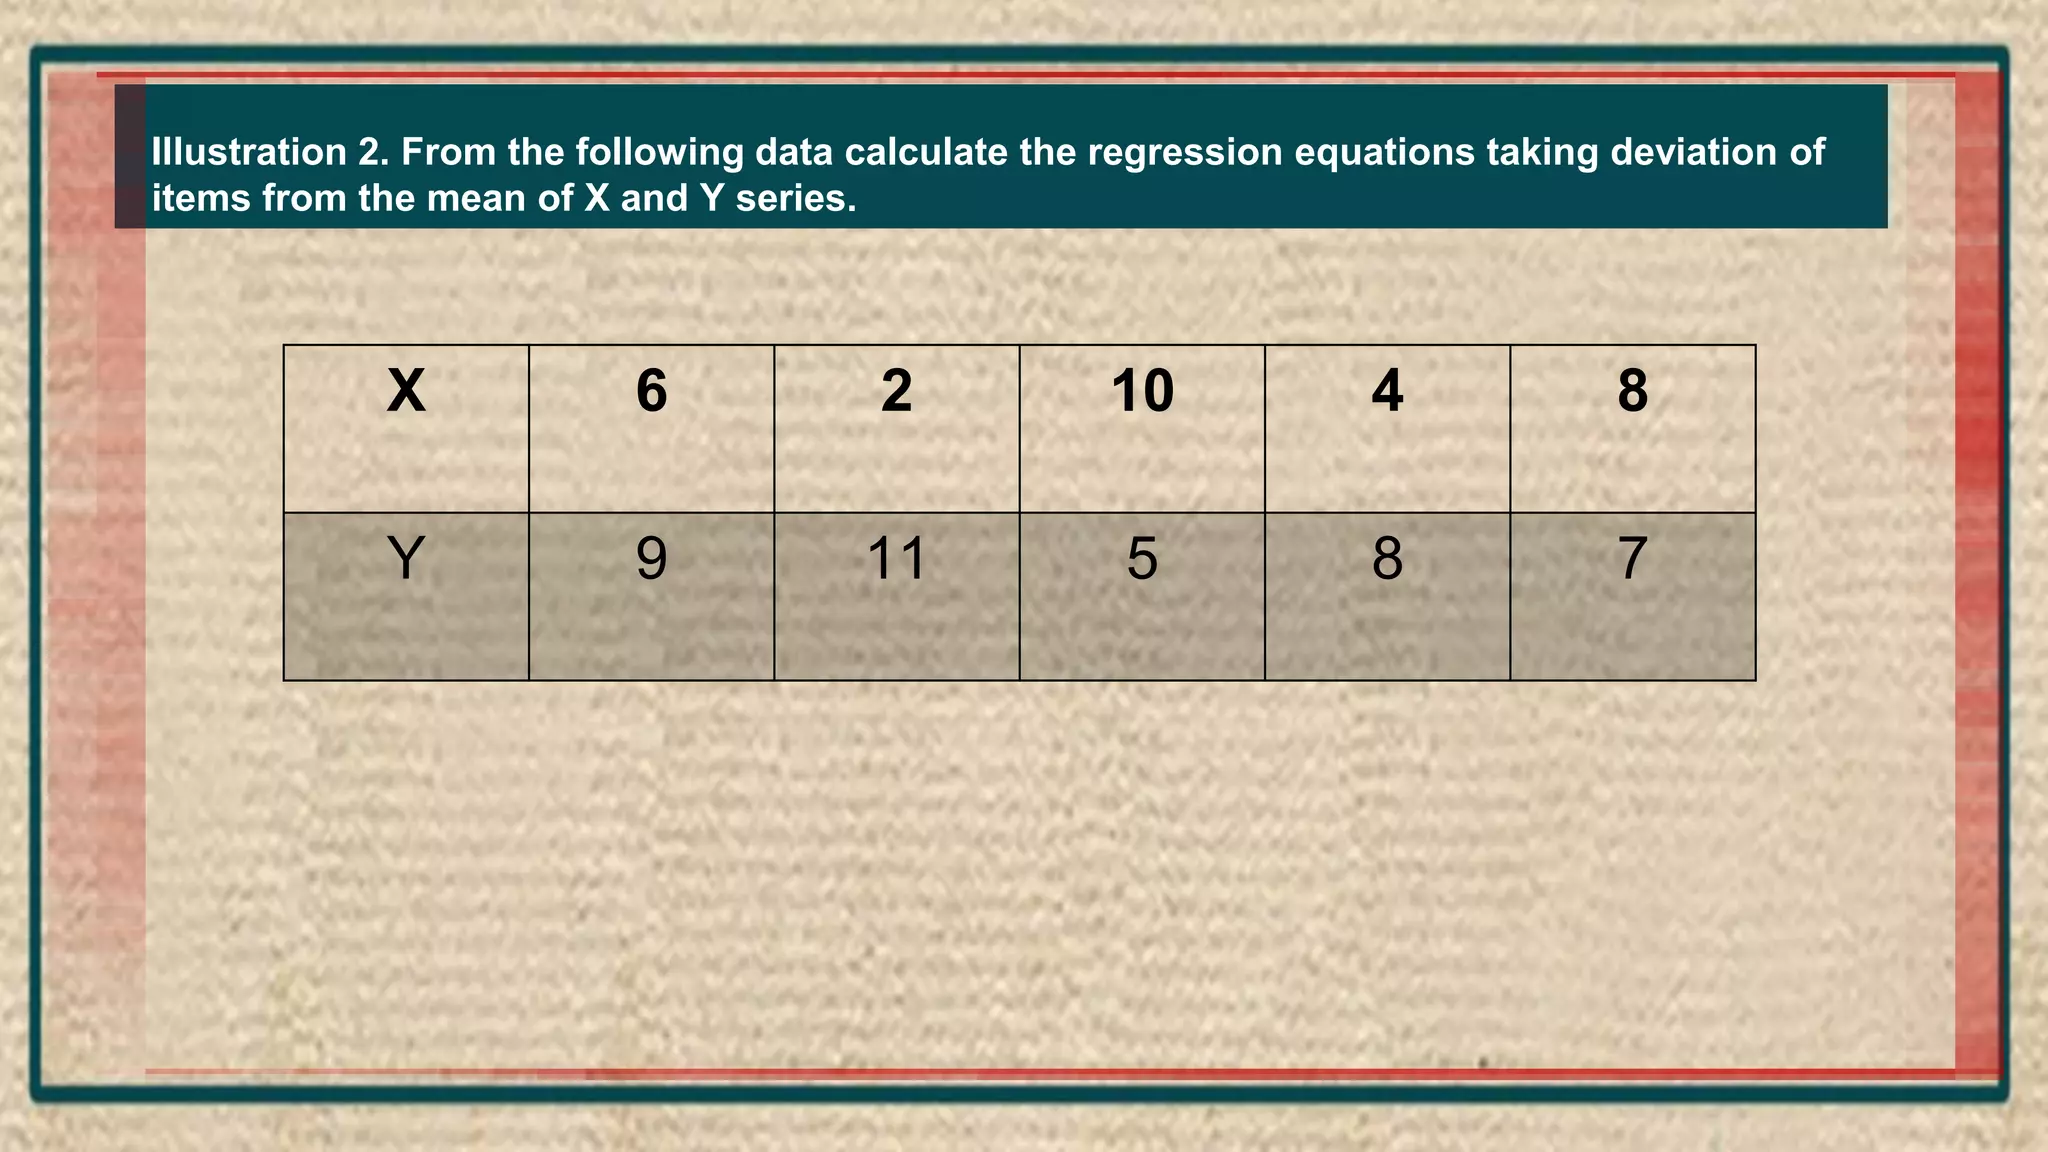
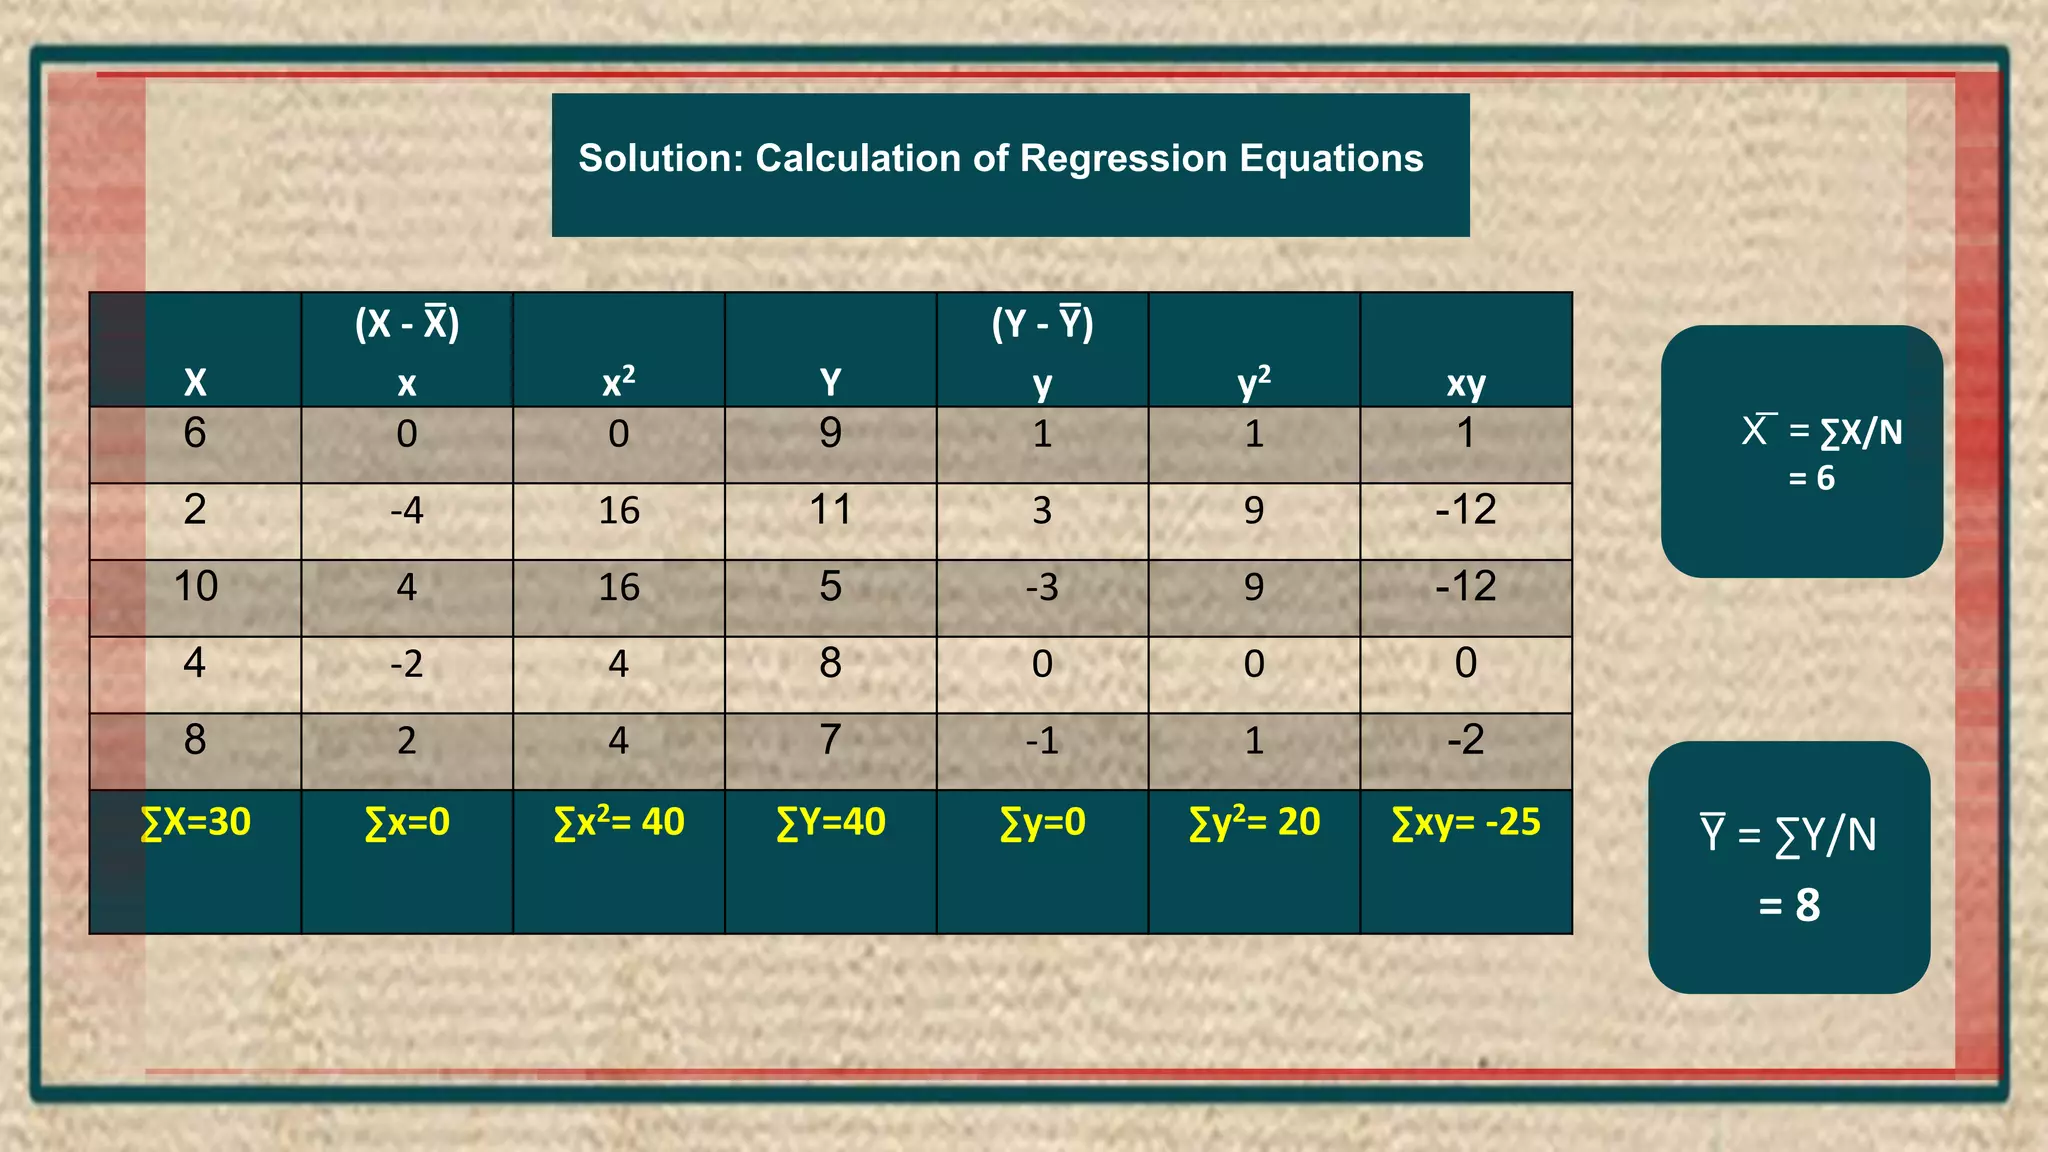
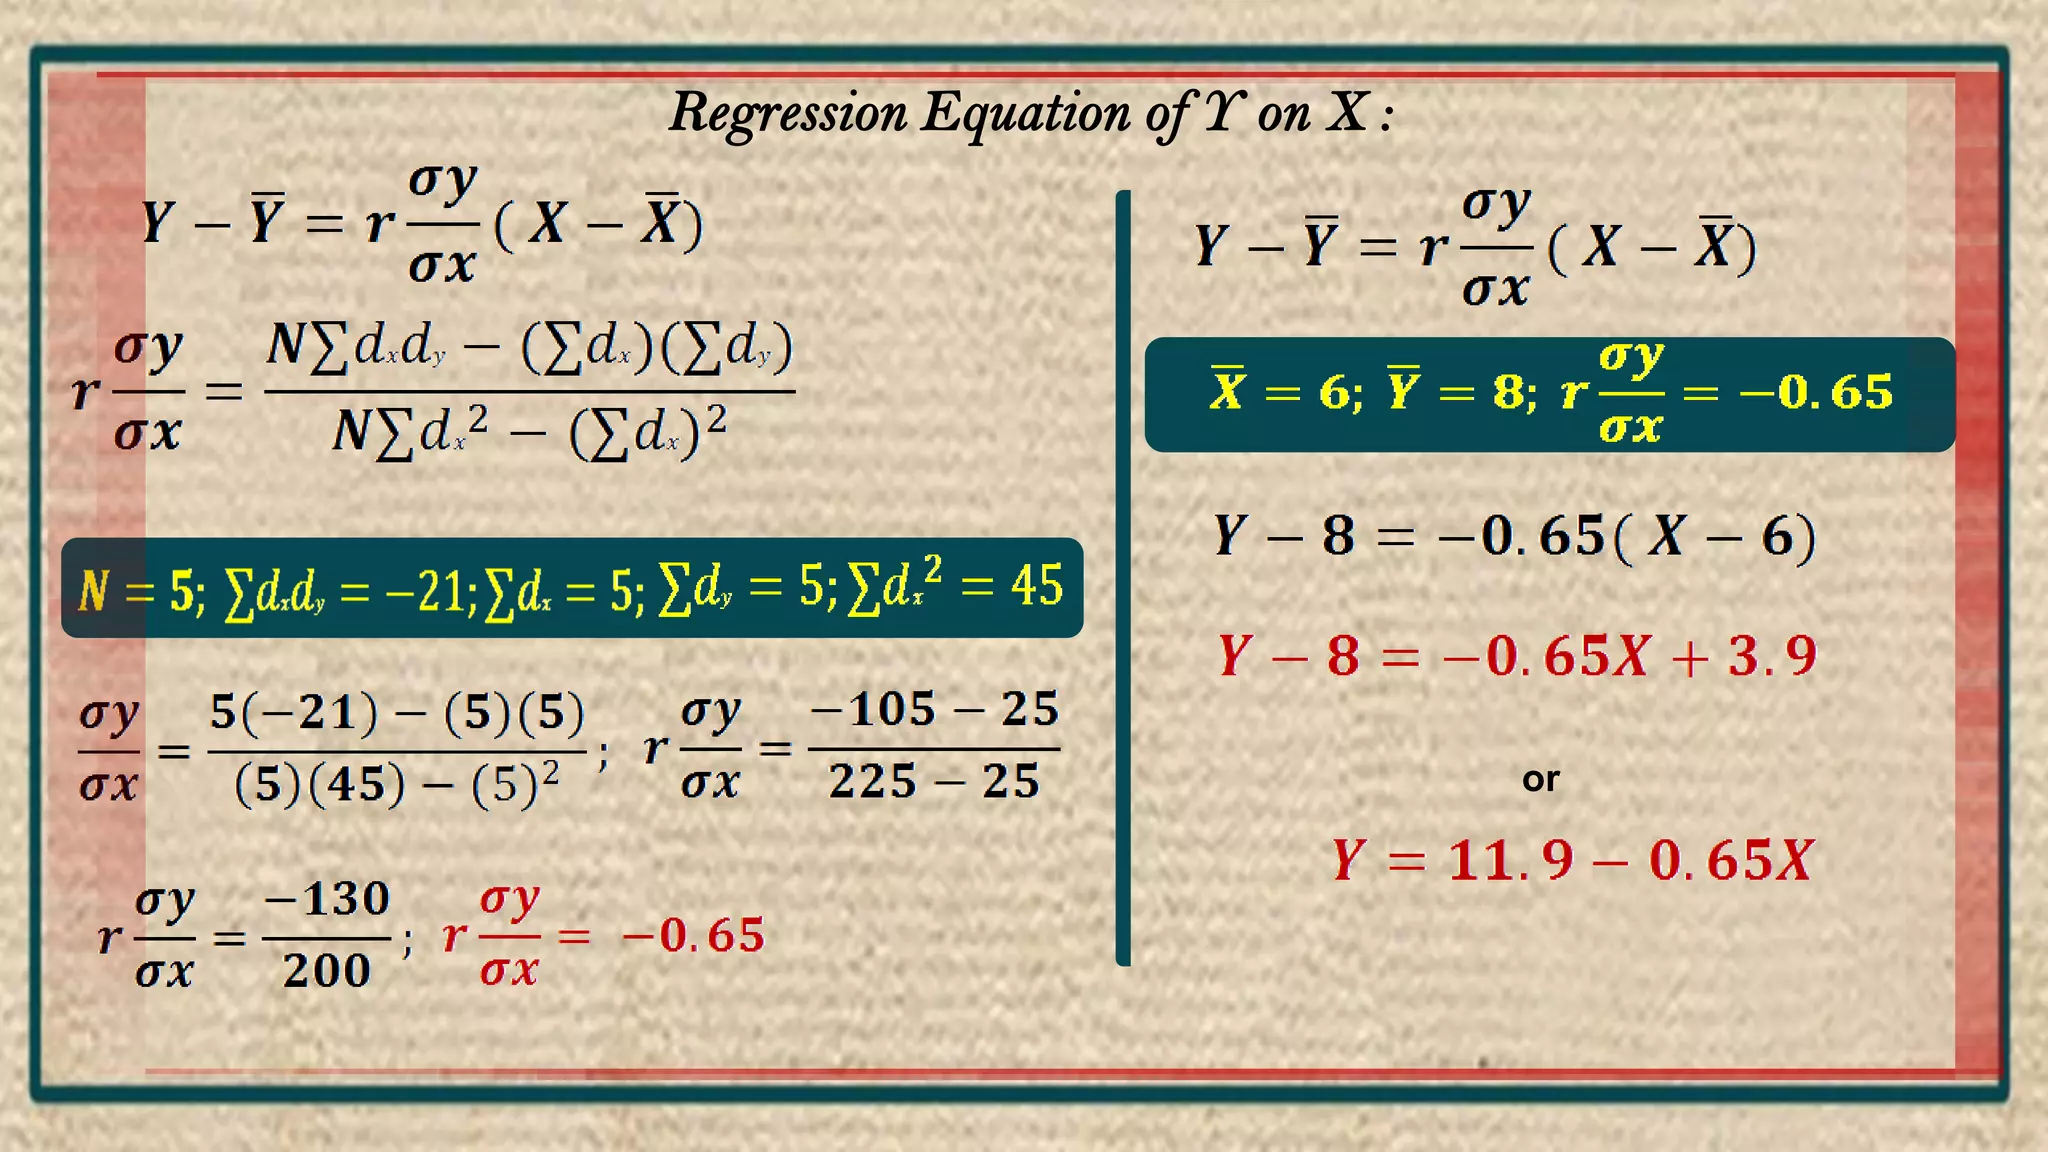
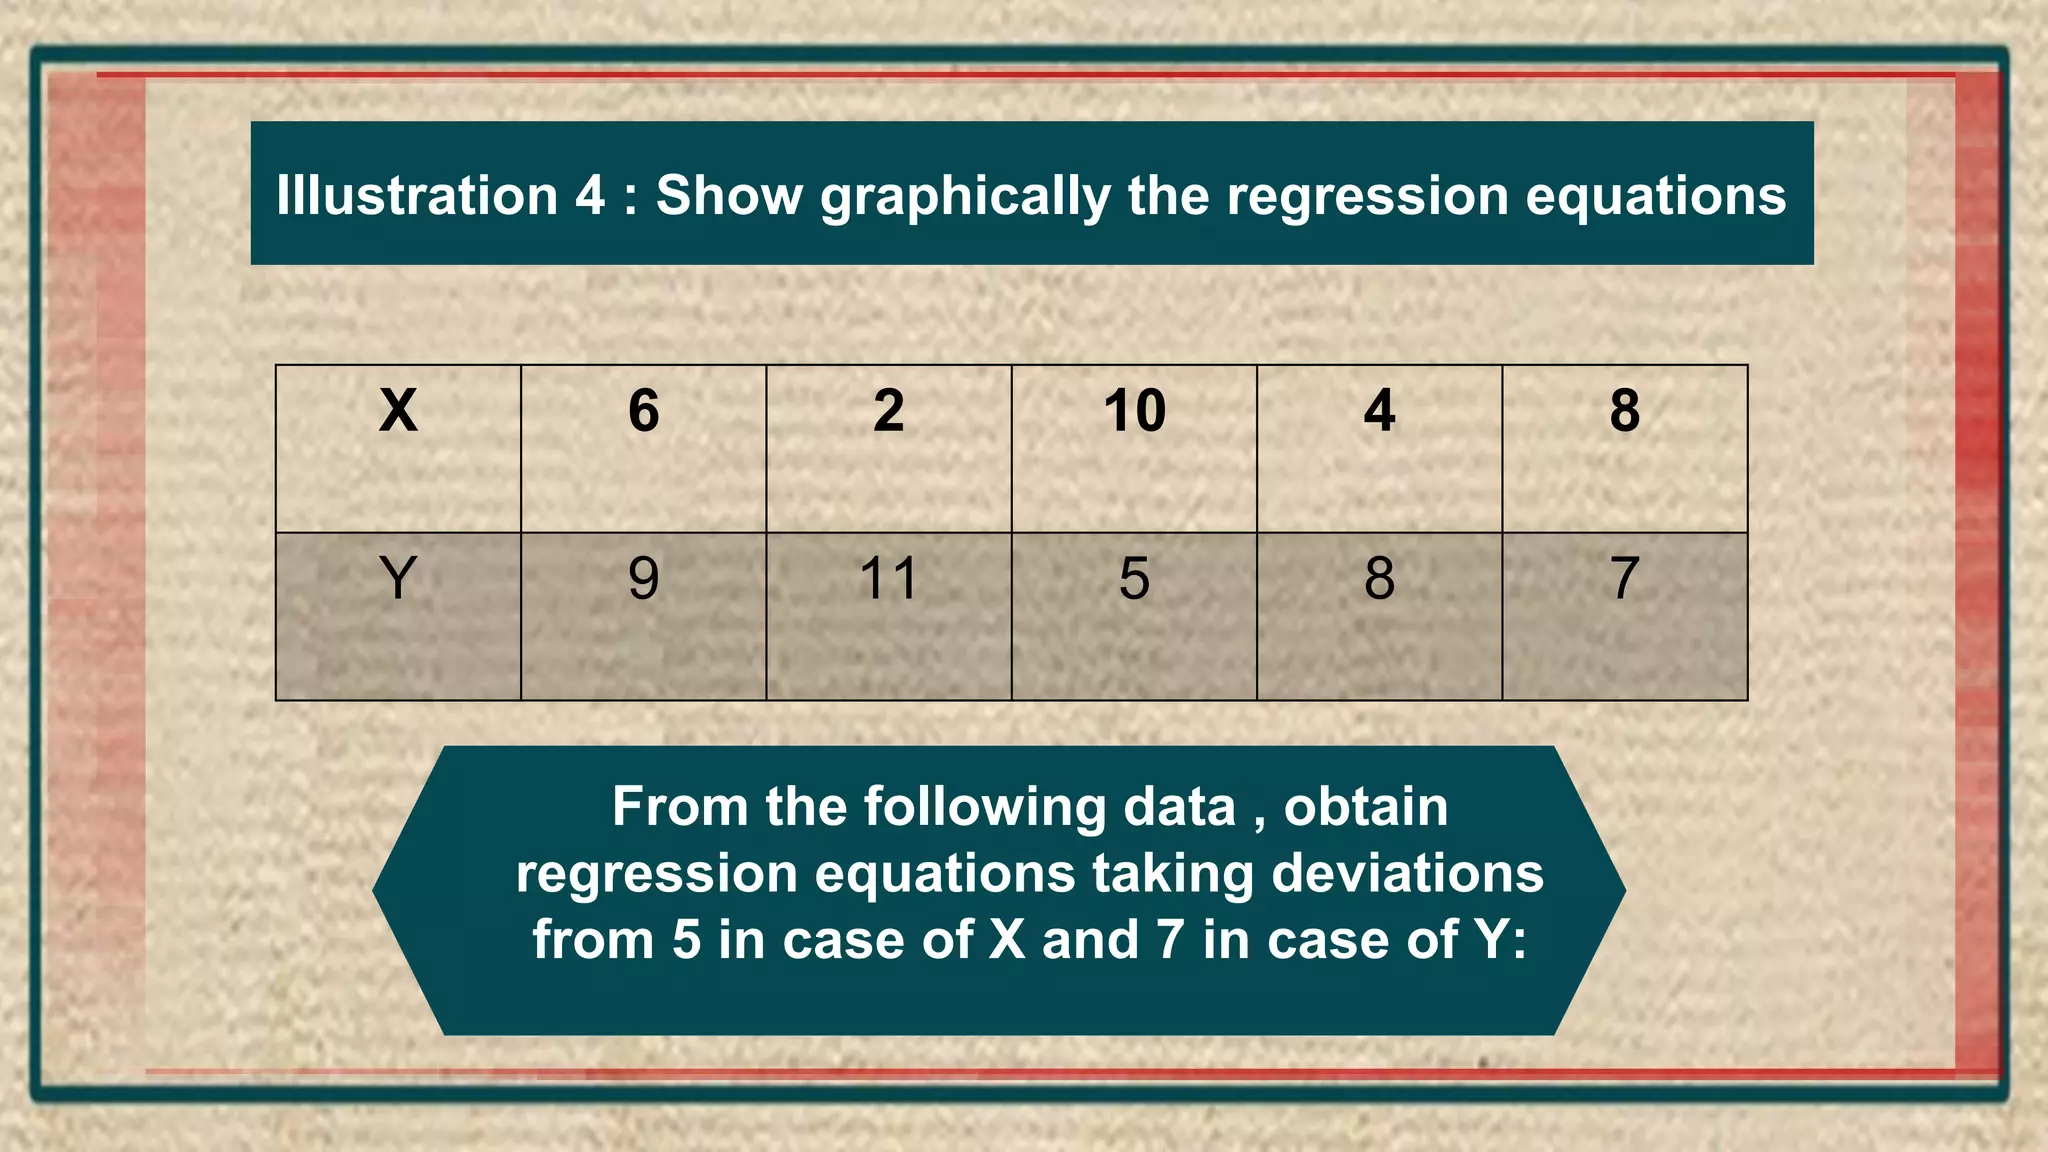
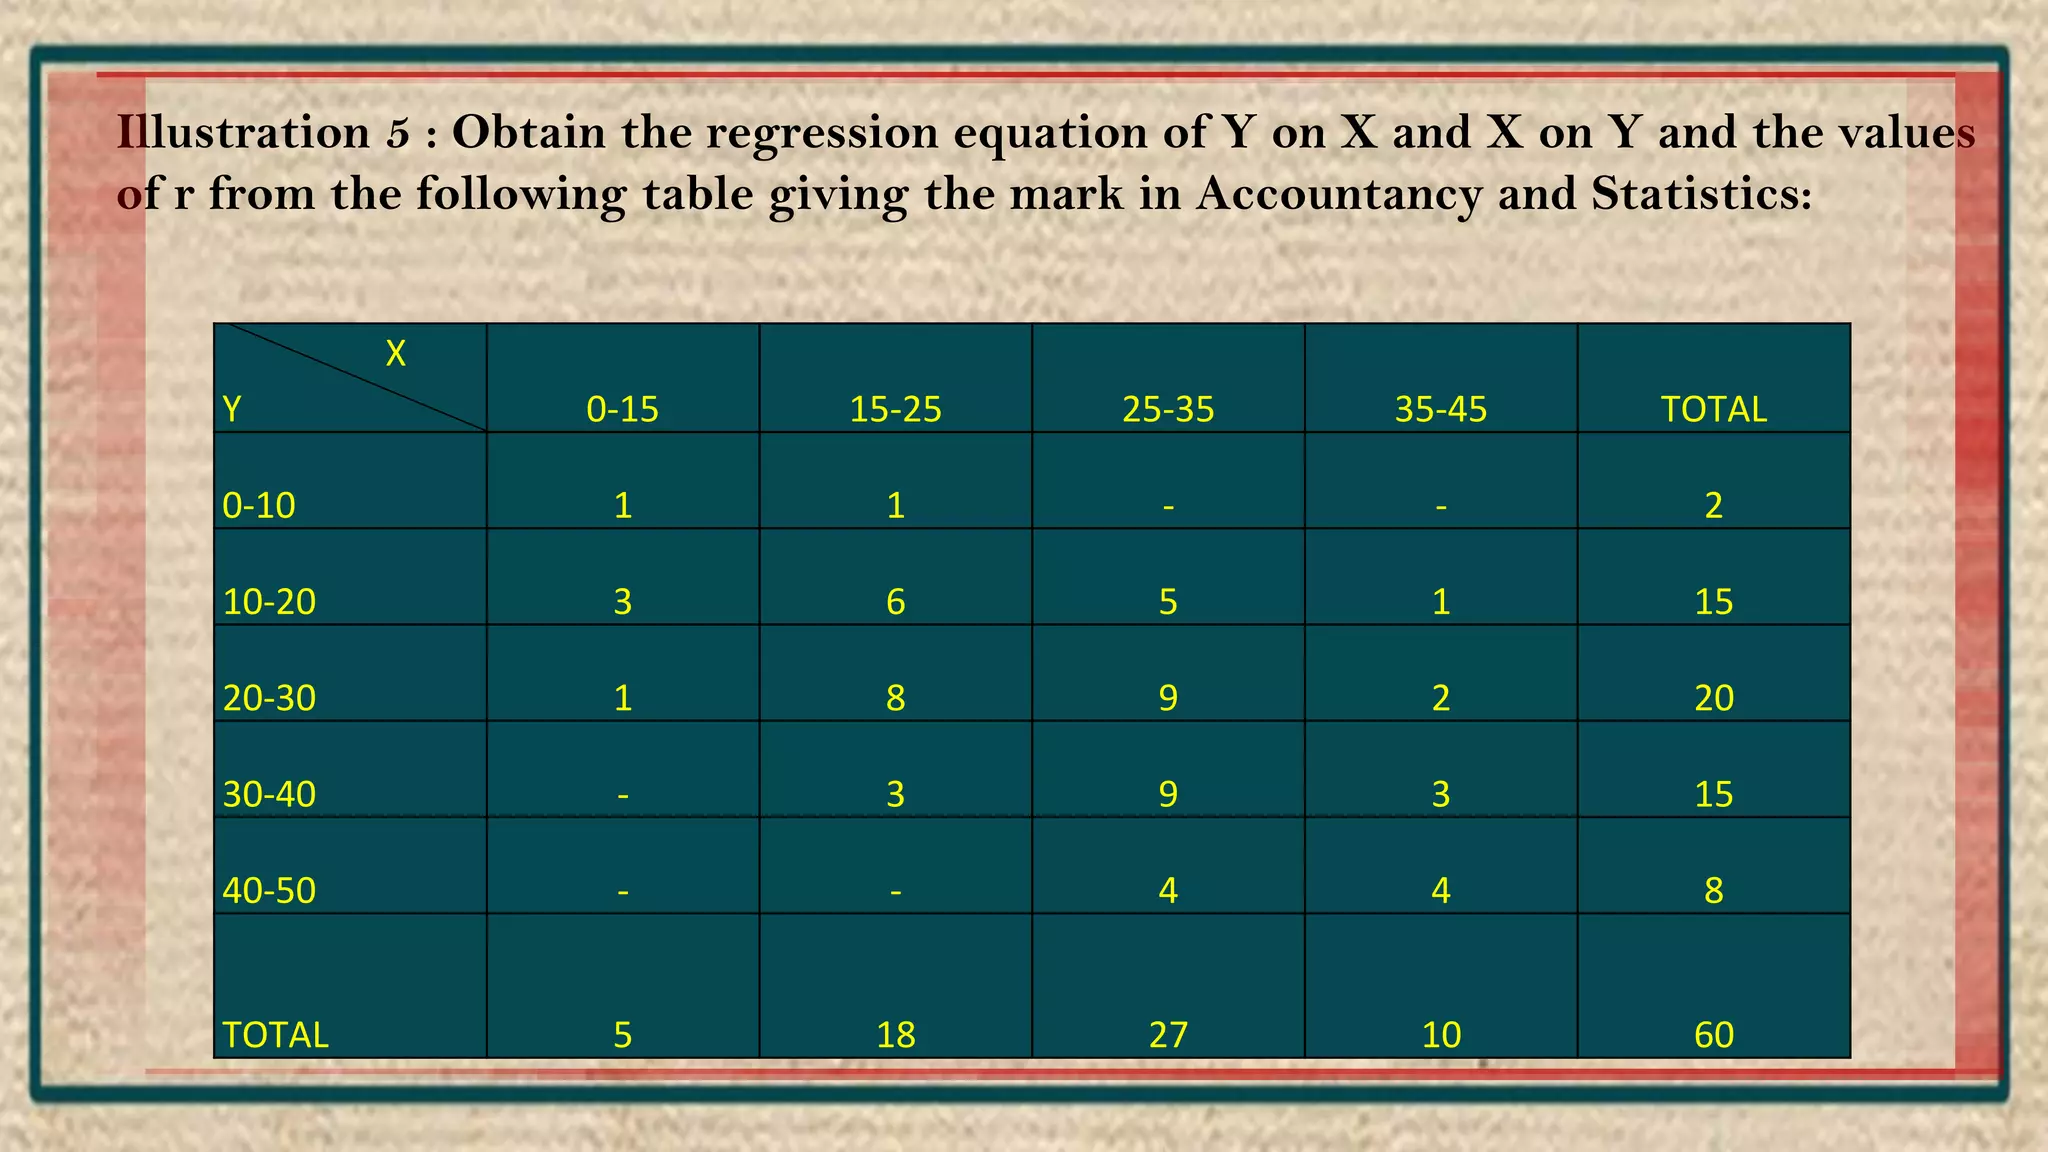
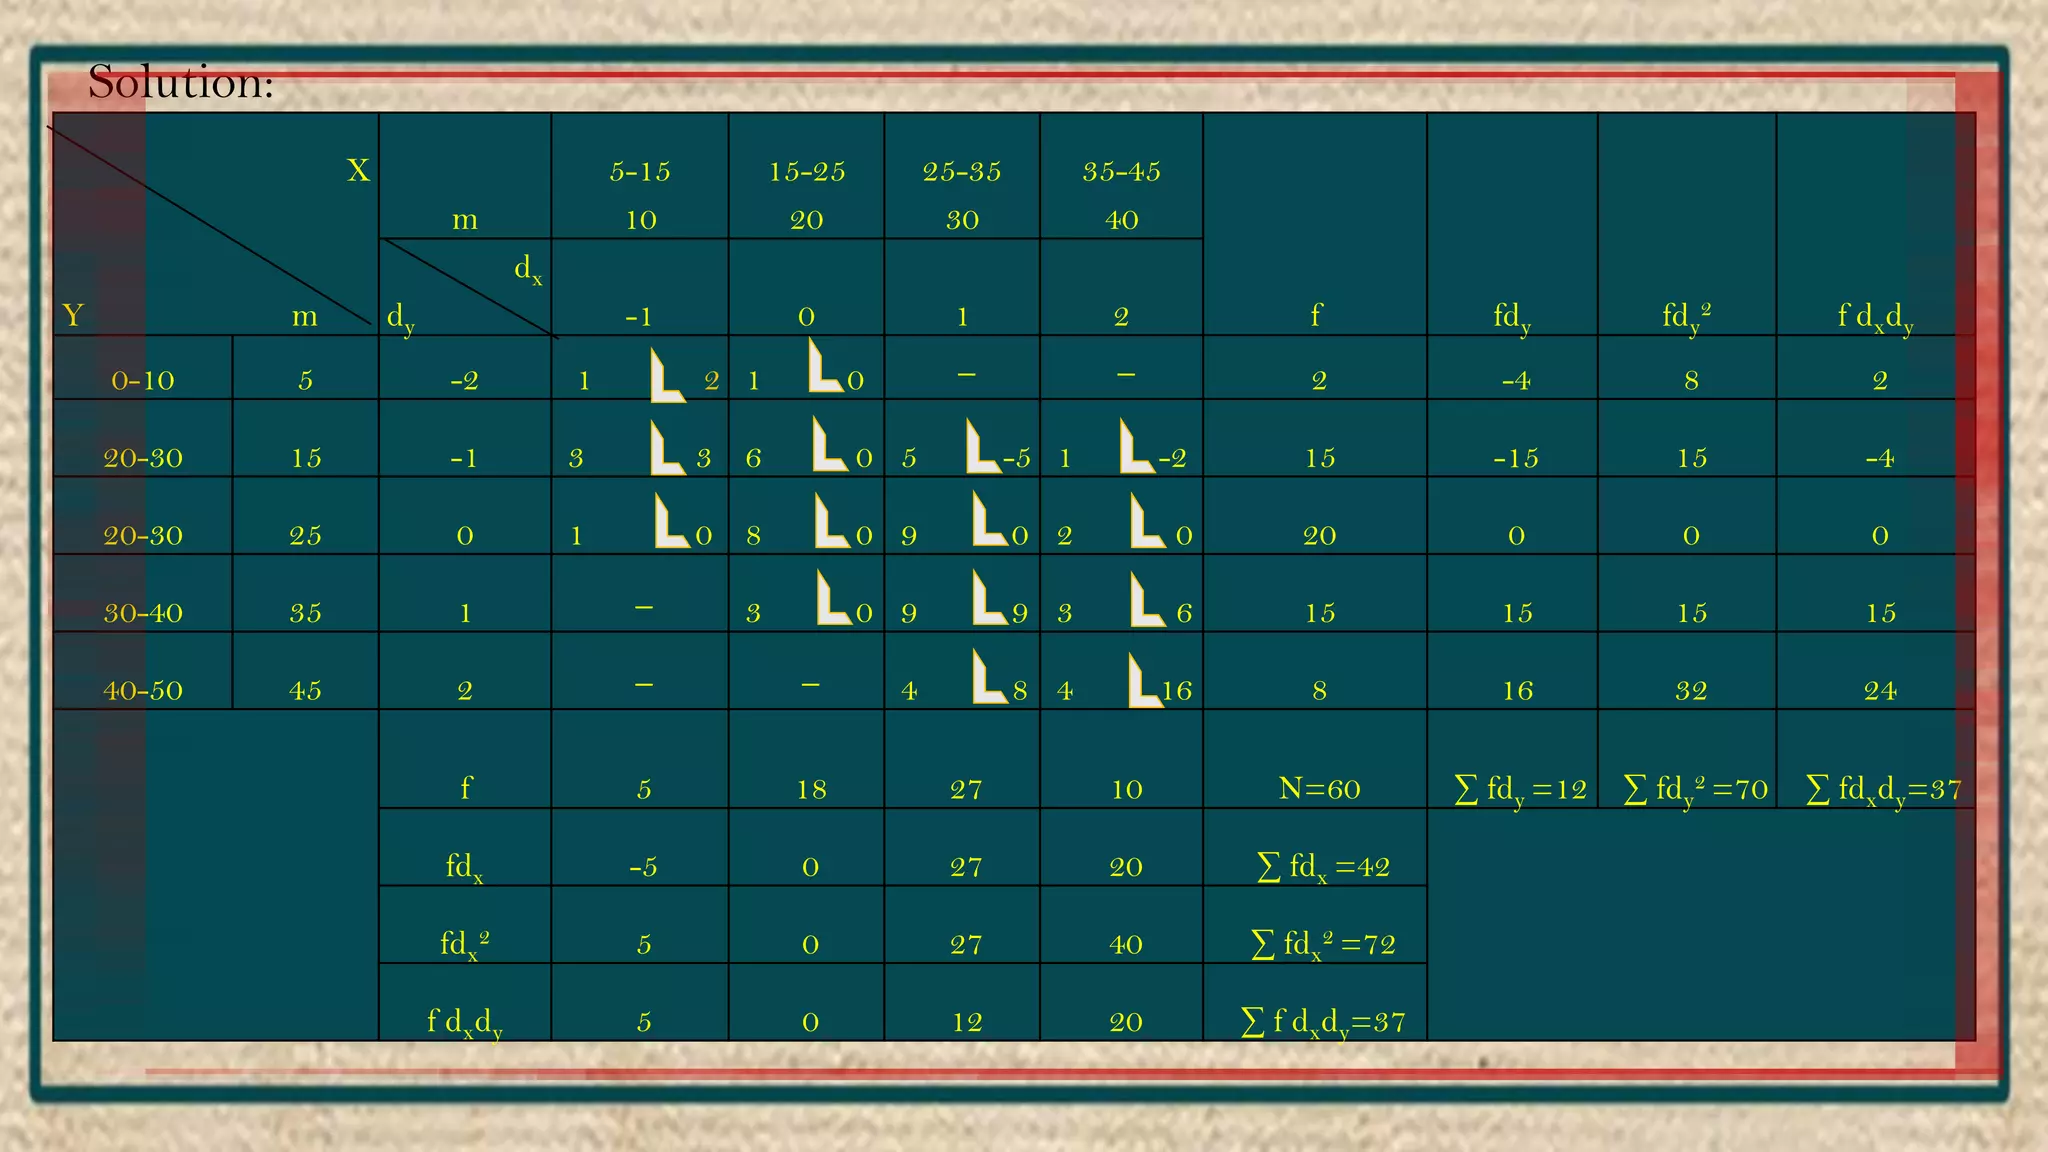
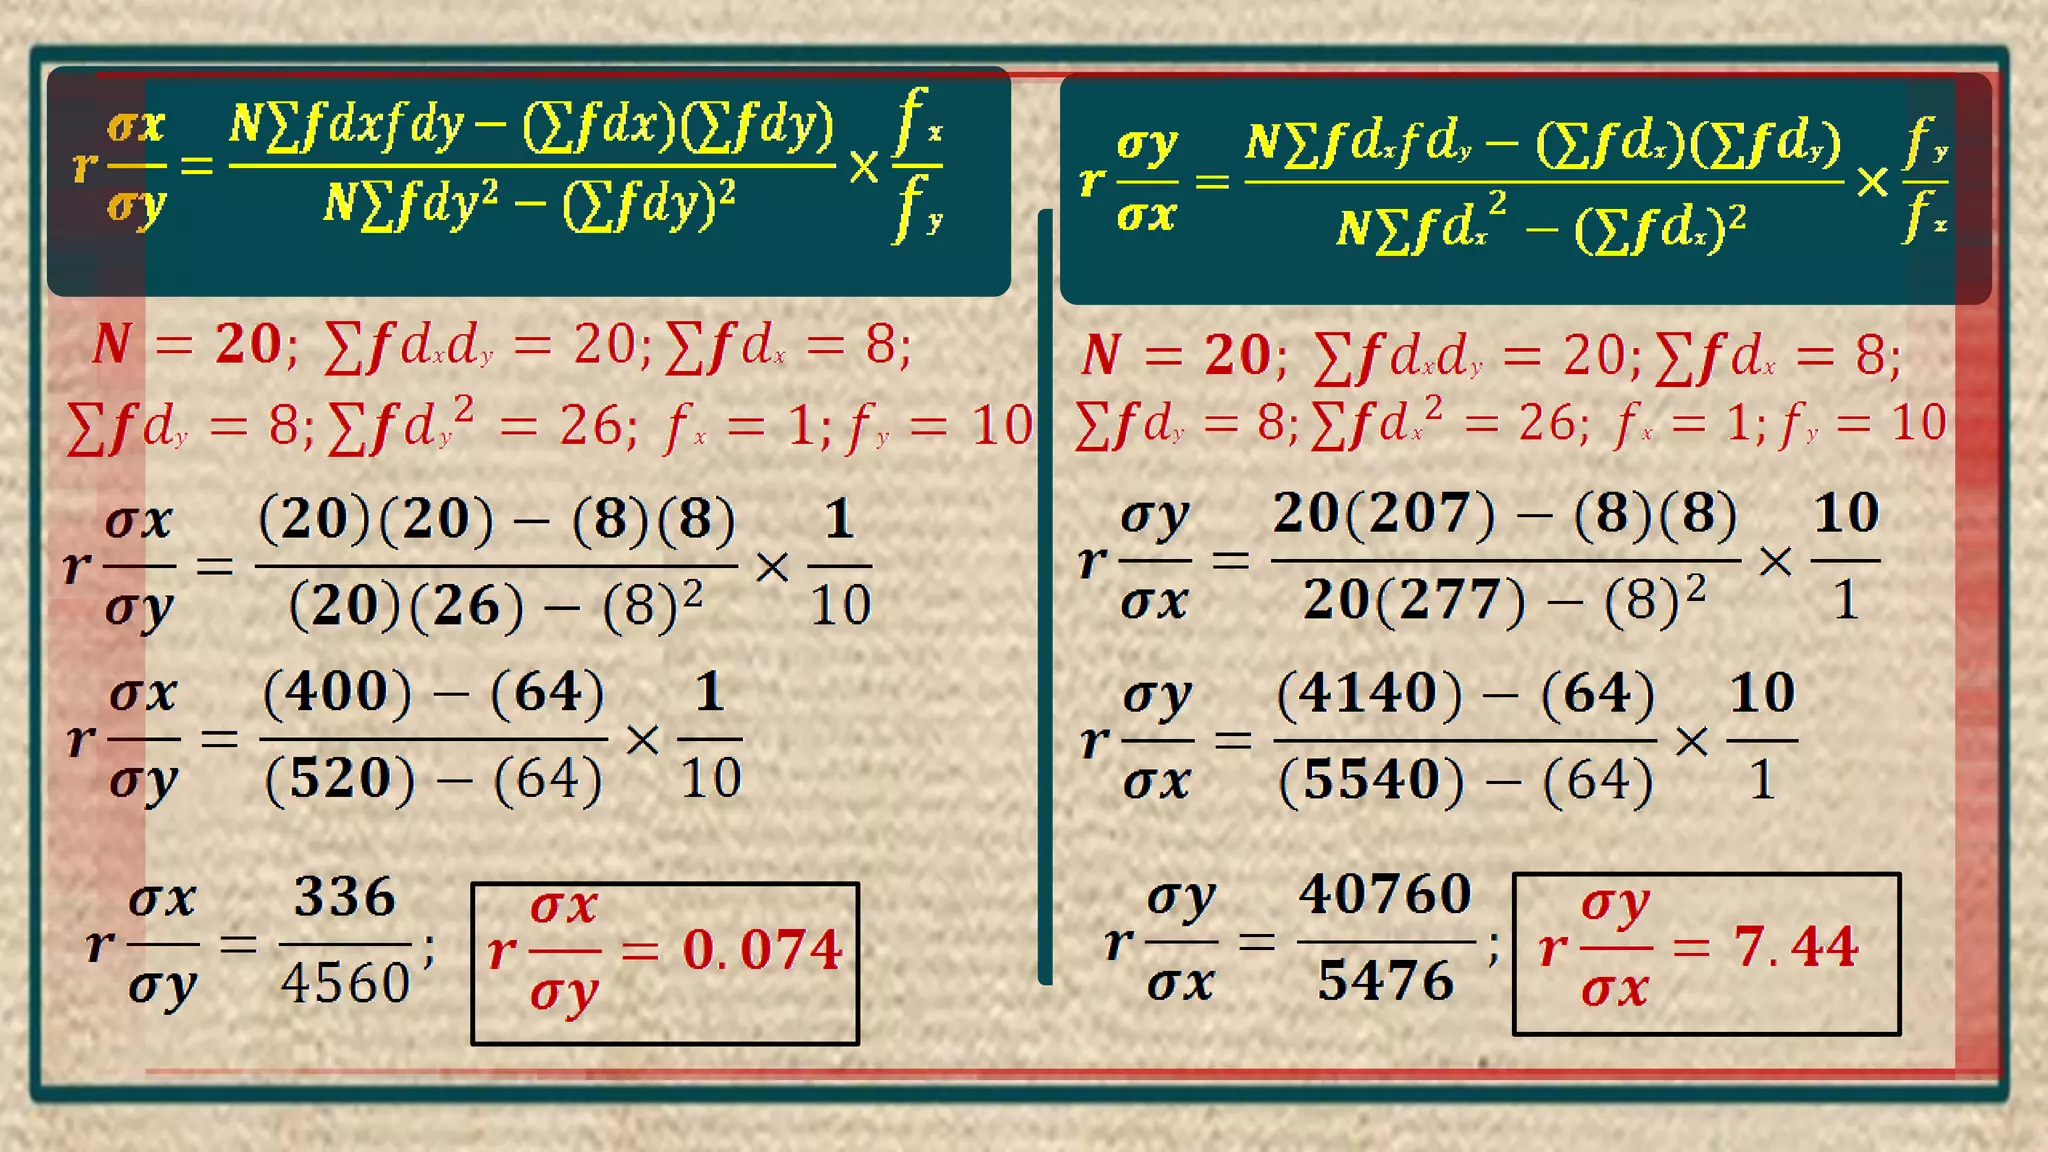
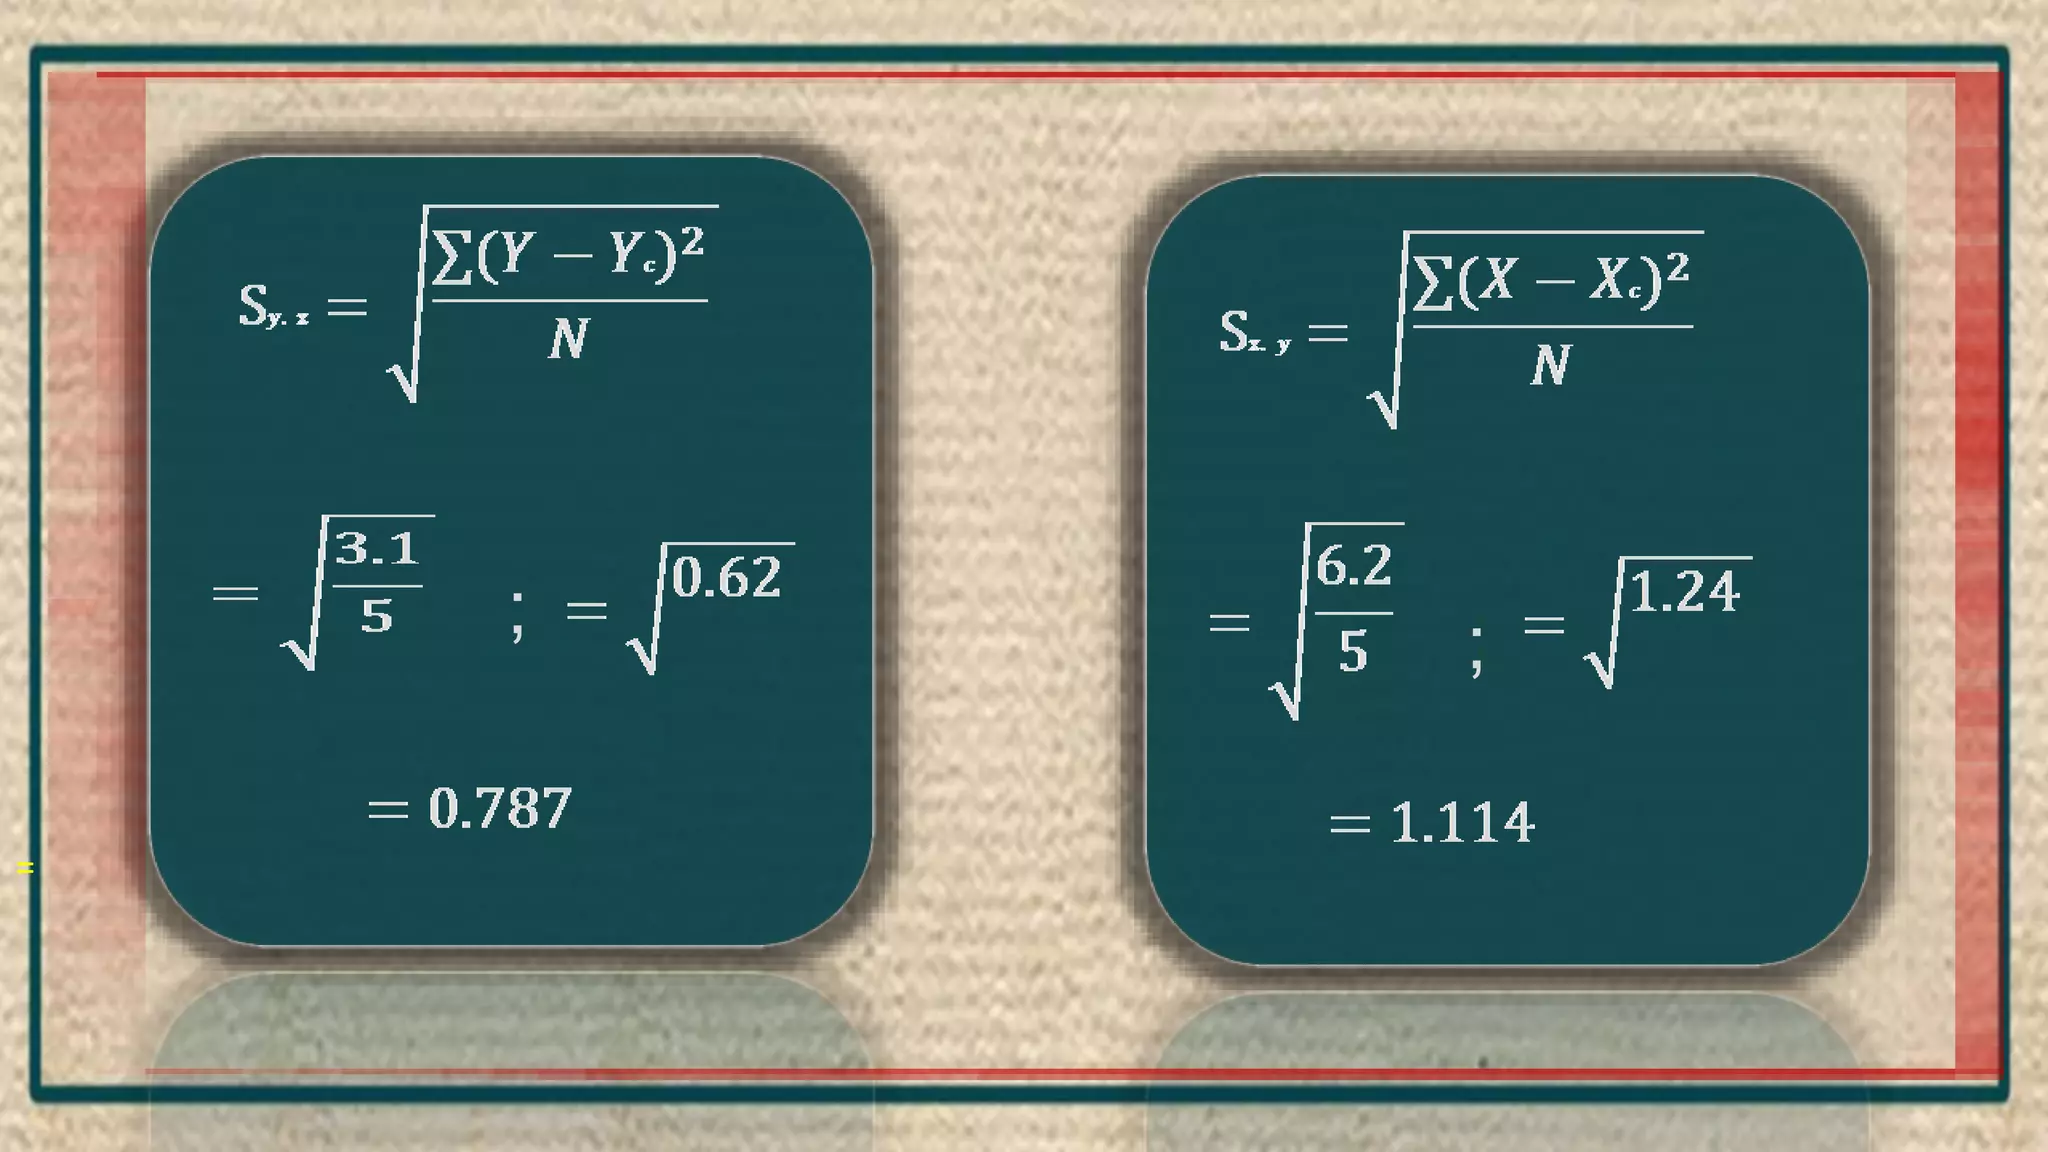
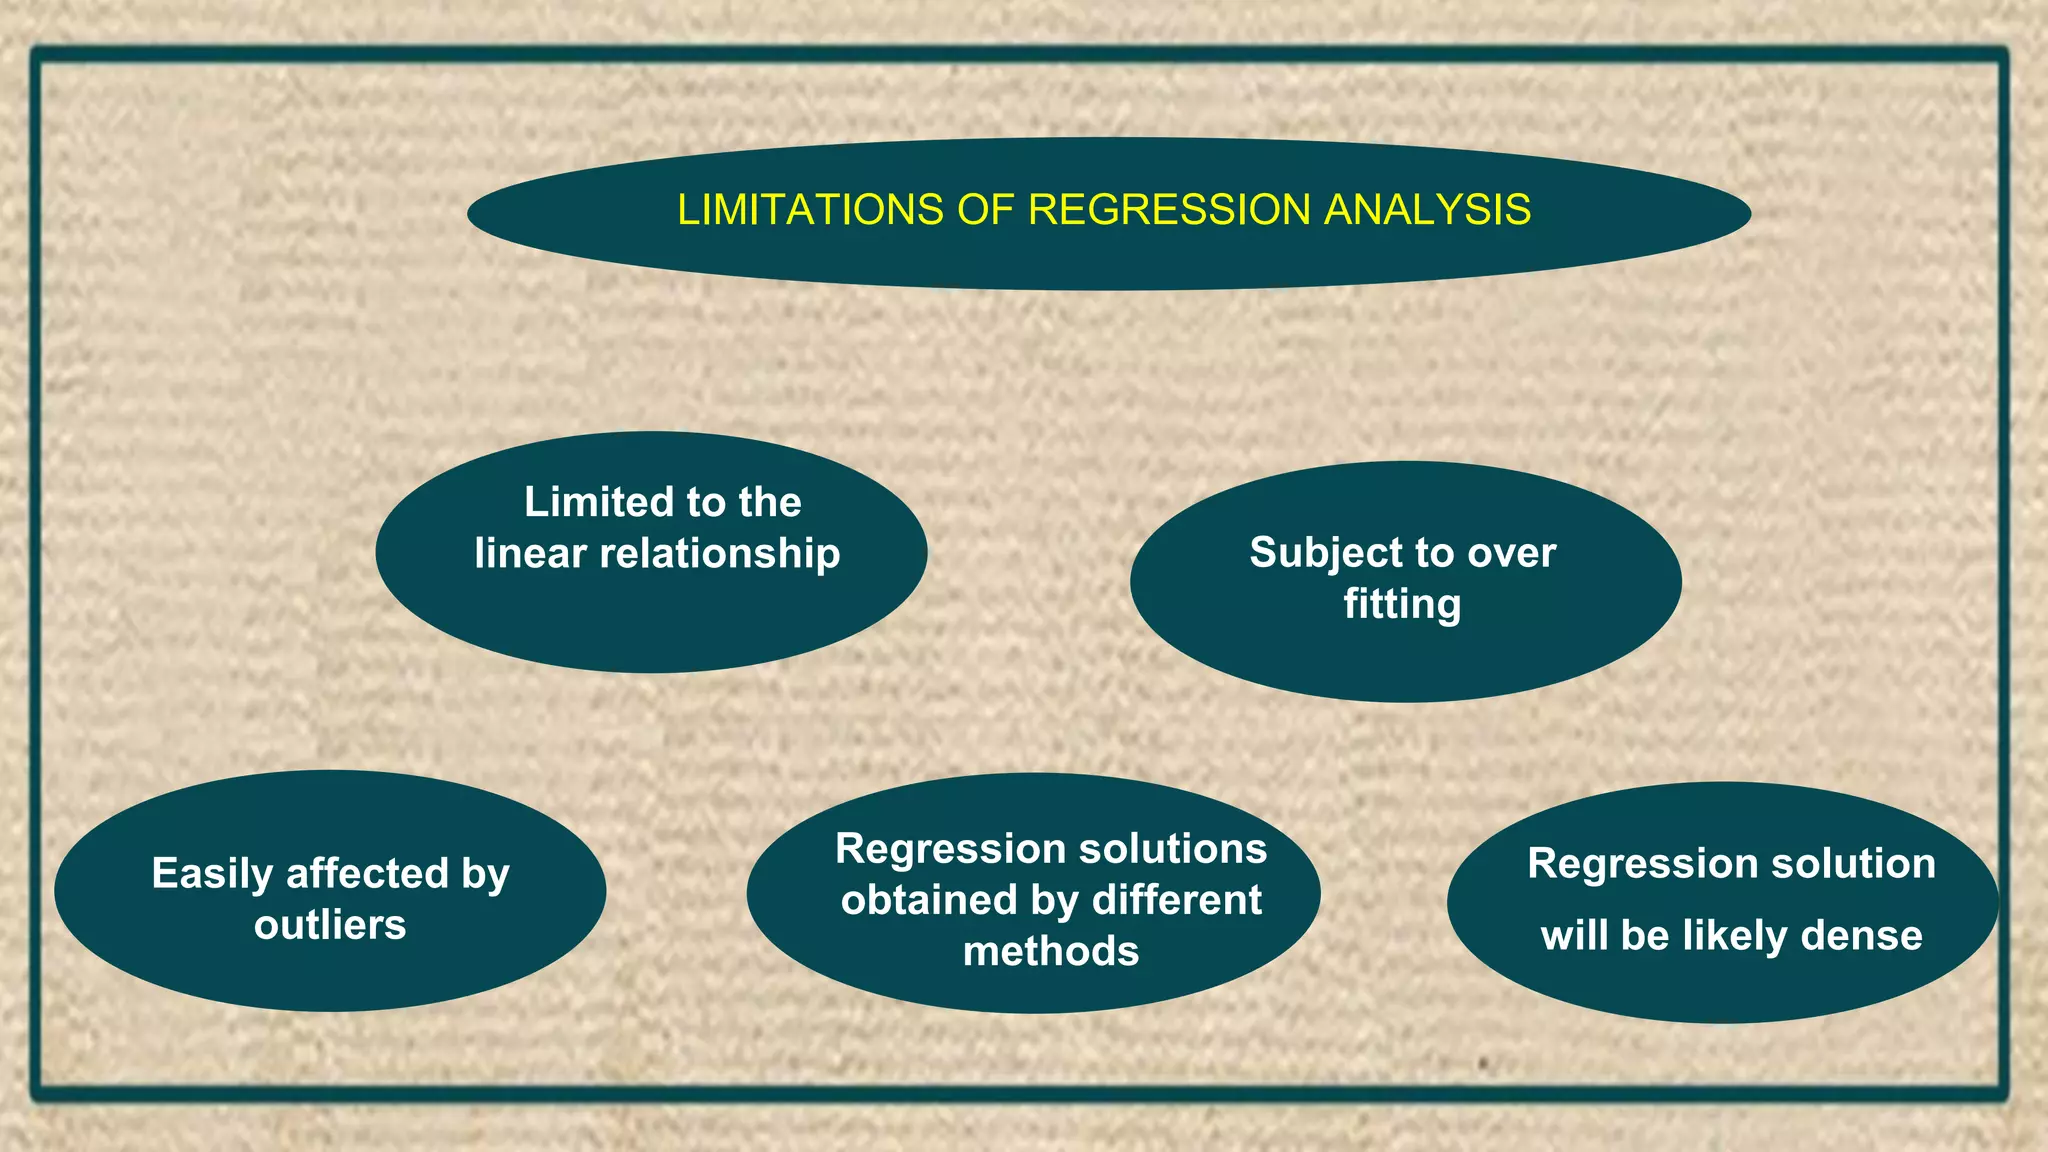
REGRESSION
LAVANYA K
ASSISTANT PROFESSOR
DEPARTMENT OF ECONOMICS
ETHIRAJ COLLEGE FOR WOMEN
1 MEANING 6
DEFINITION2
USES OF REGRESSION ANALYSIS
7
CONTENT
REGRESSION LINES
9
83
REGRESSION EQUATIONS
GRAPHING REGRESSION LINES
5
4
REGRESSION EQUATIONS IN CASE OF
CORRELATION TABLE
STANDARD ERROR OF ESTIMATE
DIFFERENCE BETWEEN
CORRELATION & REGRESSION
INTRODUCTION
❑ The earliest form of regression was the method of least squares, which was
published by Legendre in 1805, and by Gauss in 1809.
❑The term ‘regression’ was first used by Sir Francis Galton in 1877.
❑ Regression is the measure of the average relationship between two or more
variables in terms of the original units of the data.
DEFINITION
“One of the most frequently used techniques in economics and
business research, to find a relation between two or more
variables that are related casually, is regression analysis”
Taro Yamane
“Regression analysis attempts to establish the ‘nature of the
relationship’ between variables – that is, to study the functional
relationship between the variable and thereby provide a
mechanism for prediction, or forecasting.”
Ya Lum Chou
USES OF REGRESSION ANALYSIS:
Forecasting
Utility in Economic and business area
Indispensible for goods planning
Useful for statistical estimates
Study between more than two variable possible
Determination of the rate of change in variable
Measurement of degree and direction of correlation
Applicable in the problems having cause and effect relationship
Regression Analysis is to estimate errors
Regression Coefficient (bxy & byx) facilitates to calculate coefficient of determination (R) & coefficient of correlation
(r)
Difference between correlation and regression analysis
Where is coefficient of correlation is a measure
of degree of co variability between X and Y the
objective of regression analysis is to study the
nature of relationship between the variables so
that we may be able to predict the value of one
on the basis of another.
Correlation is nearly a tool of
ascertaining the degree of
relationship between two
variables and therefore we cannot
say that one variable is the cause
and other effect.
Difference between correlation and regression analysis
In correlation analysis rxy is a measure of
Direction and linear relationship between
two variables X and Y, rxy and ryx are
symmetric. While in regression analysis
the regression coefficients (bxy & byx) are
not Symmetric.
There may be nonsense correlation
between two variables which is purely
due to chance and has no practical
relevance such as increase in income
and increase in weight of a group of
people. however there is nothing like
nonsense regression.
Correlation Coefficient is
independent of change of scale
and origin while regression
coefficients are independent of
change of origin but not of
scale.
REGRESSION LINES
❑ The Regression Line is the
line that best fits the data
❑ used to minimize the squared
deviations of predictions is
called as the regression line.
There are as many number of regression lines
as variables. Suppose we take two variables,
say X and Y, then there will be two
regression lines:
Regression line of Y on X:
This gives the most
probable values of Y from
the given values of X.
Regression line of X on Y:
This gives the most
probable values of X from
the given values of Y.
❑The correlation between the variables
depend on the distance between these
two regression lines, such as the nearer
the regression lines to each other the
higher is the degree of correlation,and
vice-versa.
when,
❑ regression lines coincide - correlation
is perfect positive / perfect negative
❑ independent variables - zero
correlation
X 65 63 67 64 68 62 70 66 68 67 69 71
Y 68 66 68 65 69 66 68 65 71 67 68 70
REGRESSION EQUATIONS
The algebraic expression of
these regression lines is
called as Regression Equations.
There will be two regression
equations for the two
regression lines.
Regression equation of Y on X :
Y = a+bX
Y=Dependent variable;
X=Independent variable;
‘a’ & ‘b’ = Numerical constant
∑ Y = Na+b∑X
∑ XY = a∑X +b∑X2
Regression equation of Y on X :
X = a+bY
X=Dependent variable;
Y=Independent variable;
‘a’ & ‘b’ = Numerical constant
∑ X = Na+b∑Y
∑ XY = a∑Y+b∑Y2
Illustration 1. From the following data obtain the two regression equations:
X 6 2 10 4 8
Y 9 11 5 8 7
Solution: Obtaining Regression Equations
X Y XY X2 Y2
6 9 54 36 81
2 11 22 4 121
10 5 50 100 25
4 8 32 16 64
8 7 56 64 49
∑X=30 ∑Y=40 ∑XY=214 ∑X2=220 ∑Y2=340
Regression equation of Y on X : Y = a+bX
To determine the values of a and b the following two normal
equations are to be solved.
∑ Y = Na+b∑X
∑ XY = a∑X +b∑X2
∑ Y = 40 ; ∑X = 30 ; ∑X2 = 220 ; ∑ XY = 214
Substituting the values 40 = 5a+30b ………..(1)
214 = 30a+220b ………..(2)
Multiplying equation (1) by 6,
240 = 30a+180b ………..(3)
214 = 30a+220b ………..(4)
Deducting equation (4) from (3):
-40b=26
b = -0.65
Substituting the value of b in equation (1):
40 = 5a+30(-0.65)
5a = 40 +19.5
a = 11.9
Putting the values of a and b in the equation, the regression of
Y on X is
Y = 11.9 -0.65 X
Regression line of X on Y: X = a+bY
To determine the values of a and b the following two normal equations are
to be solved:
` ∑ X = Na+b∑Y
∑ XY = a∑Y +b∑Y2
∑ Y = 40 ; ∑X = 30 ; ∑Y2 = 340 ; ∑ XY = 214
30 = 5a+40b ……….. (1)
214 = 40a+340b ……….. (2)
Multiplying equation (1) by 8:
240 = 40a+320b ……….. (3)
214 = 40a+340b ……….. (4)
From equation (3) and (4):
-20b =26
b= -1.3
Substituting the value of b in equation (1):
30 = 5a+40(-1.3)
5a = 30+52
5a = 82
a =16.4
Putting the values of a and b in the equation, the
regression line of X on Y is
X = 16.4 – 1.3 Y
Deviations taken from Arithmetic Means of X and Y
(i) Regression Equation of X on Y :
x̅ = Mean of X series; Y̅ = Mean of Y; series; =Regression coefficient of
X on Y.
• The regression coefficient of X on Y is denoted by the symbol bxy or b1. It
measures the change in X corresponding to a unit change in Y.
• When deviations are taken from the means of X and Y, the regression
coefficient of X on Y is obtained as follows:
bxy or
(ii) Regression Equation of Y on X :
x̅ = Mean of X series; Y̅ = Mean of Y series; =Regression coefficient of
Yon X.
byx or
Illustration 2. From the following data calculate the regression equations taking deviation of
items from the mean of X and Y series.
X 6 2 10 4 8
Y 9 11 5 8 7
Solution: Calculation of Regression Equations
X
(X - X̅)
x x2 Y
(Y - Y̅)
y y2 xy
6 0 0 9 1 1 1
2 -4 16 11 3 9 -12
10 4 16 5 -3 9 -12
4 -2 4 8 0 0 0
8 2 4 7 -1 1 -2
∑X=30 ∑x=0 ∑x2= 40 ∑Y=40 ∑y=0 ∑y2= 20 ∑xy= -25 Y̅ = ∑Y/N
= 8
X̅ = ∑X/N
= 6
Regression Equation of X on Y
:
= -1.3X̅ = 6 ; Y̅ = 8;
X – 6 = -1.3 ( Y – 8)
X – 6 = -1.3Y + 10.4
X = -1.3Y +16.4 or
X = 16.4 – 1.3Y
Regression Equation of Y on X
:
X̅ = 6 ; Y̅ = 8; = -0.65
Y – 8 = -0.65 ( X – 6)
Y – 8 = -0.65X + 3.9
Y = -0.65X +11.9 or
Y = 11.9 – 0.65X
Deviations Taken from Assumed Means
• When deviations are taken from assumed means the entire procedure of finding regression equations remains the same ̶ the
only difference is that instead of taking deviations from actual means, we take the deviations from assumed means.
Regression Equation of X on Y : Regression Equation of Y on X :
When the regression coefficients are calculated from correlation table values are
obtained as follows:
fx = Class interval of X variable
fy = Class interval of y variable
Illustration 3. From the following data calculate regression equations taking
deviation of X series from 5 and of Y series from 7.
X 6 2 10 4 8
Y 9 11 5 8 7
Solution: Calculation of Regression Equations
X
(X - 5)
dx dx2 Y
(Y – 7)
dy dy2 dxdy
6 1 1 9 2 4 2
2 -3 9 11 4 16 -12
10 5 25 5 -2 4 -10
4 -1 1 8 1 1 -1
8 3 9 7 0 0 0
∑X=30 ∑dx=5 ∑dx2= 45 ∑Y=40 ∑dy=5 ∑dy2= 25 ∑dxdy= -21
Regression Equation of X on Y :
or
Regression Equation of Y on X :
or
Graphing Regression Lines:
It is quite easy to graph the regression lines once they have been computed. All one
has to do is to⎻
i. Choose any two values for the unknown variable on the right-hand side of the
equation.
ii. Compute the other variable.
iii. Plot the two pairs of values
iv. Draw a straight line through the plotted points.
Illustration 4 : Show graphically the regression equations
X 6 2 10 4 8
Y 9 11 5 8 7
From the following data , obtain
regression equations taking deviations
from 5 in case of X and 7 in case of Y:
These points and the regression line through them are in the graph
below:
Thus the value of
regression
coefficient comes
out to be the same.
REGRESSION EQUATIONS IN CASE OF CORRELATION TABLE
Finding the regression equation of Y
on X and X on Y the convenient form
will be Y - Y̅ = bxy (X - X̅) and
X - X̅ = byx ( Y - Y̅ )
It may be noted that the
regression coefficients are
independent of origin but
not of scale and hence
necessary adjustment must
be made.
X
Y 0-15 15-25 25-35 35-45 TOTAL
0-10 1 1 - - 2
10-20 3 6 5 1 15
20-30 1 8 9 2 20
30-40 - 3 9 3 15
40-50 - - 4 4 8
TOTAL 5 18 27 10 60
Illustration 5 : Obtain the regression equation of Y on X and X on Y and the values
of r from the following table giving the mark in Accountancy and Statistics:
Solution:
X
m
5-15 15-25 25-35 35-45
f fdy fdy
2 f dxdyY m
10 20 30 40
dx
-1 0 1 2dy
0-10 5 -2 1 2 1 0 ⎻ ⎻ 2 -4 8 2
20-30 15 -1 3 3 6 0 5 -5 1 -2 15 -15 15 -4
20-30 25 0 1 0 8 0 9 0 2 0 20 0 0 0
30-40 35 1 ⎻ 3 0 9 9 3 6 15 15 15 15
40-50 45 2 ⎻ ⎻ 4 8 4 16 8 16 32 24
f 5 18 27 10 N=60 ∑ fdy =12 ∑ fdy
2 =70 ∑ fdxdy=37
fdx -5 0 27 20 ∑ fdx =42
fdx
2 5 0 27 40 ∑ fdx
2 =72
f dxdy 5 0 12 20 ∑ f dxdy=37
The Standard Error of Estimate is the
measure of variation of an observation made
around the computed regression line. Simply,
it is used to check the accuracy of predictions
made with the regression line.
The standard error of
estimate, symbolized by
Syx .
The standard deviation measures the
dispersion about an average, such as the
mean. The standard error of estimate
measures the dispersion about an
average line, called the regression line.
STANDARD ERROR OF ESTIMATE
The standard error of
regression of Y values from Yc
The standard error of
regression of X values from Xc
Illustration 5: Given the following data
X 6 2 10 4 8
Y 9 11 5 8 7
Find the two regression equations and
calculate the standard error of the estimate
(Syx & Syx )
Solution: From illustration 2, the two regression equations are:
Y = 11.9 – 0.65 X and X = 16.4 – 1.3 Y
From the regression equation of Y on X for various values of X, we can find out the corresponding
Y values, and from the equation of X on Y we can find out Xc . These values are as follows:
X Y Yc Xc
6 9 8.0 4.7 1.00 1.69
2 11 10.6 2.1 0.16 0.01
10 5 5.4 9.9 0.16 0.01
4 8 9.3 6.0 1.69 4.00
8 7 6.7 7.3 0.09 0.49
=
;; ;
Limited to the
linear relationship Subject to over
fitting
Easily affected by
outliers
Regression solution
will be likely dense
Regression solutions
obtained by different
methods
LIMITATIONS OF REGRESSION ANALYSIS
RECOMMENDED TEXTBOOKS:
1. S.P.Gupta, Statistical Methods, Sultan Chand and Sons, New Delhi 2017
2. R.S.N.Pillai and V. Bagavathi, Statistics, Sultan Chand and Sons, New Delhi
2010.
E-LEARNING RESOURCES:
https://www.statista.com.
https://www.sas.com.
YOUTUBE LINKS:
https://youtu.be/zPG4NjIkCjc
https://youtu.be/owI7zxCqNY0
THANK YOU

Regression

  • 1.
    REGRESSION LAVANYA K ASSISTANT PROFESSOR DEPARTMENTOF ECONOMICS ETHIRAJ COLLEGE FOR WOMEN
  • 2.
    1 MEANING 6 DEFINITION2 USESOF REGRESSION ANALYSIS 7 CONTENT REGRESSION LINES 9 83 REGRESSION EQUATIONS GRAPHING REGRESSION LINES 5 4 REGRESSION EQUATIONS IN CASE OF CORRELATION TABLE STANDARD ERROR OF ESTIMATE DIFFERENCE BETWEEN CORRELATION & REGRESSION
  • 3.
    INTRODUCTION ❑ The earliestform of regression was the method of least squares, which was published by Legendre in 1805, and by Gauss in 1809. ❑The term ‘regression’ was first used by Sir Francis Galton in 1877. ❑ Regression is the measure of the average relationship between two or more variables in terms of the original units of the data.
  • 4.
    DEFINITION “One of themost frequently used techniques in economics and business research, to find a relation between two or more variables that are related casually, is regression analysis” Taro Yamane “Regression analysis attempts to establish the ‘nature of the relationship’ between variables – that is, to study the functional relationship between the variable and thereby provide a mechanism for prediction, or forecasting.” Ya Lum Chou
  • 5.
    USES OF REGRESSIONANALYSIS: Forecasting Utility in Economic and business area Indispensible for goods planning Useful for statistical estimates Study between more than two variable possible Determination of the rate of change in variable Measurement of degree and direction of correlation Applicable in the problems having cause and effect relationship Regression Analysis is to estimate errors Regression Coefficient (bxy & byx) facilitates to calculate coefficient of determination (R) & coefficient of correlation (r)
  • 6.
    Difference between correlationand regression analysis Where is coefficient of correlation is a measure of degree of co variability between X and Y the objective of regression analysis is to study the nature of relationship between the variables so that we may be able to predict the value of one on the basis of another. Correlation is nearly a tool of ascertaining the degree of relationship between two variables and therefore we cannot say that one variable is the cause and other effect.
  • 7.
    Difference between correlationand regression analysis In correlation analysis rxy is a measure of Direction and linear relationship between two variables X and Y, rxy and ryx are symmetric. While in regression analysis the regression coefficients (bxy & byx) are not Symmetric. There may be nonsense correlation between two variables which is purely due to chance and has no practical relevance such as increase in income and increase in weight of a group of people. however there is nothing like nonsense regression. Correlation Coefficient is independent of change of scale and origin while regression coefficients are independent of change of origin but not of scale.
  • 8.
    REGRESSION LINES ❑ TheRegression Line is the line that best fits the data ❑ used to minimize the squared deviations of predictions is called as the regression line. There are as many number of regression lines as variables. Suppose we take two variables, say X and Y, then there will be two regression lines: Regression line of Y on X: This gives the most probable values of Y from the given values of X. Regression line of X on Y: This gives the most probable values of X from the given values of Y.
  • 9.
    ❑The correlation betweenthe variables depend on the distance between these two regression lines, such as the nearer the regression lines to each other the higher is the degree of correlation,and vice-versa. when, ❑ regression lines coincide - correlation is perfect positive / perfect negative ❑ independent variables - zero correlation
  • 10.
    X 65 6367 64 68 62 70 66 68 67 69 71 Y 68 66 68 65 69 66 68 65 71 67 68 70
  • 11.
    REGRESSION EQUATIONS The algebraicexpression of these regression lines is called as Regression Equations. There will be two regression equations for the two regression lines.
  • 12.
    Regression equation ofY on X : Y = a+bX Y=Dependent variable; X=Independent variable; ‘a’ & ‘b’ = Numerical constant ∑ Y = Na+b∑X ∑ XY = a∑X +b∑X2 Regression equation of Y on X : X = a+bY X=Dependent variable; Y=Independent variable; ‘a’ & ‘b’ = Numerical constant ∑ X = Na+b∑Y ∑ XY = a∑Y+b∑Y2
  • 13.
    Illustration 1. Fromthe following data obtain the two regression equations: X 6 2 10 4 8 Y 9 11 5 8 7
  • 14.
    Solution: Obtaining RegressionEquations X Y XY X2 Y2 6 9 54 36 81 2 11 22 4 121 10 5 50 100 25 4 8 32 16 64 8 7 56 64 49 ∑X=30 ∑Y=40 ∑XY=214 ∑X2=220 ∑Y2=340
  • 15.
    Regression equation ofY on X : Y = a+bX To determine the values of a and b the following two normal equations are to be solved. ∑ Y = Na+b∑X ∑ XY = a∑X +b∑X2 ∑ Y = 40 ; ∑X = 30 ; ∑X2 = 220 ; ∑ XY = 214 Substituting the values 40 = 5a+30b ………..(1) 214 = 30a+220b ………..(2) Multiplying equation (1) by 6, 240 = 30a+180b ………..(3) 214 = 30a+220b ………..(4)
  • 16.
    Deducting equation (4)from (3): -40b=26 b = -0.65 Substituting the value of b in equation (1): 40 = 5a+30(-0.65) 5a = 40 +19.5 a = 11.9 Putting the values of a and b in the equation, the regression of Y on X is Y = 11.9 -0.65 X
  • 17.
    Regression line ofX on Y: X = a+bY To determine the values of a and b the following two normal equations are to be solved: ` ∑ X = Na+b∑Y ∑ XY = a∑Y +b∑Y2 ∑ Y = 40 ; ∑X = 30 ; ∑Y2 = 340 ; ∑ XY = 214 30 = 5a+40b ……….. (1) 214 = 40a+340b ……….. (2) Multiplying equation (1) by 8: 240 = 40a+320b ……….. (3) 214 = 40a+340b ……….. (4)
  • 18.
    From equation (3)and (4): -20b =26 b= -1.3 Substituting the value of b in equation (1): 30 = 5a+40(-1.3) 5a = 30+52 5a = 82 a =16.4 Putting the values of a and b in the equation, the regression line of X on Y is X = 16.4 – 1.3 Y
  • 19.
    Deviations taken fromArithmetic Means of X and Y (i) Regression Equation of X on Y : x̅ = Mean of X series; Y̅ = Mean of Y; series; =Regression coefficient of X on Y. • The regression coefficient of X on Y is denoted by the symbol bxy or b1. It measures the change in X corresponding to a unit change in Y. • When deviations are taken from the means of X and Y, the regression coefficient of X on Y is obtained as follows: bxy or
  • 20.
    (ii) Regression Equationof Y on X : x̅ = Mean of X series; Y̅ = Mean of Y series; =Regression coefficient of Yon X. byx or
  • 21.
    Illustration 2. Fromthe following data calculate the regression equations taking deviation of items from the mean of X and Y series. X 6 2 10 4 8 Y 9 11 5 8 7
  • 22.
    Solution: Calculation ofRegression Equations X (X - X̅) x x2 Y (Y - Y̅) y y2 xy 6 0 0 9 1 1 1 2 -4 16 11 3 9 -12 10 4 16 5 -3 9 -12 4 -2 4 8 0 0 0 8 2 4 7 -1 1 -2 ∑X=30 ∑x=0 ∑x2= 40 ∑Y=40 ∑y=0 ∑y2= 20 ∑xy= -25 Y̅ = ∑Y/N = 8 X̅ = ∑X/N = 6
  • 23.
    Regression Equation ofX on Y : = -1.3X̅ = 6 ; Y̅ = 8; X – 6 = -1.3 ( Y – 8) X – 6 = -1.3Y + 10.4 X = -1.3Y +16.4 or X = 16.4 – 1.3Y Regression Equation of Y on X : X̅ = 6 ; Y̅ = 8; = -0.65 Y – 8 = -0.65 ( X – 6) Y – 8 = -0.65X + 3.9 Y = -0.65X +11.9 or Y = 11.9 – 0.65X
  • 24.
    Deviations Taken fromAssumed Means • When deviations are taken from assumed means the entire procedure of finding regression equations remains the same ̶ the only difference is that instead of taking deviations from actual means, we take the deviations from assumed means. Regression Equation of X on Y : Regression Equation of Y on X :
  • 25.
    When the regressioncoefficients are calculated from correlation table values are obtained as follows: fx = Class interval of X variable fy = Class interval of y variable
  • 26.
    Illustration 3. Fromthe following data calculate regression equations taking deviation of X series from 5 and of Y series from 7. X 6 2 10 4 8 Y 9 11 5 8 7
  • 27.
    Solution: Calculation ofRegression Equations X (X - 5) dx dx2 Y (Y – 7) dy dy2 dxdy 6 1 1 9 2 4 2 2 -3 9 11 4 16 -12 10 5 25 5 -2 4 -10 4 -1 1 8 1 1 -1 8 3 9 7 0 0 0 ∑X=30 ∑dx=5 ∑dx2= 45 ∑Y=40 ∑dy=5 ∑dy2= 25 ∑dxdy= -21
  • 28.
  • 29.
  • 30.
    Graphing Regression Lines: Itis quite easy to graph the regression lines once they have been computed. All one has to do is to⎻ i. Choose any two values for the unknown variable on the right-hand side of the equation. ii. Compute the other variable. iii. Plot the two pairs of values iv. Draw a straight line through the plotted points.
  • 31.
    Illustration 4 :Show graphically the regression equations X 6 2 10 4 8 Y 9 11 5 8 7 From the following data , obtain regression equations taking deviations from 5 in case of X and 7 in case of Y:
  • 32.
    These points andthe regression line through them are in the graph below: Thus the value of regression coefficient comes out to be the same.
  • 33.
    REGRESSION EQUATIONS INCASE OF CORRELATION TABLE Finding the regression equation of Y on X and X on Y the convenient form will be Y - Y̅ = bxy (X - X̅) and X - X̅ = byx ( Y - Y̅ ) It may be noted that the regression coefficients are independent of origin but not of scale and hence necessary adjustment must be made.
  • 34.
    X Y 0-15 15-2525-35 35-45 TOTAL 0-10 1 1 - - 2 10-20 3 6 5 1 15 20-30 1 8 9 2 20 30-40 - 3 9 3 15 40-50 - - 4 4 8 TOTAL 5 18 27 10 60 Illustration 5 : Obtain the regression equation of Y on X and X on Y and the values of r from the following table giving the mark in Accountancy and Statistics:
  • 35.
    Solution: X m 5-15 15-25 25-3535-45 f fdy fdy 2 f dxdyY m 10 20 30 40 dx -1 0 1 2dy 0-10 5 -2 1 2 1 0 ⎻ ⎻ 2 -4 8 2 20-30 15 -1 3 3 6 0 5 -5 1 -2 15 -15 15 -4 20-30 25 0 1 0 8 0 9 0 2 0 20 0 0 0 30-40 35 1 ⎻ 3 0 9 9 3 6 15 15 15 15 40-50 45 2 ⎻ ⎻ 4 8 4 16 8 16 32 24 f 5 18 27 10 N=60 ∑ fdy =12 ∑ fdy 2 =70 ∑ fdxdy=37 fdx -5 0 27 20 ∑ fdx =42 fdx 2 5 0 27 40 ∑ fdx 2 =72 f dxdy 5 0 12 20 ∑ f dxdy=37
  • 38.
    The Standard Errorof Estimate is the measure of variation of an observation made around the computed regression line. Simply, it is used to check the accuracy of predictions made with the regression line. The standard error of estimate, symbolized by Syx . The standard deviation measures the dispersion about an average, such as the mean. The standard error of estimate measures the dispersion about an average line, called the regression line. STANDARD ERROR OF ESTIMATE
  • 39.
    The standard errorof regression of Y values from Yc The standard error of regression of X values from Xc
  • 40.
    Illustration 5: Giventhe following data X 6 2 10 4 8 Y 9 11 5 8 7 Find the two regression equations and calculate the standard error of the estimate (Syx & Syx )
  • 41.
    Solution: From illustration2, the two regression equations are: Y = 11.9 – 0.65 X and X = 16.4 – 1.3 Y From the regression equation of Y on X for various values of X, we can find out the corresponding Y values, and from the equation of X on Y we can find out Xc . These values are as follows: X Y Yc Xc 6 9 8.0 4.7 1.00 1.69 2 11 10.6 2.1 0.16 0.01 10 5 5.4 9.9 0.16 0.01 4 8 9.3 6.0 1.69 4.00 8 7 6.7 7.3 0.09 0.49
  • 42.
  • 43.
    Limited to the linearrelationship Subject to over fitting Easily affected by outliers Regression solution will be likely dense Regression solutions obtained by different methods LIMITATIONS OF REGRESSION ANALYSIS
  • 44.
    RECOMMENDED TEXTBOOKS: 1. S.P.Gupta,Statistical Methods, Sultan Chand and Sons, New Delhi 2017 2. R.S.N.Pillai and V. Bagavathi, Statistics, Sultan Chand and Sons, New Delhi 2010. E-LEARNING RESOURCES: https://www.statista.com. https://www.sas.com. YOUTUBE LINKS: https://youtu.be/zPG4NjIkCjc https://youtu.be/owI7zxCqNY0
  • 45.