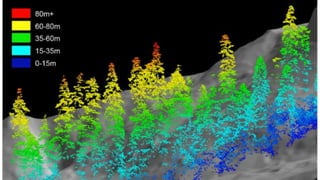
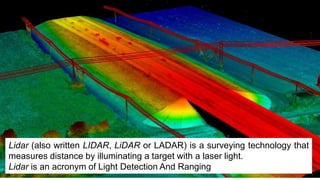
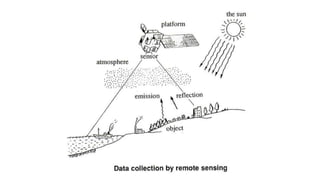
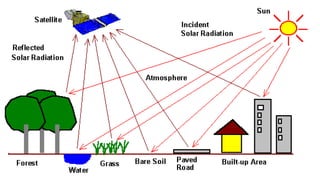
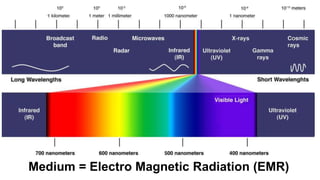
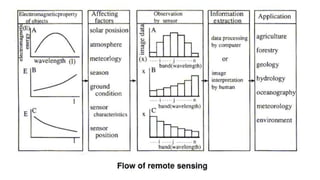
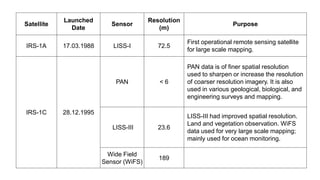
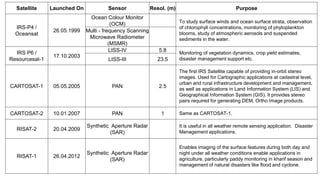
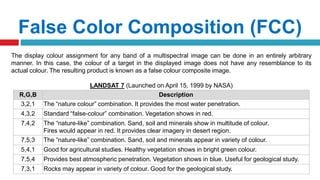
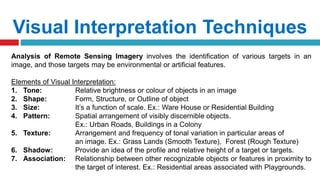
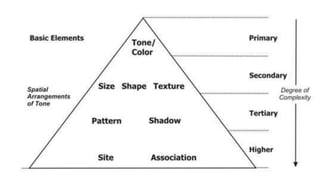
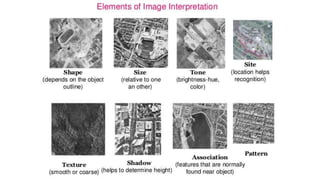
Lidar uses laser light to measure distances by illuminating targets. It is an active remote sensing method. The document discusses remote sensing concepts like platforms, sensors, data collection using electromagnetic radiation, and data interpretation techniques. It provides examples of Indian remote sensing satellites like Resourcesat and Cartosat, and describes their sensors and applications in areas like agriculture, mapping, and disaster management. Visual interpretation of remote sensing images involves analyzing tone, shape, size, pattern, texture, shadows, and associations of targets.
A remote sensing system uses a detector to sense the reflected or emitted energy from the earth's surface, perhaps modified by the intervening atmosphere. The sensor can be on a satellite, aircraft, or drone. The sensor turns the energy into a voltage, which an analog to digital converter turns into a single integer value (called the Digital Number, or DN) for the energy. Alternatively a digital detector can store the DN directly. We can then display this value with an appropriate color to build up an image of the region sensed by the system. The DN represents the energy sensed by the sensor in a particular part of the electromagnetic spectrum, emitted or reflected from a particular region. The principles can also be applied to sonar imagery, especially useful in water where sound penetrates readily whereas electromagnetic energy attenuates rapidly.
Definitions,
Remote sensing systems can be active or passive: active systems put out their own source of energy (a large "flash bulb") whereas passive systems use solar energy reflected from the surface or thermal energy emitted by the surface. Active systems can achieve higher resolution.
Satellite resolution considers four things: spatial, spectral, radiometric, and temporal resolution.
Electromagnetic radiation and the atmosphere control many aspects of a remote sensing system.
Satellite orbits determine many characteristics of the imagery, what the satellite sees, and how often it revisits an area.
The signal to noise ratio is important for the design of remote sensing systems.
Satellite band tradeoffs.
Interpreting satellite reflectance patterns and images uses various statistical measures to assess surface properties in the image.
The colors used on the display are gray shading for single bands, and RGB for multi-band composites. We can also perform image merge and sharpening to combine the advantages of both panchromatic (higher spatial resolution) and color imagery (better differentiation of surface materials).
Keys for image analysis
Hyperspectral imagery
Spectral reflectance library--different materials reflect radiation differently
Types of Platforms
1. Airbrone Platforms
2. Spacebrone Platforms
Platforms are Vital Role in remote sensing data acquisition
Necessary to correct the position the remote sensors that collect data from the objects of interest
What is Remote Sensing?
Process of Remote Sensing
Electromagnetic Radiations
Electromagnetic Spectrum
Interaction with Atmosphere
Radiations-Target Interactions
Passive Vs Active Sensing
Digital Elevation Model (DEM) is the digital representation of the land surface elevation with respect to any reference datum. DEM is frequently used to refer to any digital representation of a topographic surface. DEM is the simplest form of digital representation of topography. GIS applications depend mainly on DEMs, today.
Iirs overview -Remote sensing and GIS application in Water Resources ManagementTushar Dholakia
Remote sensing and GIS application in Water Resources Management- By S.P. Aggarval spa@iirs.gov.in Indian Institute of Remote sensing ISRO, Department of space, Dehradun
This is all about remote sensing. Remote sensing is the acquisition of information about an object or phenomenon without making physical contact with the object and thus in contrast to on-site observation, especially the Earth.Remote sensing is the process of detecting and monitoring the physical characteristics of an area by measuring its reflected and emitted radiation at a distance from the targeted area. Special cameras collect remotely sensed imagesof the Earth, which help researchers "sense" things about the Earth.
Aerial surveying technology is utilized in a wide range of fields throughout the world. These range from the creation of maps, to terrain analysis and research (rivers, soil erosion, coasts, etc.), urban planning, road planning (roads, rails, etc.), and vegetation research (forests, agriculture, lakes and marshland, etc.).
CHARACTERISTICS OF WATERSHED: size, shape; physiography, slope, climate, drainage, land use, vegetation, geology and soils, hydrology and hydrogeology, socio-economic characteristics, basic data on watersheds.
tells about history,physics of remote sensing,electromagnetic spectrum,black body radiation,atmospheric windows,interaction of EMR with atmosphere,earth surface features,spectral reflectance curves
OPEN CHANNEL FLOW AND HYDRAULIC MACHINERY
Open channel flow: Types of flows – Type of channels – Velocity distribution – Energy and momentum correction factors – Chezy’s, Manning’s; and Bazin formula for uniform flow – Most Economical sections. Critical flow: Specific energy-critical depth – computation of critical depth – critical sub-critical – super critical flows
Non-uniform flows –Dynamic equation for G.V.F., Mild, Critical, Steep, horizontal and adverse slopes-surface profiles-direct step method- Rapidly varied flow, hydraulic jump, energy dissipation
Watershed management is the investigation of the applicable aspects of a watershed pointed at the reasonable dissemination of its assets and the methodology of making and executing arrangements . Green systems has different idea , way and Technology of Watershed Management In India .
Remote sensing is the acquisition of information about an object or phenomenon without making physical contact with the object and thus in contrast to in situ observation. In modern usage, the term generally refers to the use of aerial sensor technologies to detect and classify objects on Earth (both on the surface, and in the atmosphere and oceans) by means of propagated signals (e.g. electromagnetic radiation). It may be split into active remote sensing (when a signal is first emitted from aircraft or satellites)[1][2][3] or passive (e.g. sunlight) when information is merely recorded.
APPLICATION OF REMOTE SENSING AND GIS IN AGRICULTURELagnajeetRoy
India is a country that depends on agriculture. Today in this era of technological supremacy, agriculture is also using different new technologies like some robotic machinery to remote sensing and Geographical Information System (GIS) for the betterment of agriculture. It is easy to get the information about that area where human cannot check the condition everyday and help in gathering the data with the help of remote sensing. Whereas GIS helps in preparation of map that shows an accurate representation of data we get through remote sensing. From disease estimation to stress factor due to water, from ground water quality index to acreage estimation in various way agriculture is being profited by the application of remote sensing and GIS in agriculture. The applications of those software or techniques are very new to the agriculture domain still much more exploration is needed in this part. New software’s are developing in different parts of the world and remote sensing. Today farmers understand the beneficiaries of these kinds of techniques to the farm field which help in increasing productivity that will help future generation as technology is hype in traditional system of farming.
passive and active remote sensing systems, characteristics and operationsNzar Braim
passive and active remote sensing systems,
characteristics and operations
The development of remote sensing technologies increases the potential to support more
precise, efficient, and ecologically-sensitive approaches to forest resource management. One of
the primary requirements of precision forest management is accurate and detailed 3D spatial
data relating to the type and condition of forest stands and characteristics of the underlying
terrain surface.
Element Of Civil Engineering and surveying subject as per GTU syllabus 1st sem carry out all content. also usefull for general idea about civil branch.
Introduction to Data Science, Prerequisites (tidyverse), Import Data (readr), Data Tyding (tidyr),
pivot_longer(), pivot_wider(), separate(), unite(), Data Transformation (dplyr - Grammar of Manipulation): arrange(), filter(),
select(), mutate(), summarise()m
Data Visualization (ggplot - Grammar of Graphics): Column Chart, Stacked Column Graph, Bar Graph, Line Graph, Dual Axis Chart, Area Chart, Pie Chart, Heat Map, Scatter Chart, Bubble Chart
Overview and about R, R Studio Installation, Fundamentals of R Programming: Data Structures and Data Types, Operators, Control Statements, Loop Statements, Functions,
Descriptive Analysis using R: Maximum, Minimum, Range, Mean, Median and Mode, Variance, Standard Deviation, Quantiles, IQR, Summary
Introduction to Statistics -
Sampling Techniques, Types of Statistics, Descriptive Statistics,
Inferential Statistics,
Variables and Types of Data: Qualitative, Quantitative, Discrete,
Continuous, Organizing and Graphing Data: Qualitative Data, Quantitative Data
1. Angular Components:
Component Configuration, Building a Template, Using Constructors, Using External Templates, Angular Routing to Single Page Application (SPA)
2. Data Binding:
Introduction, Interpolation, Property Binding, Attribute Binding, Class Binding, Style Binding, Event Binding, Two-way Binding.
Topics:
1. Introduction to GIS
2. Components of GIS
3. Types of Data
4. Spatial Data
5. Non-Spatial Data
6. GIS Operations
7. Coordinate Systems
8. Datum
9. Map Projections
10. Raster Data Compression Techniques
11. GIS Software
12. Free GIS Data Resources
Topics:
1. Mapping Concepts
2. Analysis with paper based Maps
3. Limitations of Paper based Maps
4. Computer Aided Cartography History and Development
5. GIS Definition
6. Advantage of Digital Maps
Topics:
1. Introduction to Fluid Dynamics
2. Surface and Body Forces
3. Equations of Motion
- Reynold’s Equation
- Navier-Stokes Equation
- Euler’s Equation
- Bernoulli’s Equation
- Bernoulli’s Equation for Real Fluid
4. Applications of Bernoulli’s Equation
5. The Momentum Equation
6. Application of Momentum Equations
- Force exerted by flowing fluid on pipe bend
- Force exerted by the nozzle on the water
7. Measurement of Flow Rate
a). Venturimeter
b). Orifice Meter
c). Pitot Tube
8. Measurement of Flow Rate in Open Channels
a) Notches
b) Weirs
1. Introduction to Kinematics
2. Methods of Describing Fluid Motion
a). Lagrangian Method
b). Eulerian Method
3. Flow Patterns
- Stream Line
- Path Line
- Streak Line
- Streak Tube
4. Classification of Fluid Flow
a). Steady and Unsteady Flow
b). Uniform and Non-Uniform Flow
c). Laminar and Turbulent Flow
d). Rotational and Irrotational Flow
e). Compressible and Incompressible Flow
f). Ideal and Real Flow
g). One, Two and Three Dimensional Flow
5. Rate of Flow (Discharge) and Continuity Equation
6. Continuity Equation in Three Dimensions
7. Velocity and Acceleration
8. Stream and Velocity Potential Functions
E-Waste or Electronic Waste may be defined as discarded computers, office electronic equipment, entertainment device electronics, mobile phones, television sets and refrigerators. This definition includes used electronics which are destined for reuse, resale, salvage, recycling, or disposal.
Biomedical Waste is any kind of waste that contains infectious material (or material that’s potentially infectious). This definition includes waste generated by healthcare facilities like physician’s offices, hospitals, dental practices, laboratories, medical research facilities, and veterinary clinics
We all have good and bad thoughts from time to time and situation to situation. We are bombarded daily with spiraling thoughts(both negative and positive) creating all-consuming feel , making us difficult to manage with associated suffering. Good thoughts are like our Mob Signal (Positive thought) amidst noise(negative thought) in the atmosphere. Negative thoughts like noise outweigh positive thoughts. These thoughts often create unwanted confusion, trouble, stress and frustration in our mind as well as chaos in our physical world. Negative thoughts are also known as “distorted thinking”.
Ethnobotany and Ethnopharmacology:
Ethnobotany in herbal drug evaluation,
Impact of Ethnobotany in traditional medicine,
New development in herbals,
Bio-prospecting tools for drug discovery,
Role of Ethnopharmacology in drug evaluation,
Reverse Pharmacology.
Palestine last event orientationfvgnh .pptxRaedMohamed3
An EFL lesson about the current events in Palestine. It is intended to be for intermediate students who wish to increase their listening skills through a short lesson in power point.
How to Create Map Views in the Odoo 17 ERPCeline George
The map views are useful for providing a geographical representation of data. They allow users to visualize and analyze the data in a more intuitive manner.
Model Attribute Check Company Auto PropertyCeline George
In Odoo, the multi-company feature allows you to manage multiple companies within a single Odoo database instance. Each company can have its own configurations while still sharing common resources such as products, customers, and suppliers.
3. Lidar (also written LIDAR, LiDAR or LADAR) is a surveying technology that
measures distance by illuminating a target with a laser light.
Lidar is an acronym of Light Detection And Ranging
4. Topics
1. Basic Concepts
2. Data and Information
3. Electromagnetic Spectrum
4. EMR Energy Interaction with Atmosphere and Earth
Surface Features
5. Indian Satellites and Sensors
6. False Color Composition (FCC)
7. Introduction to Digital Data and Visual Interpretation
Techniques
8. Advantages and Limitations
5. Introduction
Remote Sensing is the science and art of acquiring data (spectral, spatial, and
temporal) about objects, area, or phenomenon, without coming into physical contact
with the objects, or phenomenon under investigation.
Electro-magnetic radiation which is reflected or emitted from an object is the usual
source of remote sensing data.
A device to detect the electro-magnetic radiation reflected or emitted from an object
is called a "remote sensor" or "sensor". Cameras or scanners are examples of
remote sensors.
A vehicle to carry the sensor is called a "platform". Aircraft or satellites are used as
platforms.
6. Data vs Information
Data can be any character, text, words, number, pictures,
sound, or video. Data usually refers to raw data, or
unprocessed data.
Ex.: Aerial Photograph, Satellite Image etc.,
Once the data is analyzed, it is considered as information.
Ex: Topography, Contours, Elevation, Roads, Buildings etc.,
11. Types of Remote Sensing
1. Visible and Reflective Infrared Remote Sensing
The energy source used in the visible and reflective infrared remote sensing is
the sun. The sun radiates electro-magnetic energy with a peak wavelength of
0.5 m
2. Thermal Infrared Remote Sensing
The source of radiant energy used in thermal infrared remote sensing is the
object itself, because any object with a normal temperature will emit electro-
magnetic radiation with a peak at about 10 m
3. Microwave Remote Sensing
a) Passive Microwave Remote Sensing
b) Active Microwave Remote Sensing. Ex. Radar
12.
13.
14.
15.
16. Energy Interaction with Atmosphere
There are three ways in which the total incident energy will
interact with atmosphere. These are
1. Absorption
2. Scattering
3. Refraction
4. Reflection.
17. Energy Interaction with Atmosphere
Absorption:
Absorption is the process by which radiant energy is absorbed and converted into
other forms of energy. Ozone, carbon dioxide, and water vapour are the three main
atmospheric constituents that absorb radiation.
a) Ozone serves to absorb the harmful (to most living things) ultraviolet radiation
from the sun.
b) Carbon dioxide referred to as a greenhouse gas. This is because it tends to
absorb radiation strongly in the far infrared (thermal infrared) portion of the
spectrum which serves to trap this heat inside the atmosphere.
c) The water vapour in the atmosphere absorbs much of the incoming long wave
(thermal) infrared and shortwave microwave radiations. The presence of water
vapour in the lower atmosphere varies greatly from location to location and at
different times of the year.
18. Energy Interaction with Atmosphere
Scattering:
Scattering is unpredictable diffusion of electromagnetic radiation by atmospheric
particles. It occurs when particles or large gas molecules present in the atmosphere
interact with and cause the EMR to be redirected from its original path.
The amount of scattering takes place depends on several factors including the
wavelength of the radiation, the diameter of particles or gases, and the distance the
radiation travels through the atmosphere
Refraction:
Refraction is the deflection of EM radiation as it passes from one medium with one
refractive index to a medium with a different refractive index.
19. Energy Interaction with Atmosphere
Reflection is the process whereby radiation ‘bounces off’ an object like the
top of a cloud, a water body, or the terrestrial earth.
Reflection differs from scattering in that the direction associated with
scattering is unpredictable but in case of reflection it is predicable.
Reflection exhibits fundamental characteristics that are important in the
remote sensing.
20.
21. Reflectance
In remote sensing, electro-magnetic energy reflected or emitted from objects
is measured. The measurement is based on either radiometry or
photometry, with different technical terms and physical units.
Radiometry is used for physical measurement of a wide range of radiation
from x-ray to radio wave, while photometry corresponds to the human
perception of visible light based on the human eye's sensitivity.
Reflectance is defined as the ratio of incident flux on a sample surface to
reflected flux from the surface.
24. Advantages of Remote Sensing
1. Synoptic View
facilitates the study of various earths’ surface features in their spatial relation to
each other and helps to delineate the required features and phenomena.
2. Repeativity
satellites provide repetitive coverage of the earth and this temporal information is
very useful for studying landscape dynamics, and other land features and change
detection analysis.
3. Accessibility
Remote sensing process made it possible to gather information about the area
when it is not possible to do ground survey like in mountainous areas and foreign
areas. Passive remote sensing can be used in all weather and all time of a day.
25. Advantages of Remote Sensing
4. Time saving
Since information about a large area can be gathered quickly, the techniques
save time and efforts of human. It also saves the time of fieldwork.
5. Cost Effective
It is a cost-effective technique as again and again fieldwork is not required and
also a large number of users of different disciplines can share and use the same
data.
26. Limitations of Remote Sensing
1. Expensive to collect, interpret, or analyze data.
2. Powerful active remote sensor system, such as lasers or radars that emit
their own EMR, can be intrusive and affect that phenomenon being
investigated.
3. Remote sensing instruments like in situ instruments often become
uncalibrated, resulting in uncalibrated remote sensing data.
4. Inability of many sensors to obtain data and information through cloud
cover and the relatively low spatial resolution achievable with many
satellite-borne earth remote sensing instruments.
5. In addition, the need to correct for atmospheric absorption and scattering
and for the absorption of radiation through water on the ground can make
it difficult to obtain desired data and information on particular variables.
27. Types of Satellites
India has launched 84 Indian satellites (as of 22 June 2016) of many types since its first in 1975
The organisation responsible for India's satellite program is the Indian Space Research Organisation (ISRO).
Types:
1. Indian Remote Sensing Satellites ( IRS; Polar) - Altitude around 700km to 800km – Earth Observation
2. Indian National Satellites (INSAT; Geosynchronous ) - Altitude around 36000 km - Communication
SATELLITE LAUNCHED ON LAUNCH VEHICLE REMARKS
ARYABHATTA 1975 u-11 Interkosmos India’s First Experimental Satellite
BHASKARA - I 1979 C-1 Interkosmos 1st Experimental Remote Sensing Satellite
INSAT -1A 1982 Delta 3910 PAM-D Multi-purpose Communication & Meteorology Satellite
IRS – 1A 1988 Vostok First Remote Sensing Satellite
KALPANA (METSAT) 2002 PSLV-C4 First Meteorological Satellite
EDUSAT 2004 GSLV-F01 India’s First Educational Satellite
IRNSS-1A 2013 PSLV-C22 Navigation Satellite for GPS RTK
34. Satellite
Launched
Date
Sensor
Resolution
(m)
Purpose
IRS-1A 17.03.1988 LISS-I 72.5
First operational remote sensing satellite
for large scale mapping.
IRS-1C 28.12.1995
PAN < 6
PAN data is of finer spatial resolution
used to sharpen or increase the resolution
of coarser resolution imagery. It is also
used in various geological, biological, and
engineering surveys and mapping.
LISS-III 23.6
LISS-III had improved spatial resolution.
Land and vegetation observation. WiFS
data used for very large scale mapping;
mainly used for ocean monitoring.
Wide Field
Sensor (WiFS)
189
35. Satellite Launched On Sensor Resol. (m) Purpose
IRS-P4 /
Oceansat
26.05.1999
Ocean Colour Monitor
(OCM) To study surface winds and ocean surface strata, observation
of chlorophyll concentrations, monitoring of phytoplankton
blooms, study of atmospheric aerosols and suspended
sediments in the water.
Multi - frequency Scanning
Microwave Radiometer
(MSMR)
IRS P6 /
Resourcesat-1
17.10.2003
LISS-IV 5.8 Monitoring of vegetation dynamics, crop yield estimates,
disaster management support etc.LISS-III 23.5
CARTOSAT-1 05.05.2005 PAN 2.5
The first IRS Satellite capable of providing in-orbit stereo
images. Used for Cartographic applications at cadastral level,
urban and rural infrastructure development and management,
as well as applications in Land Information System (LIS) and
Geographical Information System (GIS). It provides stereo
pairs required for generating DEM, Ortho Image products.
CARTOSAT-2 10.01.2007 PAN 1 Same as CARTOSAT-1.
RISAT-2 20.04.2009
Synthetic Aperture Radar
(SAR)
It is useful in all weather remote sensing application. Disaster
Management applications.
RISAT-1 26.04.2012
Synthetic Aperture Radar
(SAR)
Enables imaging of the surface features during both day and
night under all weather conditions enable applications in
agriculture, particularly paddy monitoring in kharif season and
management of natural disasters like flood and cyclone.
36. False Color Composition (FCC)
The display colour assignment for any band of a multispectral image can be done in an entirely arbitrary
manner. In this case, the colour of a target in the displayed image does not have any resemblance to its
actual colour. The resulting product is known as a false colour composite image.
LANDSAT 7 (Launched on April 15, 1999 by NASA)
R,G,B Description
3,2,1 The “nature colour” combination. It provides the most water penetration.
4,3,2 Standard “false-colour” combination. Vegetation shows in red.
7,4,2 The “nature-like” combination. Sand, soil and minerals show in multitude of colour.
Fires would appear in red. It provides clear imagery in desert region.
7,5,3 The “nature-like” combination. Sand, soil and minerals appear in variety of colour.
5,4,1 Good for agricultural studies. Healthy vegetation shows in bright green colour.
7,5,4 Provides best atmospheric penetration. Vegetation shows in blue. Useful for geological study.
7,3,1 Rocks may appear in variety of colour. Good for the geological study.
37.
38. Visual Interpretation Techniques
Analysis of Remote Sensing Imagery involves the identification of various targets in an
image, and those targets may be environmental or artificial features.
Elements of Visual Interpretation:
1. Tone: Relative brightness or colour of objects in an image
2. Shape: Form, Structure, or Outline of object
3. Size: It’s a function of scale. Ex.: Ware House or Residential Building
4. Pattern: Spatial arrangement of visibly discernible objects.
Ex.: Urban Roads, Buildings in a Colony
5. Texture: Arrangement and frequency of tonal variation in particular areas of
an image. Ex.: Grass Lands (Smooth Texture), Forest (Rough Texture)
6. Shadow: Provide an idea of the profile and relative height of a target or targets.
7. Association: Relationship between other recognizable objects or features in proximity to
the target of interest. Ex.: Residential areas associated with Playgrounds.