Geographic Information System(GIS)
A Geographic Information System (GIS) is a computer-
based system designed to capture, store, manipulate,
analyze, manage, and present spatial or geographic data.
GIS allows users to view, understand, question, and
visualize data in many ways that reveal relationships,
patterns, and trends in the form of maps, globes, reports,
and charts.
Combines location data (maps) with descriptive data
(attributes).
Helps visualize, analyze, and interpret data to understand
relationships and trends.
3.
History
GIS Before 1960(Dark Age)
GIS concepts date back to the
18th century with early mapping
efforts. The modern GIS era began in
the 1960s–70s with computer
advances, initially used by
governments.
4.
GIS In 1960to 1975 (Pioneering)
• 1960s–70s: GIS emerged with computer advances
enabling spatial data analysis.
• Key Milestones:
• 1960: Harvard Lab founded – early GIS software.
• Mid-1960s: Canada Land Inventory used GIS for land-use
planning.
• 1969: ESRI founded – developed environmental GIS tools.
• Early 1970s: ESRI released ARC/INFO, first commercial GIS.
• Mid-1970s: First GIS conference formed.
GIS grew rapidly during this era, driven by tech advances and
institutional support.
5.
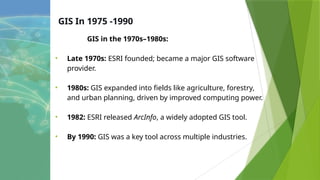
GIS In 1975-1990
GIS in the 1970s–1980s:
• Late 1970s: ESRI founded; became a major GIS software
provider.
• 1980s: GIS expanded into fields like agriculture, forestry,
and urban planning, driven by improved computing power.
• 1982: ESRI released ArcInfo, a widely adopted GIS tool.
• By 1990: GIS was a key tool across multiple industries.
6.
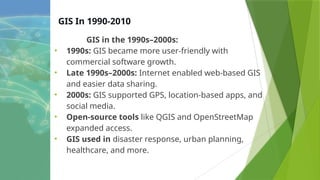
GIS In 1990-2010
GISin the 1990s–2000s:
• 1990s: GIS became more user-friendly with
commercial software growth.
• Late 1990s–2000s: Internet enabled web-based GIS
and easier data sharing.
• 2000s: GIS supported GPS, location-based apps, and
social media.
• Open-source tools like QGIS and OpenStreetMap
expanded access.
• GIS used in disaster response, urban planning,
healthcare, and more.
7.
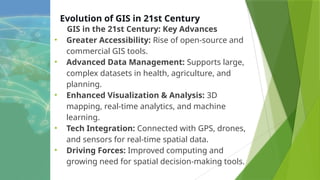
Evolution of GISin 21st Century
GIS in the 21st Century: Key Advances
• Greater Accessibility: Rise of open-source and
commercial GIS tools.
• Advanced Data Management: Supports large,
complex datasets in health, agriculture, and
planning.
• Enhanced Visualization & Analysis: 3D
mapping, real-time analytics, and machine
learning.
• Tech Integration: Connected with GPS, drones,
and sensors for real-time spatial data.
• Driving Forces: Improved computing and
growing need for spatial decision-making tools.
8.
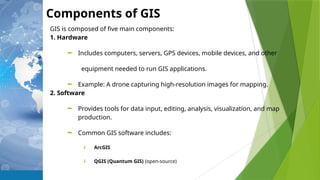
Components of GIS
GISis composed of five main components:
1. Hardware
Includes computers, servers, GPS devices, mobile devices, and other
equipment needed to run GIS applications.
Example: A drone capturing high-resolution images for mapping.
2. Software
Provides tools for data input, editing, analysis, visualization, and map
production.
Common GIS software includes:
ArcGIS
QGIS (Quantum GIS) (open-source)
9.
ArcGIS
It isa leading commercial GIS software
developed by Esri. It offers advanced
cartography, 3D integration, and over 1,500
geoprocessing tools. It is widely used for
analysis, editing, and map automation.
However, it has a high licensing cost and a
steep learning curve.
Quantum GIS (QGIS)
is a popular open-source GIS software known
for its flexibility and extensive plugin support. It
provides robust tools for mapping, analysis,
and 3D visualization. While it lacks some
10.
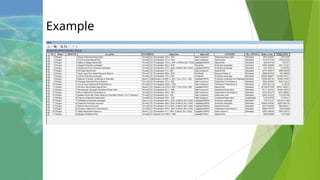
3. Data
Thecore of GIS. Data must include both:
Spatial data (location-based)
Attribute data (descriptive information)
Example: A map of schools (spatial) with names,
student count, and grades offered (attributes).
4. People
Users ranging from technical GIS analysts to decision-
makers.
Example: Urban planners, environmental scientists, or
emergency responders.
5. Methods
Includes models, analytical procedures, and workflows
that guide how GIS is used.
11.
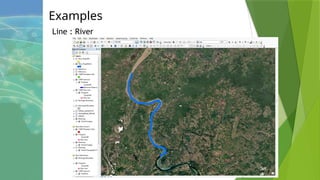
Types of GISData
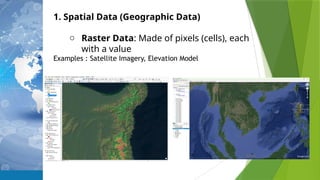
1. Spatial Data (Geographic Data)
- Refers to the actual location and shape of
geographic features.
Represented in two forms:
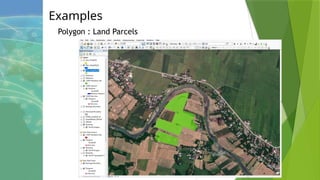
o Vector Data: Uses points, lines, and
polygons.
1. Spatial Data(Geographic Data)
o Raster Data: Made of pixels (cells), each
with a value
Examples : Satellite Imagery, Elevation Model
17.
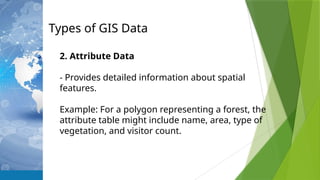
Types of GISData
2. Attribute Data
- Provides detailed information about spatial
features.
Example: For a polygon representing a forest, the
attribute table might include name, area, type of
vegetation, and visitor count.
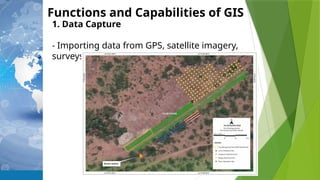
Functions and Capabilitiesof GIS
1. Data Capture
- Importing data from GPS, satellite imagery,
surveys, and sensors
20.
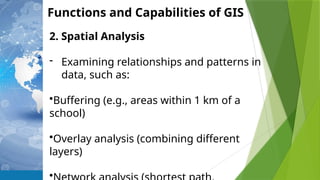
Functions and Capabilitiesof GIS
2. Spatial Analysis
- Examining relationships and patterns in
data, such as:
•Buffering (e.g., areas within 1 km of a
school)
•Overlay analysis (combining different
layers)
•
21.
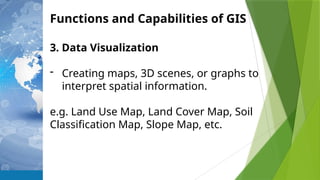
Functions and Capabilitiesof GIS
3. Data Visualization
- Creating maps, 3D scenes, or graphs to
interpret spatial information.
e.g. Land Use Map, Land Cover Map, Soil
Classification Map, Slope Map, etc.
22.
GIS Applications
1. Urbanand Regional Planning
-Analyze land use, zoning, transportation systems.
Example: Determining the best site for a new
shopping mall based on population density, income
level, and traffic flow.
23.
GIS Applications
2. EnvironmentalManagement
-Track deforestation, plantation management,
pollution sources, habitat conservation.
Example:
Mapping coral reef health in coastal regions.
Monitoring of Plantation sites
24.
GIS Applications
3. Agriculture
-Monitorcrop health, optimize irrigation, and
manage land resources.
Example: Precision farming using satellite imagery
to apply fertilizers only where needed.
Soil quality mapping.
25.
GIS Applications
4. DisasterManagement
- Identify risk zones, manage emergency response,
and aid in recovery.
Example: Real-time mapping of flood-prone areas
to guide evacuations.