Download to read offline

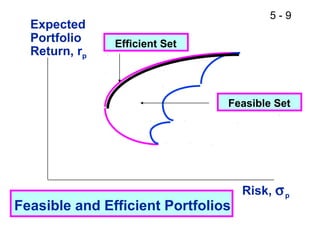
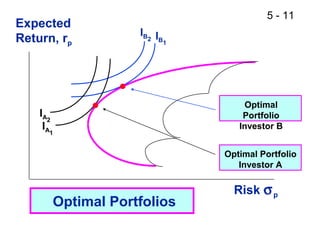


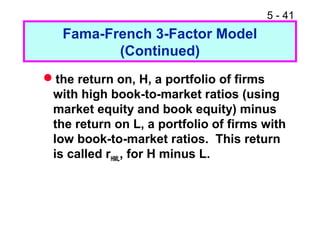
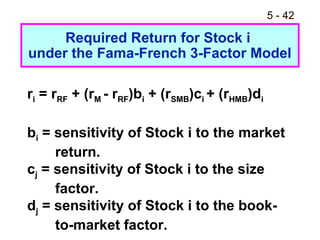
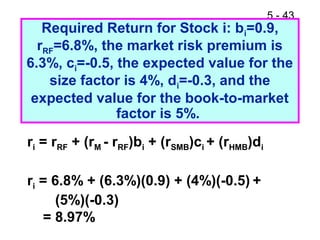
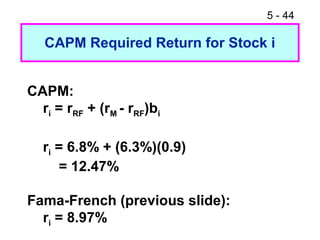

This document provides an overview of portfolio theory and several asset pricing models, including: - Portfolio theory concepts such as the efficient frontier and capital market line - The Capital Asset Pricing Model (CAPM) and its assumptions, including how betas are calculated - Criticisms of the CAPM and problems testing it empirically - The Arbitrage Pricing Theory as an alternative multi-factor model - The Fama-French three-factor model as another improvement over the single-factor CAPM


