capital assets pricing model, assumptions, implications
1.
The Capital AssetPricing Model
The Capital Asset Pricing Model
(CAPM)
(CAPM)
Dr. Rakesh Kumar Sharma
2.
The Capital AssetPricing Model
• CAPM is a model that provides a framework to determine the
required rate of return on an asset and indicates the
relationship between return and risk of the asset.
3.
CAPM
• A modelthat describes the relationship between risk and
expected return and that is used in the pricing of risky
securities.
• The model was introduced by Jack Treynor, William
Sharpe, John Lintner and Jan Mossin independently, building
on the earlier work of Harry Markowitz on diversification
and modern portfolio theory.
• The general idea behind CAPM is that investors need to be
compensated in two ways: time value of money and risk
4.
Assumptions
• Can lendand borrow unlimited amounts under the risk free
rate of interest
• Individuals seek to maximize the expected utility of their
portfolios over a single period planning horizon.
• Assume all information is available at the same time to all
investors
• The market is perfect: there are no taxes; there are no
transaction costs; securities are completely divisible; the
market is competitive.
• The quantity of risky securities in the market is given.
5.
Implications and relevanceof
CAPM
• Investors will always combine a risk-free asset with a market
portfolio of risky assets. Investors will invest in risky assets in
proportion to their market value..
• Investors can expect returns from their investment according
to the risk. This implies a linear relationship between the
asset’s expected return and its beta.
• Investors will be compensated only for that risk which they
cannot diversify. This is the market-related (systematic) risk
6.
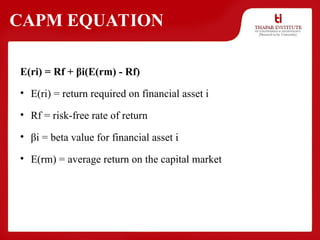
CAPM EQUATION
E(ri) =Rf + βi(E(rm) - Rf)
• E(ri) = return required on financial asset i
• Rf = risk-free rate of return
• βi = beta value for financial asset i
• E(rm) = average return on the capital market
7.
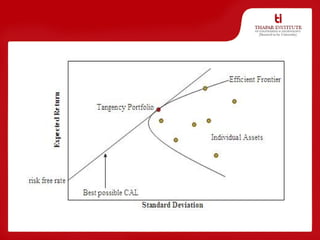
The capital MARKETLine
• The capital MARKET line (CML) is a line used in the capital
asset pricing model to illustrate the rates of return for
efficient portfolios depending on the risk-free rate of
return and the level of risk (standard deviation) for a
particular portfolio.
8.
Efficient Frontier
• Theefficient frontier (or portfolio frontier) is a concept in
modern portfolio theory introduced by Harry Markowitz and
others in 1952. It is the set of portfolios each with the feature
that no other portfolio exists with a higher expected return
but with the same standard deviation of return.
9.
Cont.....
• The efficientfrontier is the set of optimal portfolios that
offers the highest expected return for a defined level of risk or
the lowest risk for a given level of expected return.
10.
Cont......
• Portfolios thatlie below the efficient frontier are sub-optimal,
because they do not provide enough return for the level of
risk.
• Portfolios that cluster to the right of the efficient frontier are
also sub-optimal, because they have a higher level of risk for
the defined rate of return.
12.
BETA
• A measureof the volatility, or systematic risk, of a security or
portfolio compared to the market as a whole.
• Beta is used in the capital asset pricing model (CAPM), which
calculates an asset's expected return based on its beta and
market returns.
• Also known as "beta coefficient."
CAPM
An hypothesis byProfessor William F.Sharpe
– Hypothesizes that investors require higher rates of return
for greater levels of relevant risk.
• There are no prices on the model, instead it
hypothesizes the relationship between risk and return
for individual securities.
• It is often used, however, the price securities and
investments.
15.
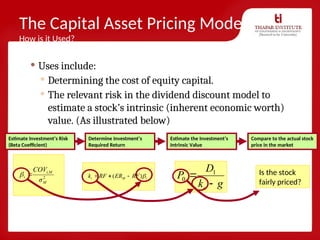
The Capital AssetPricing Model
How is it Used?
Uses include:
Determining the cost of equity capital.
The relevant risk in the dividend discount model to
estimate a stock’s intrinsic (inherent economic worth)
value. (As illustrated below)
Estimate Investment’s Risk
(Beta Coefficient)
Determine Investment’s
Required Return
Estimate the Investment’s
Intrinsic Value
Compare to the actual stock
price in the market
2
i
M
i,M
σ
COV
)
( i
M
i RF
ER
RF
k
g
k
D
P
c
1
0
Is the stock
fairly priced?
16.
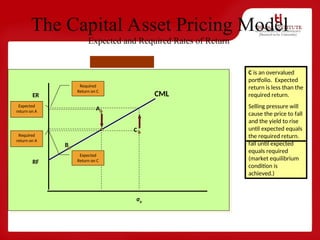
The Capital AssetPricing Model
Expected and Required Rates of Return
A is an undervalued
portfolio. Expected
return is greater than
the required return.
Demand for Portfolio
A will increase driving
up the price, and
therefore the
expected return will
fall until expected
equals required
(market equilibrium
condition is
achieved.)
Required
return on A
Expected
return on A
B is a portfolio that
offers and expected
return equal to the
required return.
σρ
ER
RF
B
C
A
CML
C is an overvalued
portfolio. Expected
return is less than the
required return.
Selling pressure will
cause the price to fall
and the yield to rise
until expected equals
the required return.
Required
Return on C
Expected
Return on C
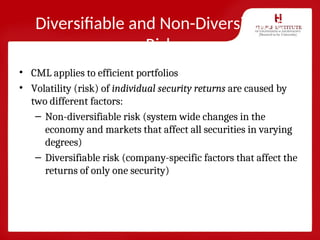
Diversifiable and Non-Diversifiable
Risk
•CML applies to efficient portfolios
• Volatility (risk) of individual security returns are caused by
two different factors:
– Non-diversifiable risk (system wide changes in the
economy and markets that affect all securities in varying
degrees)
– Diversifiable risk (company-specific factors that affect the
returns of only one security)
19.
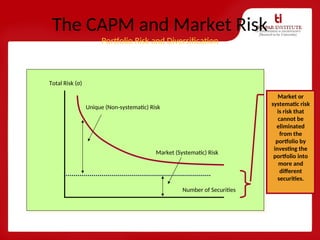
The CAPM andMarket Risk
Portfolio Risk and Diversification
Number of Securities
Total Risk (σ)
Unique (Non-systematic) Risk
Market (Systematic) Risk
Market or
systematic risk
is risk that
cannot be
eliminated
from the
portfolio by
investing the
portfolio into
more and
different
securities.
20.
Relevant Risk
Drawing aConclusion from Figure
• Figure demonstrates that an individual securities’ volatility of
return comes from two factors:
– Systematic factors
– Company-specific factors
• When combined into portfolios, company-specific risk is diversified
away.
• Since all investors are ‘diversified’ then in an efficient market, no-
one would be willing to pay a ‘premium’ for company-specific risk.
• Systematic risk is measured using the Beta Coefficient.
The Beta Coefficient
Whatis the Beta Coefficient?
• A measure of systematic (non-diversifiable) risk
• As a ‘coefficient’ the beta is a pure number and has no units
of measure.
23.
The Beta Coefficient
HowCan We Estimate the Value of the Beta Coefficient?
• There are two basic approaches to estimating the beta
coefficient:
1. Using a formula (and subjective forecasts)
2. Use of regression (using past holding period returns)
24.
The Formula forthe Beta Coefficient
Beta is equal to the covariance of the returns of the stock
with the returns of the market, divided by the variance of
the returns of the market:
,
2
i
M
i
M
i
M
i,M
σ
COV
25.
The Beta Coefficient
Howis the Beta Coefficient Interpreted?
• The beta of the market portfolio is ALWAYS = 1.0
• The beta of a security compares the volatility of its returns to the volatility of the
market returns:
βs = 1.0 - the security has the same volatility as the
market as a whole
βs > 1.0 - aggressive investment with volatility of returns
greater than the market
βs < 1.0 - defensive investment with volatility of returns
less than the market
βs < 0.0 - an investment with returns that are negatively
correlated with the returns of the market
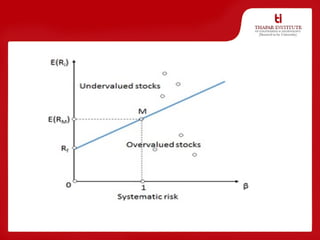
Security Market Line
•The security market line (SML) is a visual representation of
the capital asset pricing model or CAPM. It shows the
relationship between the expected return of a security and its
risk measured by its beta coefficient.
• In other words, the SML displays the expected return for any
given beta or reflects the risk associated with any given
expected return.
• E(Ri) = RF + bi×{E(RM)-RF}
28.
• Where E(Ri)is an expected return of a security, RF is a risk-
free rate, bi is a security’s beta coefficient, and E(RM) is an
expected market return.
30.
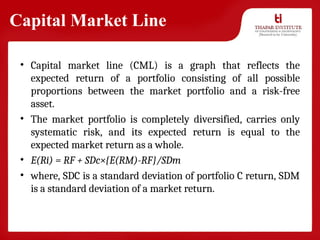
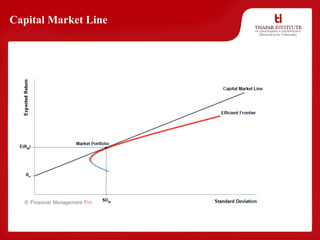
Capital Market Line
•Capital market line (CML) is a graph that reflects the
expected return of a portfolio consisting of all possible
proportions between the market portfolio and a risk-free
asset.
• The market portfolio is completely diversified, carries only
systematic risk, and its expected return is equal to the
expected market return as a whole.
• E(Ri) = RF + SDc×{E(RM)-RF}/SDm
• where, SDC is a standard deviation of portfolio C return, SDM
is a standard deviation of a market return.
Differences between CMLand SML
• Following are the differences between CML and SML:
• 1. The CML is a line that is used to show the rates of return,
which depends on risk-free rates of return and levels of risk
for a specific portfolio. SML, which is also called a
Characteristic Line, is a graphical representation of the
market’s risk and return at a given time.
• 2. While standard deviation is the measure of risk in CML,
Beta coefficient determines the risk factors of the SML.
33.
3. While theCapital Market Line graphs define efficient
portfolios, the Security Market Line graphs define both
efficient and non-efficient portfolios.
4. The Capital Market Line is considered to be superior when
measuring the risk factors.
34.
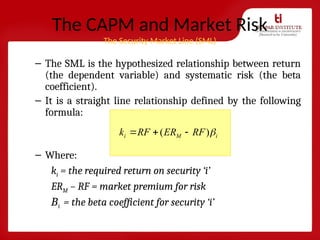
The CAPM andMarket Risk
The Security Market Line (SML)
– The SML is the hypothesized relationship between return
(the dependent variable) and systematic risk (the beta
coefficient).
– It is a straight line relationship defined by the following
formula:
– Where:
ki = the required return on security ‘i’
ERM – RF = market premium for risk
Βi = the beta coefficient for security ‘i’
)
( i
M
i RF
ER
RF
k
35.
βA
ER
RF
β
B
A
βB
SML
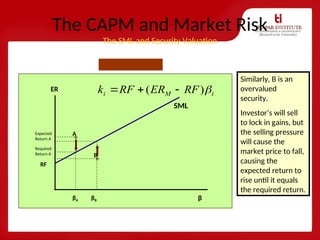
The CAPM andMarket Risk
The SML and Security Valuation
i
M
i RF
ER
RF
k
)
(
Required returns
are forecast using
this equation.
You can see that
the required return
on any security is a
function of its
systematic risk (β)
and market factors
(RF and market
premium for risk)
A is an undervalued
security because its
expected return is
greater than the
required return.
Investors will ‘flock’
to A and bid up the
price causing
expected return to
fall till it equals the
required return.
Required
Return A
Expected
Return A
Similarly, B is an
overvalued
security.
Investor’s will sell
to lock in gains, but
the selling pressure
will cause the
market price to fall,
causing the
expected return to
rise until it equals
the required return.
36.
The CAPM inSummary
The SML and CML
– The CAPM is well entrenched and widely used by
investors, managers and financial institutions.
– It is a single factor model because it based on the
hypothesis that required rate of return can be predicted
using one factor – systematic risk
– The SML is used to price individual investments and uses
the beta coefficient as the measure of risk.
– The CML is used with diversified portfolios and uses the
standard deviation as the measure of risk.