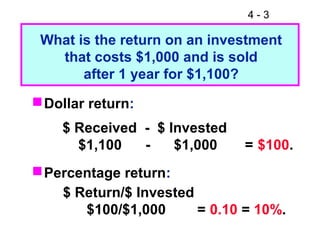
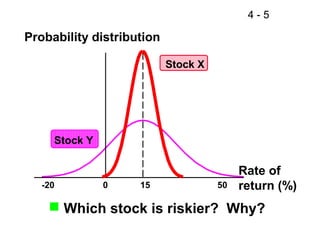
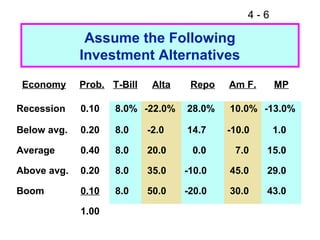
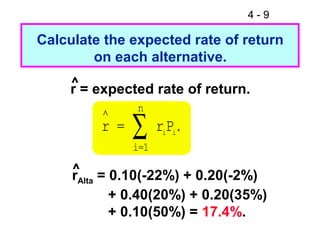
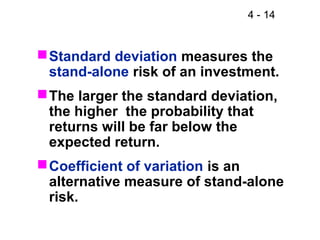
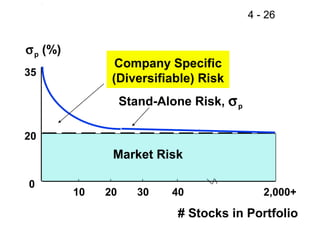
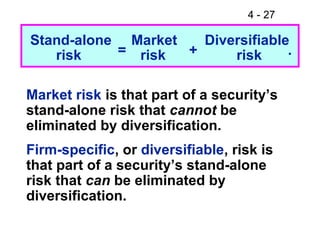
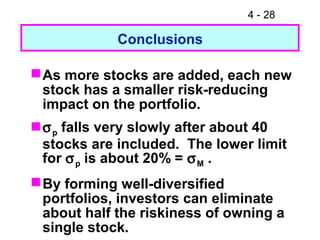
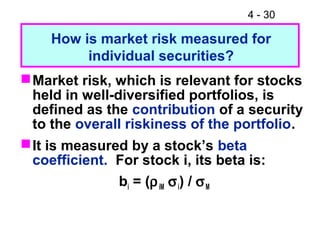
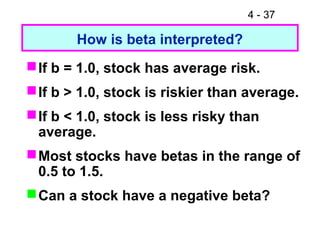
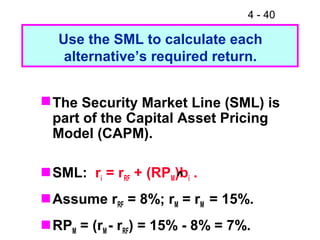
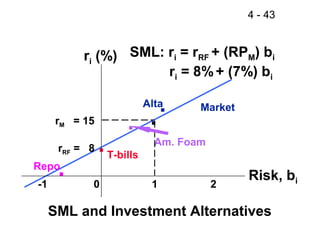
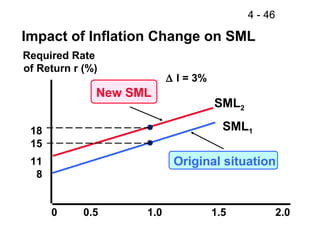
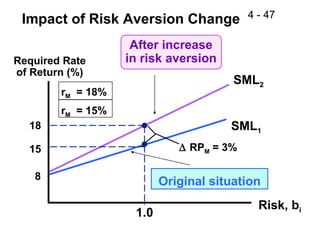
SlideShare a Scribd company logo
1 of 48
4 - 1
CHAPTER 4
Risk and Return: The Basics
Basic return concepts
Basic risk concepts
Stand-alone risk
Portfolio (market) risk
Risk and return: CAPM/SML
4 - 2
What are investment returns?
Investment returns measure the
financial results of an investment.
Returns may be historical or
prospective (anticipated).
Returns can be expressed in:
Dollar terms.
Percentage terms.
4 - 3
What is the return on an investment
that costs $1,000 and is sold
after 1 year for $1,100?
Dollar return:
Percentage return:
$ Received - $ Invested
$1,100 - $1,000 = $100.
$ Return/$ Invested
$100/$1,000 = 0.10 = 10%.
4 - 4
What is investment risk?
Typically, investment returns are not
known with certainty.
Investment risk pertains to the
probability of earning a return less
than that expected.
The greater the chance of a return far
below the expected return, the
greater the risk.
4 - 5
Probability distribution
Rate of
return (%)50150-20
Stock X
Stock Y
 Which stock is riskier? Why?
4 - 6
Assume the Following
Investment Alternatives
Economy Prob. T-Bill Alta Repo Am F. MP
Recession 0.10 8.0% -22.0% 28.0% 10.0% -13.0%
Below avg. 0.20 8.0 -2.0 14.7 -10.0 1.0
Average 0.40 8.0 20.0 0.0 7.0 15.0
Above avg. 0.20 8.0 35.0 -10.0 45.0 29.0
Boom 0.10 8.0 50.0 -20.0 30.0 43.0
1.00
4 - 7
What is unique about
the T-bill return?
The T-bill will return 8% regardless
of the state of the economy.
Is the T-bill riskless? Explain.
4 - 8
Do the returns of Alta Inds. and Repo
Men move with or counter to the
economy?
 Alta Inds. moves with the economy, so it
is positively correlated with the
economy. This is the typical situation.
 Repo Men moves counter to the
economy. Such negative correlation is
unusual.
4 - 9
Calculate the expected rate of return
on each alternative.
.∑
∧ n
1=i
iiPr=r
r = expected rate of return.
rAlta = 0.10(-22%) + 0.20(-2%)
+ 0.40(20%) + 0.20(35%)
+ 0.10(50%) = 17.4%.
^
^
4 - 10
 Alta has the highest rate of return.
 Does that make it best?
r
Alta 17.4%
Market 15.0
Am. Foam 13.8
T-bill 8.0
Repo Men 1.7
^
4 - 11
What is the standard deviation
of returns for each alternative?
.
Variance
deviationStandard
1
2
2
∑=
∧






−=
==
=
n
i
ii Prr
σσ
σ
4 - 12
σT-bills = 0.0%.
σAlta = 20.0%.
σRepo = 13.4%.
σAm Foam = 18.8%.
σMarket = 15.3%.
.
1
2
∑=
∧






−=
n
i
ii Prrσ
Alta Inds:
σ = ((-22 - 17.4)2
0.10 + (-2 - 17.4)2
0.20
+ (20 - 17.4)2
0.40 + (35 - 17.4)2
0.20
+ (50 - 17.4)2
0.10)1/2
= 20.0%.
4 - 13
Prob.
Rate of Return (%)
T-bill
Am. F.
Alta
0 8 13.8 17.4
4 - 14
Standard deviation measures the
stand-alone risk of an investment.
The larger the standard deviation,
the higher the probability that
returns will be far below the
expected return.
Coefficient of variation is an
alternative measure of stand-alone
risk.
4 - 15
Expected Return versus Risk
Expected
Security return Risk, σ
Alta Inds. 17.4% 20.0%
Market 15.0 15.3
Am. Foam 13.8 18.8
T-bills 8.0 0.0
Repo Men 1.7 13.4
4 - 16
Coefficient of Variation:
CV = Standard deviation/Expected return.
CVT-BILLS
= 0.0%/8.0% = 0.0.
CVAlta Inds
= 20.0%/17.4% = 1.1.
CVRepo Men
= 13.4%/1.7% = 7.9.
CVAm. Foam
= 18.8%/13.8% = 1.4.
CVM
= 15.3%/15.0% = 1.0.
4 - 17
Expected Return versus Coefficient of
Variation
Expecte
d
Risk: Risk
:
Security return σ CV
Alta Inds 17.4% 20.0% 1.1
Market 15.0 15.3 1.0
Am. Foam 13.8 18.8 1.4
T-bills 8.0 0.0 0.0
Repo Men 1.7 13.4 7.9
4 - 18
T-bills
Coll.
Mkt
USR
Alta
0.0%
2.0%
4.0%
6.0%
8.0%
10.0%
12.0%
14.0%
16.0%
18.0%
20.0%
0.0% 5.0% 10.0% 15.0% 20.0% 25.0%
Risk (Std. Dev.)
Return
Return vs. Risk (Std. Dev.):
Which investment is best?
4 - 19
Portfolio Risk and Return
Assume a two-stock portfolio with
$50,000 in Alta Inds. and $50,000 in
Repo Men.
Calculate rp and σp.^
4 - 20
Portfolio Return, rp
rp is a weighted average:
rp = 0.5(17.4%) + 0.5(1.7%) = 9.6%.
rp is between rAlta and rRepo.
^
^
^
^
^ ^
^ ^
rp = Σ wiri.
n
i = 1
4 - 21
Alternative Method
rp = (3.0%)0.10 + (6.4%)0.20 + (10.0%)0.40
+ (12.5%)0.20 + (15.0%)0.10 = 9.6%.
^
Estimated Return
(More...)
Economy Prob. Alta Repo Port.
Recession 0.10 -22.0% 28.0% 3.0%
Below avg. 0.20 -2.0 14.7 6.4
Average 0.40 20.0 0.0 10.0
Above avg. 0.20 35.0 -10.0 12.5
Boom 0.10 50.0 -20.0 15.0
4 - 22
σp = ((3.0 - 9.6)2
0.10 + (6.4 - 9.6)2
0.20 +
(10.0 - 9.6)2
0.40 + (12.5 - 9.6)2
0.20
+ (15.0 - 9.6)2
0.10)1/2
= 3.3%.
σp is much lower than:
either stock (20% and 13.4%).
average of Alta and Repo (16.7%).
The portfolio provides average return
but much lower risk. The key here is
negative correlation.
4 - 23
Two-Stock Portfolios
Two stocks can be combined to form
a riskless portfolio if ρ = -1.0.
Risk is not reduced at all if the two
stocks have ρ = +1.0.
In general, stocks have ρ ≈ 0.65, so
risk is lowered but not eliminated.
Investors typically hold many stocks.
What happens when ρ = 0?
4 - 24
What would happen to the
risk of an average 1-stock
portfolio as more randomly
selected stocks were added?
σp would decrease because the added
stocks would not be perfectly correlated,
but rp would remain relatively constant.
^
4 - 25
Large
0 15
Prob.
2
1
σ1 ≈ 35% ; σLarge ≈ 20%.
Return
4 - 26
# Stocks in Portfolio
10 20 30 40 2,000+
Company Specific
(Diversifiable) Risk
Market Risk
20
0
Stand-Alone Risk, σp
σp (%)
35
4 - 27
Stand-alone Market Diversifiable
Market risk is that part of a security’s
stand-alone risk that cannot be
eliminated by diversification.
Firm-specific, or diversifiable, risk is
that part of a security’s stand-alone
risk that can be eliminated by
diversification.
risk risk risk= + .
4 - 28
Conclusions
As more stocks are added, each new
stock has a smaller risk-reducing
impact on the portfolio.
σp falls very slowly after about 40
stocks are included. The lower limit
for σp is about 20% = σM .
By forming well-diversified
portfolios, investors can eliminate
about half the riskiness of owning a
single stock.
4 - 29
No. Rational investors will minimize
risk by holding portfolios.
They bear only market risk, so prices
and returns reflect this lower risk.
The one-stock investor bears higher
(stand-alone) risk, so the return is less
than that required by the risk.
Can an investor holding one stock earn
a return commensurate with its risk?
4 - 30
Market risk, which is relevant for stocks
held in well-diversified portfolios, is
defined as the contribution of a security
to the overall riskiness of the portfolio.
It is measured by a stock’s beta
coefficient. For stock i, its beta is:
bi = (ρiM σi) / σM
How is market risk measured for
individual securities?
4 - 31
How are betas calculated?
In addition to measuring a stock’s
contribution of risk to a portfolio,
beta also which measures the
stock’s volatility relative to the
market.
4 - 32
Using a Regression to Estimate Beta
Run a regression with returns on
the stock in question plotted on
the Y axis and returns on the
market portfolio plotted on the X
axis.
The slope of the regression line,
which measures relative volatility,
is defined as the stock’s beta
coefficient, or b.
4 - 33
Use the historical stock returns to
calculate the beta for PQU.
Year Market PQU
1 25.7% 40.0%
2 8.0% -15.0%
3 -11.0% -15.0%
4 15.0% 35.0%
5 32.5% 10.0%
6 13.7% 30.0%
7 40.0% 42.0%
8 10.0% -10.0%
9 -10.8% -25.0%
10 -13.1% 25.0%
4 - 34
Calculating Beta for PQU
r PQU = 0.83r M + 0.03
R
2
= 0.36
-40%
-20%
0%
20%
40%
-40% -20% 0% 20% 40%
r M
r KWE
4 - 35
What is beta for PQU?
The regression line, and hence
beta, can be found using a
calculator with a regression
function or a spreadsheet program.
In this example, b = 0.83.
4 - 36
Calculating Beta in Practice
Many analysts use the S&P 500 to
find the market return.
Analysts typically use four or five
years’ of monthly returns to
establish the regression line.
 Some analysts use 52 weeks of
weekly returns.
4 - 37
If b = 1.0, stock has average risk.
If b > 1.0, stock is riskier than average.
If b < 1.0, stock is less risky than
average.
Most stocks have betas in the range of
0.5 to 1.5.
Can a stock have a negative beta?
How is beta interpreted?
4 - 38
Finding Beta Estimates on the Web
Go to www.thomsonfn.com.
Enter the ticker symbol for a
“Stock Quote”, such as IBM
or Dell, then click GO.
When the quote comes up,
select Company Earnings,
then GO.
4 - 39
Expected Return versus Market Risk
 Which of the alternatives is best?
Expected
Security return Risk, b
Alta 17.4% 1.29
Market 15.0 1.00
Am. Foam 13.8 0.68
T-bills 8.0 0.00
Repo Men 1.7 -0.86
4 - 40
Use the SML to calculate each
alternative’s required return.
The Security Market Line (SML) is
part of the Capital Asset Pricing
Model (CAPM).
SML: ri = rRF + (RPM)bi .
Assume rRF = 8%; rM = rM = 15%.
RPM = (rM - rRF) = 15% - 8% = 7%.
^
4 - 41
Required Rates of Return
rAlta = 8.0% + (7%)(1.29)
= 8.0% + 9.0% = 17.0%.
rM = 8.0% + (7%)(1.00) = 15.0%.
rAm. F. = 8.0% + (7%)(0.68) = 12.8%.
rT-bill = 8.0% + (7%)(0.00) = 8.0%.
rRepo = 8.0% + (7%)(-0.86) = 2.0%.
4 - 42
Expected versus Required Returns
^r r
Alta 17.4% 17.0% Undervalued
Market 15.0 15.0 Fairly valued
Am. F. 13.8 12.8 Undervalued
T-bills 8.0 8.0 Fairly valued
Repo 1.7 2.0 Overvalued
4 - 43
.
.Repo
.Alta
T-bills
.
Am. Foam
rM = 15
rRF = 8
-1 0 1 2
.
SML: ri = rRF + (RPM) bi
ri = 8%+ (7%) bi
ri (%)
Risk, bi
SML and Investment Alternatives
Market
4 - 44
Calculate beta for a portfolio with 50%
Alta and 50% Repo
bp = Weighted average
= 0.5(bAlta) + 0.5(bRepo)
= 0.5(1.29) + 0.5(-0.86)
= 0.22.
4 - 45
What is the required rate of return
on the Alta/Repo portfolio?
rp = Weighted average r
= 0.5(17%) + 0.5(2%) = 9.5%.
Or use SML:
rp = rRF + (RPM) bp
= 8.0% + 7%(0.22) = 9.5%.
4 - 46
SML1
Original situation
Required Rate
of Return r (%)
SML2
0 0.5 1.0 1.5 2.0
18
15
11
8
New SML
∆ I = 3%
Impact of Inflation Change on SML
4 - 47
rM = 18%
rM = 15%
SML1
Original situation
Required Rate
of Return (%)
SML2
After increase
in risk aversion
Risk, bi
18
15
8
1.0
∆ RPM = 3%
Impact of Risk Aversion Change
4 - 48
Has the CAPM been completely confirmed
or refuted through empirical tests?
No. The statistical tests have
problems that make empirical
verification or rejection virtually
impossible.
Investors’ required returns are
based on future risk, but betas are
calculated with historical data.
Investors may be concerned about
both stand-alone and market risk.

More Related Content

What's hot

Fm11 ch 04 show
Fm11 ch 04 showFm11 ch 04 show
Fm11 ch 04 showAdi Susilo
 
Measuring portfolio risk
Measuring portfolio riskMeasuring portfolio risk
Measuring portfolio riskUrusha Hada
 
3. sharpe index model
3. sharpe  index model3. sharpe  index model
3. sharpe index modelAkash Bakshi
 
Risk adjusted performance
Risk adjusted performanceRisk adjusted performance
Risk adjusted performanceTushar Pawar
 
MBA 8480 - Portfolio Theory and Asset Pricing
MBA 8480 - Portfolio Theory and Asset PricingMBA 8480 - Portfolio Theory and Asset Pricing
MBA 8480 - Portfolio Theory and Asset PricingWildcatSchoolofBusiness
 
Sharpe index model
Sharpe index modelSharpe index model
Sharpe index modelAshwini Das
 
Chapter v capital market theory
Chapter v  capital market theoryChapter v  capital market theory
Chapter v capital market theorynirdoshk88
 
Financial Management: Capital Asset Pricing Model (CAPM)
Financial Management: Capital Asset Pricing Model (CAPM)Financial Management: Capital Asset Pricing Model (CAPM)
Financial Management: Capital Asset Pricing Model (CAPM)Kamba Saleh Kidandaire
 
capital asset pricing model
capital asset pricing modelcapital asset pricing model
capital asset pricing modelAditya Mehta
 
Coursework- Soton (Single Index Model and CAPM)
Coursework- Soton (Single Index Model and CAPM)Coursework- Soton (Single Index Model and CAPM)
Coursework- Soton (Single Index Model and CAPM)Ece Akbulut
 
Capital market theory
Capital market theoryCapital market theory
Capital market theoryStudent
 
Capital Asset Pricing Model
Capital Asset Pricing ModelCapital Asset Pricing Model
Capital Asset Pricing ModelRod Medallon
 
5.capital asset pricing model
5.capital asset pricing model5.capital asset pricing model
5.capital asset pricing modelAkash Bakshi
 
Capital asset pricing model
Capital asset pricing modelCapital asset pricing model
Capital asset pricing modelZhan Hui
 
Topic 4[1] finance
Topic 4[1] financeTopic 4[1] finance
Topic 4[1] financeFiqa Alya
 

What's hot (20)

Fm11 ch 04 show
Fm11 ch 04 showFm11 ch 04 show
Fm11 ch 04 show
 
Measuring portfolio risk
Measuring portfolio riskMeasuring portfolio risk
Measuring portfolio risk
 
3. sharpe index model
3. sharpe  index model3. sharpe  index model
3. sharpe index model
 
Risk adjusted performance
Risk adjusted performanceRisk adjusted performance
Risk adjusted performance
 
MBA 8480 - Portfolio Theory and Asset Pricing
MBA 8480 - Portfolio Theory and Asset PricingMBA 8480 - Portfolio Theory and Asset Pricing
MBA 8480 - Portfolio Theory and Asset Pricing
 
Sharpe index model
Sharpe index modelSharpe index model
Sharpe index model
 
Chapter v capital market theory
Chapter v  capital market theoryChapter v  capital market theory
Chapter v capital market theory
 
Financial Management: Capital Asset Pricing Model (CAPM)
Financial Management: Capital Asset Pricing Model (CAPM)Financial Management: Capital Asset Pricing Model (CAPM)
Financial Management: Capital Asset Pricing Model (CAPM)
 
Chapter 7
Chapter 7Chapter 7
Chapter 7
 
capital asset pricing model
capital asset pricing modelcapital asset pricing model
capital asset pricing model
 
Coursework- Soton (Single Index Model and CAPM)
Coursework- Soton (Single Index Model and CAPM)Coursework- Soton (Single Index Model and CAPM)
Coursework- Soton (Single Index Model and CAPM)
 
Capital market theory
Capital market theoryCapital market theory
Capital market theory
 
Capital Asset Pricing Model
Capital Asset Pricing ModelCapital Asset Pricing Model
Capital Asset Pricing Model
 
Lecture 5
Lecture 5Lecture 5
Lecture 5
 
5.capital asset pricing model
5.capital asset pricing model5.capital asset pricing model
5.capital asset pricing model
 
Capital Market Line
Capital Market LineCapital Market Line
Capital Market Line
 
MBA 8480 - Valuation Principles
MBA 8480 - Valuation PrinciplesMBA 8480 - Valuation Principles
MBA 8480 - Valuation Principles
 
Capital asset pricing model
Capital asset pricing modelCapital asset pricing model
Capital asset pricing model
 
12 apt
12 apt12 apt
12 apt
 
Topic 4[1] finance
Topic 4[1] financeTopic 4[1] finance
Topic 4[1] finance
 

Similar to Fm11 ch 04 risk and return the basics

financial management chapter 4 Risk and Return
financial management chapter 4 Risk and Returnfinancial management chapter 4 Risk and Return
financial management chapter 4 Risk and Returnsufyanraza1
 
1CHAPTER 6Risk, Return, and the Capital Asset Pricing Model.docx
1CHAPTER 6Risk, Return, and the Capital Asset Pricing Model.docx1CHAPTER 6Risk, Return, and the Capital Asset Pricing Model.docx
1CHAPTER 6Risk, Return, and the Capital Asset Pricing Model.docxhyacinthshackley2629
 
CH 04 - Risk & Return Basics
CH 04 - Risk & Return BasicsCH 04 - Risk & Return Basics
CH 04 - Risk & Return BasicsMentari Pagi
 
Risk, Return, & the Capital Asset Pricing Model
Risk, Return, & the Capital Asset Pricing ModelRisk, Return, & the Capital Asset Pricing Model
Risk, Return, & the Capital Asset Pricing ModelTanjin Tamanna urmi
 
Financial Management: Risk and Rates of Return
Financial Management: Risk and Rates of ReturnFinancial Management: Risk and Rates of Return
Financial Management: Risk and Rates of Returnpetch243
 
Risk and return relationship shows in historically
Risk and return relationship shows in historicallyRisk and return relationship shows in historically
Risk and return relationship shows in historicallyssusera9d1141
 
Risk And Rate Of Returns In Financial Management
Risk And Rate Of Returns In Financial ManagementRisk And Rate Of Returns In Financial Management
Risk And Rate Of Returns In Financial ManagementKhawaja Naveed
 
Monu Risk Return
Monu Risk ReturnMonu Risk Return
Monu Risk Returnmonu825
 
Riskandrateofreturnsinfinancialmanagement 100331231141-phpapp01
Riskandrateofreturnsinfinancialmanagement 100331231141-phpapp01Riskandrateofreturnsinfinancialmanagement 100331231141-phpapp01
Riskandrateofreturnsinfinancialmanagement 100331231141-phpapp01jocelyn rojo
 
Chapter13EquityValuation.ppt
Chapter13EquityValuation.pptChapter13EquityValuation.ppt
Chapter13EquityValuation.pptrekhabawa2
 
GSM5400 Financial Management MBA Quick Notes
GSM5400 Financial Management MBA Quick NotesGSM5400 Financial Management MBA Quick Notes
GSM5400 Financial Management MBA Quick NotesAminudin Saari
 
risk return hand out note chapter three.
risk return hand out note chapter three.risk return hand out note chapter three.
risk return hand out note chapter three.DerejeUrgecha1
 
someraj1-Project I Description
someraj1-Project I Descriptionsomeraj1-Project I Description
someraj1-Project I DescriptionAnthony Somers
 
Fin 515 week 6
Fin 515 week 6Fin 515 week 6
Fin 515 week 6ecambry
 
International Portfolio Investment and Diversification2.pptx
International Portfolio Investment and Diversification2.pptxInternational Portfolio Investment and Diversification2.pptx
International Portfolio Investment and Diversification2.pptxVenanceNDALICHAKO1
 

Similar to Fm11 ch 04 risk and return the basics (20)

financial management chapter 4 Risk and Return
financial management chapter 4 Risk and Returnfinancial management chapter 4 Risk and Return
financial management chapter 4 Risk and Return
 
1CHAPTER 6Risk, Return, and the Capital Asset Pricing Model.docx
1CHAPTER 6Risk, Return, and the Capital Asset Pricing Model.docx1CHAPTER 6Risk, Return, and the Capital Asset Pricing Model.docx
1CHAPTER 6Risk, Return, and the Capital Asset Pricing Model.docx
 
Pk
PkPk
Pk
 
CH 04 - Risk & Return Basics
CH 04 - Risk & Return BasicsCH 04 - Risk & Return Basics
CH 04 - Risk & Return Basics
 
Risk, Return, & the Capital Asset Pricing Model
Risk, Return, & the Capital Asset Pricing ModelRisk, Return, & the Capital Asset Pricing Model
Risk, Return, & the Capital Asset Pricing Model
 
Investment returns
Investment returnsInvestment returns
Investment returns
 
Financial Management: Risk and Rates of Return
Financial Management: Risk and Rates of ReturnFinancial Management: Risk and Rates of Return
Financial Management: Risk and Rates of Return
 
Chapter 08
Chapter 08Chapter 08
Chapter 08
 
Risk and return relationship shows in historically
Risk and return relationship shows in historicallyRisk and return relationship shows in historically
Risk and return relationship shows in historically
 
Risk And Rate Of Returns In Financial Management
Risk And Rate Of Returns In Financial ManagementRisk And Rate Of Returns In Financial Management
Risk And Rate Of Returns In Financial Management
 
Monu Risk Return
Monu Risk ReturnMonu Risk Return
Monu Risk Return
 
Riskandrateofreturnsinfinancialmanagement 100331231141-phpapp01
Riskandrateofreturnsinfinancialmanagement 100331231141-phpapp01Riskandrateofreturnsinfinancialmanagement 100331231141-phpapp01
Riskandrateofreturnsinfinancialmanagement 100331231141-phpapp01
 
Chapter13EquityValuation.ppt
Chapter13EquityValuation.pptChapter13EquityValuation.ppt
Chapter13EquityValuation.ppt
 
GSM5400 Financial Management MBA Quick Notes
GSM5400 Financial Management MBA Quick NotesGSM5400 Financial Management MBA Quick Notes
GSM5400 Financial Management MBA Quick Notes
 
risk return.ppt
risk return.pptrisk return.ppt
risk return.ppt
 
risk return hand out note chapter three.
risk return hand out note chapter three.risk return hand out note chapter three.
risk return hand out note chapter three.
 
ch 10; cost of capital
ch 10; cost of capitalch 10; cost of capital
ch 10; cost of capital
 
someraj1-Project I Description
someraj1-Project I Descriptionsomeraj1-Project I Description
someraj1-Project I Description
 
Fin 515 week 6
Fin 515 week 6Fin 515 week 6
Fin 515 week 6
 
International Portfolio Investment and Diversification2.pptx
International Portfolio Investment and Diversification2.pptxInternational Portfolio Investment and Diversification2.pptx
International Portfolio Investment and Diversification2.pptx
 

More from Nhu Tuyet Tran

đồ áN nghiệp vụ ngân hàng 1
đồ áN nghiệp vụ ngân hàng 1đồ áN nghiệp vụ ngân hàng 1
đồ áN nghiệp vụ ngân hàng 1Nhu Tuyet Tran
 
Thực trạng đô la hoá ở việt nam
Thực trạng đô la hoá ở việt namThực trạng đô la hoá ở việt nam
Thực trạng đô la hoá ở việt namNhu Tuyet Tran
 
Fm11 ch 30 financial management in not for-profit businesses
Fm11 ch 30 financial management in not for-profit businessesFm11 ch 30 financial management in not for-profit businesses
Fm11 ch 30 financial management in not for-profit businessesNhu Tuyet Tran
 
Fm11 ch 29 pension plan management
Fm11 ch 29 pension plan managementFm11 ch 29 pension plan management
Fm11 ch 29 pension plan managementNhu Tuyet Tran
 
Fm11 ch 28 advanced issues in cash management and inventory control
Fm11 ch 28 advanced issues in cash management and inventory controlFm11 ch 28 advanced issues in cash management and inventory control
Fm11 ch 28 advanced issues in cash management and inventory controlNhu Tuyet Tran
 
Fm11 ch 24 bankruptcy, reorganization, and liquidation
Fm11 ch 24 bankruptcy, reorganization, and liquidationFm11 ch 24 bankruptcy, reorganization, and liquidation
Fm11 ch 24 bankruptcy, reorganization, and liquidationNhu Tuyet Tran
 
Fm11 ch 27 banking relationships
Fm11 ch 27 banking relationshipsFm11 ch 27 banking relationships
Fm11 ch 27 banking relationshipsNhu Tuyet Tran
 
Fm11 ch 26 multinational financial management
Fm11 ch 26 multinational financial managementFm11 ch 26 multinational financial management
Fm11 ch 26 multinational financial managementNhu Tuyet Tran
 
Fm11 ch 25 mergers, lb os, divestitures, and holding companies
Fm11 ch 25 mergers, lb os, divestitures, and holding companiesFm11 ch 25 mergers, lb os, divestitures, and holding companies
Fm11 ch 25 mergers, lb os, divestitures, and holding companiesNhu Tuyet Tran
 
Fm11 ch 23 derivatives and risk management
Fm11 ch 23 derivatives and risk managementFm11 ch 23 derivatives and risk management
Fm11 ch 23 derivatives and risk managementNhu Tuyet Tran
 
Fm11 ch 22 working capital management
Fm11 ch 22 working capital managementFm11 ch 22 working capital management
Fm11 ch 22 working capital managementNhu Tuyet Tran
 
Fm11 ch 20 lease financing
Fm11 ch 20 lease financingFm11 ch 20 lease financing
Fm11 ch 20 lease financingNhu Tuyet Tran
 
Fm11 ch 21 hybrid financing preferred stock,warrants, and convertibles
Fm11 ch 21 hybrid financing preferred stock,warrants, and convertiblesFm11 ch 21 hybrid financing preferred stock,warrants, and convertibles
Fm11 ch 21 hybrid financing preferred stock,warrants, and convertiblesNhu Tuyet Tran
 
Fm11 ch 18 distributions to shareholders dividends and repurchases
Fm11 ch 18 distributions to shareholders dividends and repurchasesFm11 ch 18 distributions to shareholders dividends and repurchases
Fm11 ch 18 distributions to shareholders dividends and repurchasesNhu Tuyet Tran
 
Fm11 ch 19 initial public offerings, investment banking, and financial restru...
Fm11 ch 19 initial public offerings, investment banking, and financial restru...Fm11 ch 19 initial public offerings, investment banking, and financial restru...
Fm11 ch 19 initial public offerings, investment banking, and financial restru...Nhu Tuyet Tran
 
Fm11 ch 16 capital structure decisions the basics
Fm11 ch 16 capital structure decisions  the basicsFm11 ch 16 capital structure decisions  the basics
Fm11 ch 16 capital structure decisions the basicsNhu Tuyet Tran
 
Fm11 ch 17 capital structure decisions extensions
Fm11 ch 17 capital structure decisions extensionsFm11 ch 17 capital structure decisions extensions
Fm11 ch 17 capital structure decisions extensionsNhu Tuyet Tran
 
Fm11 ch 14 financial planning and forecasting pro forma financial statements
Fm11 ch 14 financial planning and forecasting pro forma financial statementsFm11 ch 14 financial planning and forecasting pro forma financial statements
Fm11 ch 14 financial planning and forecasting pro forma financial statementsNhu Tuyet Tran
 

More from Nhu Tuyet Tran (20)

Chuong 5
Chuong 5Chuong 5
Chuong 5
 
Bai hoan chinh
Bai hoan chinhBai hoan chinh
Bai hoan chinh
 
đồ áN nghiệp vụ ngân hàng 1
đồ áN nghiệp vụ ngân hàng 1đồ áN nghiệp vụ ngân hàng 1
đồ áN nghiệp vụ ngân hàng 1
 
Thực trạng đô la hoá ở việt nam
Thực trạng đô la hoá ở việt namThực trạng đô la hoá ở việt nam
Thực trạng đô la hoá ở việt nam
 
Fm11 ch 30 financial management in not for-profit businesses
Fm11 ch 30 financial management in not for-profit businessesFm11 ch 30 financial management in not for-profit businesses
Fm11 ch 30 financial management in not for-profit businesses
 
Fm11 ch 29 pension plan management
Fm11 ch 29 pension plan managementFm11 ch 29 pension plan management
Fm11 ch 29 pension plan management
 
Fm11 ch 28 advanced issues in cash management and inventory control
Fm11 ch 28 advanced issues in cash management and inventory controlFm11 ch 28 advanced issues in cash management and inventory control
Fm11 ch 28 advanced issues in cash management and inventory control
 
Fm11 ch 24 bankruptcy, reorganization, and liquidation
Fm11 ch 24 bankruptcy, reorganization, and liquidationFm11 ch 24 bankruptcy, reorganization, and liquidation
Fm11 ch 24 bankruptcy, reorganization, and liquidation
 
Fm11 ch 27 banking relationships
Fm11 ch 27 banking relationshipsFm11 ch 27 banking relationships
Fm11 ch 27 banking relationships
 
Fm11 ch 26 multinational financial management
Fm11 ch 26 multinational financial managementFm11 ch 26 multinational financial management
Fm11 ch 26 multinational financial management
 
Fm11 ch 25 mergers, lb os, divestitures, and holding companies
Fm11 ch 25 mergers, lb os, divestitures, and holding companiesFm11 ch 25 mergers, lb os, divestitures, and holding companies
Fm11 ch 25 mergers, lb os, divestitures, and holding companies
 
Fm11 ch 23 derivatives and risk management
Fm11 ch 23 derivatives and risk managementFm11 ch 23 derivatives and risk management
Fm11 ch 23 derivatives and risk management
 
Fm11 ch 22 working capital management
Fm11 ch 22 working capital managementFm11 ch 22 working capital management
Fm11 ch 22 working capital management
 
Fm11 ch 20 lease financing
Fm11 ch 20 lease financingFm11 ch 20 lease financing
Fm11 ch 20 lease financing
 
Fm11 ch 21 hybrid financing preferred stock,warrants, and convertibles
Fm11 ch 21 hybrid financing preferred stock,warrants, and convertiblesFm11 ch 21 hybrid financing preferred stock,warrants, and convertibles
Fm11 ch 21 hybrid financing preferred stock,warrants, and convertibles
 
Fm11 ch 18 distributions to shareholders dividends and repurchases
Fm11 ch 18 distributions to shareholders dividends and repurchasesFm11 ch 18 distributions to shareholders dividends and repurchases
Fm11 ch 18 distributions to shareholders dividends and repurchases
 
Fm11 ch 19 initial public offerings, investment banking, and financial restru...
Fm11 ch 19 initial public offerings, investment banking, and financial restru...Fm11 ch 19 initial public offerings, investment banking, and financial restru...
Fm11 ch 19 initial public offerings, investment banking, and financial restru...
 
Fm11 ch 16 capital structure decisions the basics
Fm11 ch 16 capital structure decisions  the basicsFm11 ch 16 capital structure decisions  the basics
Fm11 ch 16 capital structure decisions the basics
 
Fm11 ch 17 capital structure decisions extensions
Fm11 ch 17 capital structure decisions extensionsFm11 ch 17 capital structure decisions extensions
Fm11 ch 17 capital structure decisions extensions
 
Fm11 ch 14 financial planning and forecasting pro forma financial statements
Fm11 ch 14 financial planning and forecasting pro forma financial statementsFm11 ch 14 financial planning and forecasting pro forma financial statements
Fm11 ch 14 financial planning and forecasting pro forma financial statements
 

Fm11 ch 04 risk and return the basics

  • 1. 4 - 1 CHAPTER 4 Risk and Return: The Basics Basic return concepts Basic risk concepts Stand-alone risk Portfolio (market) risk Risk and return: CAPM/SML
  • 2. 4 - 2 What are investment returns? Investment returns measure the financial results of an investment. Returns may be historical or prospective (anticipated). Returns can be expressed in: Dollar terms. Percentage terms.
  • 3. 4 - 3 What is the return on an investment that costs $1,000 and is sold after 1 year for $1,100? Dollar return: Percentage return: $ Received - $ Invested $1,100 - $1,000 = $100. $ Return/$ Invested $100/$1,000 = 0.10 = 10%.
  • 4. 4 - 4 What is investment risk? Typically, investment returns are not known with certainty. Investment risk pertains to the probability of earning a return less than that expected. The greater the chance of a return far below the expected return, the greater the risk.
  • 5. 4 - 5 Probability distribution Rate of return (%)50150-20 Stock X Stock Y  Which stock is riskier? Why?
  • 6. 4 - 6 Assume the Following Investment Alternatives Economy Prob. T-Bill Alta Repo Am F. MP Recession 0.10 8.0% -22.0% 28.0% 10.0% -13.0% Below avg. 0.20 8.0 -2.0 14.7 -10.0 1.0 Average 0.40 8.0 20.0 0.0 7.0 15.0 Above avg. 0.20 8.0 35.0 -10.0 45.0 29.0 Boom 0.10 8.0 50.0 -20.0 30.0 43.0 1.00
  • 7. 4 - 7 What is unique about the T-bill return? The T-bill will return 8% regardless of the state of the economy. Is the T-bill riskless? Explain.
  • 8. 4 - 8 Do the returns of Alta Inds. and Repo Men move with or counter to the economy?  Alta Inds. moves with the economy, so it is positively correlated with the economy. This is the typical situation.  Repo Men moves counter to the economy. Such negative correlation is unusual.
  • 9. 4 - 9 Calculate the expected rate of return on each alternative. .∑ ∧ n 1=i iiPr=r r = expected rate of return. rAlta = 0.10(-22%) + 0.20(-2%) + 0.40(20%) + 0.20(35%) + 0.10(50%) = 17.4%. ^ ^
  • 10. 4 - 10  Alta has the highest rate of return.  Does that make it best? r Alta 17.4% Market 15.0 Am. Foam 13.8 T-bill 8.0 Repo Men 1.7 ^
  • 11. 4 - 11 What is the standard deviation of returns for each alternative? . Variance deviationStandard 1 2 2 ∑= ∧       −= == = n i ii Prr σσ σ
  • 12. 4 - 12 σT-bills = 0.0%. σAlta = 20.0%. σRepo = 13.4%. σAm Foam = 18.8%. σMarket = 15.3%. . 1 2 ∑= ∧       −= n i ii Prrσ Alta Inds: σ = ((-22 - 17.4)2 0.10 + (-2 - 17.4)2 0.20 + (20 - 17.4)2 0.40 + (35 - 17.4)2 0.20 + (50 - 17.4)2 0.10)1/2 = 20.0%.
  • 13. 4 - 13 Prob. Rate of Return (%) T-bill Am. F. Alta 0 8 13.8 17.4
  • 14. 4 - 14 Standard deviation measures the stand-alone risk of an investment. The larger the standard deviation, the higher the probability that returns will be far below the expected return. Coefficient of variation is an alternative measure of stand-alone risk.
  • 15. 4 - 15 Expected Return versus Risk Expected Security return Risk, σ Alta Inds. 17.4% 20.0% Market 15.0 15.3 Am. Foam 13.8 18.8 T-bills 8.0 0.0 Repo Men 1.7 13.4
  • 16. 4 - 16 Coefficient of Variation: CV = Standard deviation/Expected return. CVT-BILLS = 0.0%/8.0% = 0.0. CVAlta Inds = 20.0%/17.4% = 1.1. CVRepo Men = 13.4%/1.7% = 7.9. CVAm. Foam = 18.8%/13.8% = 1.4. CVM = 15.3%/15.0% = 1.0.
  • 17. 4 - 17 Expected Return versus Coefficient of Variation Expecte d Risk: Risk : Security return σ CV Alta Inds 17.4% 20.0% 1.1 Market 15.0 15.3 1.0 Am. Foam 13.8 18.8 1.4 T-bills 8.0 0.0 0.0 Repo Men 1.7 13.4 7.9
  • 18. 4 - 18 T-bills Coll. Mkt USR Alta 0.0% 2.0% 4.0% 6.0% 8.0% 10.0% 12.0% 14.0% 16.0% 18.0% 20.0% 0.0% 5.0% 10.0% 15.0% 20.0% 25.0% Risk (Std. Dev.) Return Return vs. Risk (Std. Dev.): Which investment is best?
  • 19. 4 - 19 Portfolio Risk and Return Assume a two-stock portfolio with $50,000 in Alta Inds. and $50,000 in Repo Men. Calculate rp and σp.^
  • 20. 4 - 20 Portfolio Return, rp rp is a weighted average: rp = 0.5(17.4%) + 0.5(1.7%) = 9.6%. rp is between rAlta and rRepo. ^ ^ ^ ^ ^ ^ ^ ^ rp = Σ wiri. n i = 1
  • 21. 4 - 21 Alternative Method rp = (3.0%)0.10 + (6.4%)0.20 + (10.0%)0.40 + (12.5%)0.20 + (15.0%)0.10 = 9.6%. ^ Estimated Return (More...) Economy Prob. Alta Repo Port. Recession 0.10 -22.0% 28.0% 3.0% Below avg. 0.20 -2.0 14.7 6.4 Average 0.40 20.0 0.0 10.0 Above avg. 0.20 35.0 -10.0 12.5 Boom 0.10 50.0 -20.0 15.0
  • 22. 4 - 22 σp = ((3.0 - 9.6)2 0.10 + (6.4 - 9.6)2 0.20 + (10.0 - 9.6)2 0.40 + (12.5 - 9.6)2 0.20 + (15.0 - 9.6)2 0.10)1/2 = 3.3%. σp is much lower than: either stock (20% and 13.4%). average of Alta and Repo (16.7%). The portfolio provides average return but much lower risk. The key here is negative correlation.
  • 23. 4 - 23 Two-Stock Portfolios Two stocks can be combined to form a riskless portfolio if ρ = -1.0. Risk is not reduced at all if the two stocks have ρ = +1.0. In general, stocks have ρ ≈ 0.65, so risk is lowered but not eliminated. Investors typically hold many stocks. What happens when ρ = 0?
  • 24. 4 - 24 What would happen to the risk of an average 1-stock portfolio as more randomly selected stocks were added? σp would decrease because the added stocks would not be perfectly correlated, but rp would remain relatively constant. ^
  • 25. 4 - 25 Large 0 15 Prob. 2 1 σ1 ≈ 35% ; σLarge ≈ 20%. Return
  • 26. 4 - 26 # Stocks in Portfolio 10 20 30 40 2,000+ Company Specific (Diversifiable) Risk Market Risk 20 0 Stand-Alone Risk, σp σp (%) 35
  • 27. 4 - 27 Stand-alone Market Diversifiable Market risk is that part of a security’s stand-alone risk that cannot be eliminated by diversification. Firm-specific, or diversifiable, risk is that part of a security’s stand-alone risk that can be eliminated by diversification. risk risk risk= + .
  • 28. 4 - 28 Conclusions As more stocks are added, each new stock has a smaller risk-reducing impact on the portfolio. σp falls very slowly after about 40 stocks are included. The lower limit for σp is about 20% = σM . By forming well-diversified portfolios, investors can eliminate about half the riskiness of owning a single stock.
  • 29. 4 - 29 No. Rational investors will minimize risk by holding portfolios. They bear only market risk, so prices and returns reflect this lower risk. The one-stock investor bears higher (stand-alone) risk, so the return is less than that required by the risk. Can an investor holding one stock earn a return commensurate with its risk?
  • 30. 4 - 30 Market risk, which is relevant for stocks held in well-diversified portfolios, is defined as the contribution of a security to the overall riskiness of the portfolio. It is measured by a stock’s beta coefficient. For stock i, its beta is: bi = (ρiM σi) / σM How is market risk measured for individual securities?
  • 31. 4 - 31 How are betas calculated? In addition to measuring a stock’s contribution of risk to a portfolio, beta also which measures the stock’s volatility relative to the market.
  • 32. 4 - 32 Using a Regression to Estimate Beta Run a regression with returns on the stock in question plotted on the Y axis and returns on the market portfolio plotted on the X axis. The slope of the regression line, which measures relative volatility, is defined as the stock’s beta coefficient, or b.
  • 33. 4 - 33 Use the historical stock returns to calculate the beta for PQU. Year Market PQU 1 25.7% 40.0% 2 8.0% -15.0% 3 -11.0% -15.0% 4 15.0% 35.0% 5 32.5% 10.0% 6 13.7% 30.0% 7 40.0% 42.0% 8 10.0% -10.0% 9 -10.8% -25.0% 10 -13.1% 25.0%
  • 34. 4 - 34 Calculating Beta for PQU r PQU = 0.83r M + 0.03 R 2 = 0.36 -40% -20% 0% 20% 40% -40% -20% 0% 20% 40% r M r KWE
  • 35. 4 - 35 What is beta for PQU? The regression line, and hence beta, can be found using a calculator with a regression function or a spreadsheet program. In this example, b = 0.83.
  • 36. 4 - 36 Calculating Beta in Practice Many analysts use the S&P 500 to find the market return. Analysts typically use four or five years’ of monthly returns to establish the regression line.  Some analysts use 52 weeks of weekly returns.
  • 37. 4 - 37 If b = 1.0, stock has average risk. If b > 1.0, stock is riskier than average. If b < 1.0, stock is less risky than average. Most stocks have betas in the range of 0.5 to 1.5. Can a stock have a negative beta? How is beta interpreted?
  • 38. 4 - 38 Finding Beta Estimates on the Web Go to www.thomsonfn.com. Enter the ticker symbol for a “Stock Quote”, such as IBM or Dell, then click GO. When the quote comes up, select Company Earnings, then GO.
  • 39. 4 - 39 Expected Return versus Market Risk  Which of the alternatives is best? Expected Security return Risk, b Alta 17.4% 1.29 Market 15.0 1.00 Am. Foam 13.8 0.68 T-bills 8.0 0.00 Repo Men 1.7 -0.86
  • 40. 4 - 40 Use the SML to calculate each alternative’s required return. The Security Market Line (SML) is part of the Capital Asset Pricing Model (CAPM). SML: ri = rRF + (RPM)bi . Assume rRF = 8%; rM = rM = 15%. RPM = (rM - rRF) = 15% - 8% = 7%. ^
  • 41. 4 - 41 Required Rates of Return rAlta = 8.0% + (7%)(1.29) = 8.0% + 9.0% = 17.0%. rM = 8.0% + (7%)(1.00) = 15.0%. rAm. F. = 8.0% + (7%)(0.68) = 12.8%. rT-bill = 8.0% + (7%)(0.00) = 8.0%. rRepo = 8.0% + (7%)(-0.86) = 2.0%.
  • 42. 4 - 42 Expected versus Required Returns ^r r Alta 17.4% 17.0% Undervalued Market 15.0 15.0 Fairly valued Am. F. 13.8 12.8 Undervalued T-bills 8.0 8.0 Fairly valued Repo 1.7 2.0 Overvalued
  • 43. 4 - 43 . .Repo .Alta T-bills . Am. Foam rM = 15 rRF = 8 -1 0 1 2 . SML: ri = rRF + (RPM) bi ri = 8%+ (7%) bi ri (%) Risk, bi SML and Investment Alternatives Market
  • 44. 4 - 44 Calculate beta for a portfolio with 50% Alta and 50% Repo bp = Weighted average = 0.5(bAlta) + 0.5(bRepo) = 0.5(1.29) + 0.5(-0.86) = 0.22.
  • 45. 4 - 45 What is the required rate of return on the Alta/Repo portfolio? rp = Weighted average r = 0.5(17%) + 0.5(2%) = 9.5%. Or use SML: rp = rRF + (RPM) bp = 8.0% + 7%(0.22) = 9.5%.
  • 46. 4 - 46 SML1 Original situation Required Rate of Return r (%) SML2 0 0.5 1.0 1.5 2.0 18 15 11 8 New SML ∆ I = 3% Impact of Inflation Change on SML
  • 47. 4 - 47 rM = 18% rM = 15% SML1 Original situation Required Rate of Return (%) SML2 After increase in risk aversion Risk, bi 18 15 8 1.0 ∆ RPM = 3% Impact of Risk Aversion Change
  • 48. 4 - 48 Has the CAPM been completely confirmed or refuted through empirical tests? No. The statistical tests have problems that make empirical verification or rejection virtually impossible. Investors’ required returns are based on future risk, but betas are calculated with historical data. Investors may be concerned about both stand-alone and market risk.