Download as PDF, PPTX


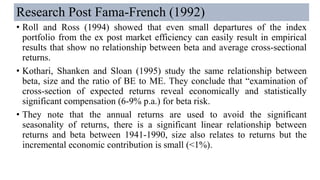
![Fama & French (1992) [cont..]
• In this Panel the portfolios are sorted on the basis of Betas.
• The relationship between monthly returns and Betas is tenuous.](https://image.slidesharecdn.com/multi-factormodelsinassetpricing-171002183702/85/Multi-factor-models-in-asset-pricing-6-320.jpg)
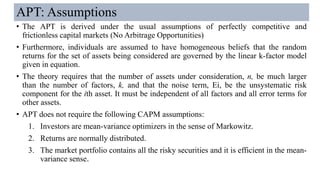
![Fama & French (1992) [cont..]
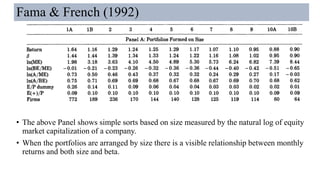
• Fama and French ran a two-pass sort to attempt to separate the effect of beta from size.
We can see the relationship between return and company size in the above table.
• If we read across the rows we can see relationship between returns and betas, keeping
size constant.
• For the small and large equity rows, the relationship between beta and return goes in the
wrong direction and it is not very strong in the remaining rows.](https://image.slidesharecdn.com/multi-factormodelsinassetpricing-171002183702/85/Multi-factor-models-in-asset-pricing-7-320.jpg)
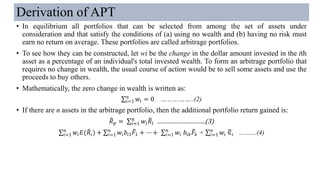
![Fama & French (1992) [cont..]
• Fama and French ran multiple regressions with the individual stock returns
as dependent variables.
• Beta was not statistically significant related to the average monthly returns
of individual securities, either by itself or when combined with the size in
multiple regression.
• The strongest model did not include the beta at all.
• It explained return as a negative function of size( Log ME) and positive
function of the log of ratio of book to the market value of equity (BE/ME).
• However, when they exclude the NASDAQ stocks and extend their data
back to period 1941-1990, then beta is significant and positively related to
returns both for portfolios and for individual stocks.](https://image.slidesharecdn.com/multi-factormodelsinassetpricing-171002183702/85/Multi-factor-models-in-asset-pricing-8-320.jpg)
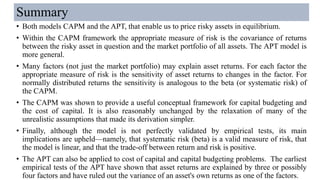
![Fama and French (1996): The Three Factor Model
• Fama and French (1996) update their work and present a three-factor model that, when
fit to data for NYSE, AMEX and NASDAQ stock returns for 366 months from July
1963- December 1993, provides best explanation of excess returns.
• The model can be expressed as:
E(𝑅𝑖 ) − 𝑅 𝑓 = 𝑎𝑖 + 𝑏𝑖 [𝐸(𝑅 𝑀) − 𝑅 𝑓 ] + 𝑠𝑖 𝐸[𝑆𝑀𝐵] + ℎ𝑖 𝐸[𝐻𝑀𝐿]
• E(𝑅𝑖) is the expected return on asset i. 𝐸(𝑅 𝑀) is the expected return on the value-weight
market portfolio. 𝑅 𝑓 is the risk-free interest rate of 1-month Treasury bills. The
coefficients 𝑏𝑖 , 𝑠𝑖 and ℎ𝑖 are the βs of the stock on each of the three factors.
• The model says that the excess returns of the ith security over risk free rate is a linear
function of three factors:
1. The excess of the market portfolio over the risk-free rate
2. The difference between the returns on a portfolio of small stocks and the large stocks,
SMB; and
3. The difference between the returns on a portfolio of high and low book-to market
stock, HML.](https://image.slidesharecdn.com/multi-factormodelsinassetpricing-171002183702/85/Multi-factor-models-in-asset-pricing-10-320.jpg)
![The Arbitrage Pricing Theory: Ross [1976]
• Formulated by Ross [1976], the arbitrage pricing theory (APT) offers a testable
alternative to the capital asset pricing model. The CAPM predicts that security rates of
return will be linearly related to a single common factor—the rate of return on the
market portfolio. The APT is based on similar intuition but is much more general.
• It assumes that the rate of return on any security is a linear function of k factors as
shown below:
• ෩𝑹𝒊 = 𝑬(෩𝑹𝒊) + 𝒃𝒊𝟏
෩𝑭 𝟏+. . . +𝒃𝒊𝒌
෩𝑭 𝒌 +∈𝒊 (i = 1, . . . , n) ….. (1)
෩𝑹𝒊 = random rate of return on the ith asset
𝑬(෩𝑹𝒊)= expected return on the ith asset
෩𝑭 𝒌 = kth factor common to the returns of all assets under consideration with a mean of zero, common
factors that in essence capture the systematic component of risk in the model
𝒃𝒊𝒌 = a coefficient called a factor loading that quantifies the sensitivity of asset i’s returns to the
movements in the common factor (and is analogous to the beta in the CAPM)
∈𝒊 = an error term, or unsystematic risk component, idiosyncratic to the ith asset, with mean zero (a
random zero mean noise term for the ith asset)
• The CAPM may be viewed as a special case of the APT when the market rate of return
is assumed to be the single relevant factor.](https://image.slidesharecdn.com/multi-factormodelsinassetpricing-171002183702/85/Multi-factor-models-in-asset-pricing-11-320.jpg)
![Derivation of APT [Cont..]
• To obtain a riskless arbitrage portfolio it is necessary to eliminate both diversifiable (i.e.,
unsystematic or idiosyncratic) and undiversifiable (i.e., systematic) risk.
• This can be done by meeting three conditions: (1) selecting percentage changes in
investment ratios, wi, that are small, (2) diversifying across a large number of assets, and
(3) choosing changes, wi, so that for each factor, k, the weighted sum of the systematic
risk components, bk, is zero. Mathematically, these conditions are:
𝑤𝑖 ≈
1
𝑛
, …. (5)
n chosen to be a large number, ….(6)
σ 𝑤𝑖 𝑏𝑖𝑘 = 0 for each factor….(7)
• Because the error terms, 𝜀𝑖, are independent the law of large numbers guarantees that a
weighted average of many of them will approach zero in the limit as n becomes large.
• In other words, costless diversification eliminates the last term (the unsystematic or
idiosyncratic risk) in Eq (1). Thus, we are left with:
෨𝑅 𝑝 = σ𝑖=1
𝑛
𝑤𝑖 𝐸( ෨𝑅𝑖) + σ𝑖=1
𝑛
𝑤𝑖 𝑏𝑖1
෨𝐹1 + ⋯ + σ𝑖=1
𝑛
𝑤𝑖 𝑏𝑖𝑘
෨𝐹𝑘 … (8)](https://image.slidesharecdn.com/multi-factormodelsinassetpricing-171002183702/85/Multi-factor-models-in-asset-pricing-14-320.jpg)
![Derivation of APT [Cont..]
• At first glance the return on our portfolio appears to be a random variable, but we have
chosen the weighted average of the systematic risk components for each factor to be
equal to zero (σ 𝑤𝑖 𝑏𝑖𝑘 = 0 ).
• This eliminates all systematic risk. One might say that we have selected an arbitrage
portfolio with zero beta in each factor. Consequently, the return on our arbitrage
portfolio becomes a constant. Correct choice of the weights has eliminated all
uncertainty, so that Rp is not a random variable.
• Therefore Eq. 4 becomes: 𝑅 𝑝= σ 𝑤𝑖 𝐸 ( ෨𝑅𝑖) …….. (9)
• Recall that the arbitrage portfolio, so constructed, has no risk (of any kind) and requires
no new wealth. If the return on the arbitrage portfolio were not zero, then it would be
possible to achieve an infinite rate of return with no capital requirements and no risk.
Such an opportunity is clearly impossible if the market is to be in equilibrium. In fact, if
the individual arbitrageur is in equilibrium (hence content with his or her current
portfolio), then the return on any and all arbitrage portfolios must be zero. In other
words,
𝑅 𝑝= σ 𝑤𝑖 𝐸 ( ෨𝑅𝑖) = 0 …….. (10)](https://image.slidesharecdn.com/multi-factormodelsinassetpricing-171002183702/85/Multi-factor-models-in-asset-pricing-15-320.jpg)
![Derivation of APT [Cont..]
• Eqs. (2), (7) and (10) are really statements in linear algebra. Any vector that is
orthogonal to the constant vector*, i.e.,
σ𝑖=1
𝑛
𝑤𝑖 . 𝒆 = 0
and to each of the coefficient vectors, i.e.,
σ 𝑤𝑖 𝑏𝑖𝑘 = 0 for each k
must also be orthogonal to the vector of expected returns, i.e.,
σ𝑖=1
𝑛
𝑤𝑖 𝐸( ෨𝑅)𝑖 = 0
[*Note that Eq. (2) says that the sum of the investment weights equals zero. This is really
a no-wealth constraint. No new wealth is required to take an arbitrage position. Recall that
e is a column vector of ones.]](https://image.slidesharecdn.com/multi-factormodelsinassetpricing-171002183702/85/Multi-factor-models-in-asset-pricing-16-320.jpg)
![Derivation of APT [Cont..]
• An algebraic consequence of this statement is that the expected return vector must be a
linear combination of the constant vector and the coefficient vectors. Algebraically, there
must exist a set of k + 1 coefficients, 𝜆0, 𝜆1, 𝜆2,…. 𝜆 𝑘 such that
𝐸( ෨𝑅)𝑖 = 𝜆0 + 𝜆1 𝑏𝑖1+……+ 𝜆 𝑘 𝑏𝑖𝑘 ……………..(11)
• Recall that the 𝑏𝑖𝑘 are the "sensitivities" of the returns on the ith security to the kth
factor.
• If there is a riskless asset with a riskless rate of return, Rf , then 𝑏0𝑘 = 0 and Rf = 𝜆0
• Hence Eq. (11) can be rewritten in "excess returns form" as
E (𝑅𝑖) - 𝑅 𝑓 = 𝜆1 𝑏𝑖1+……+ 𝜆 𝑘 𝑏𝑖𝑘 ……………..(12)](https://image.slidesharecdn.com/multi-factormodelsinassetpricing-171002183702/85/Multi-factor-models-in-asset-pricing-17-320.jpg)
![The Arbitrage Pricing Line
• This figure illustrates the arbitrage pricing
relationship (12) assuming that there is only a single
stochastic factor, k.
• In equilibrium, all assets must fall on the arbitrage
pricing line. A natural interpretation for 𝜆 𝑘 is that it
represents the risk premium (i.e., the price of risk), in
equilibrium, for the kth factor.
• Because the arbitrage pricing relationship is linear we
can use the slope-intercept definition of a straight line
to rewrite Eq. (12) as:
• E (𝑅𝑖) = 𝑅𝑓 + [ ҧ𝛿 𝑘 − 𝑅𝑓 ] 𝑏𝑖𝑘 , where ҧ𝛿 𝑘 is the
expected return on a portfolio with unit sensitivity to
the kth factor and zero sensitivity to all other factors.
• Therefore the risk premium, 𝜆 𝑘 , is equal to the difference between (1) the expectation of a portfolio that has
unit response to the kth factor and zero response to the other factors and (2) the risk-free rate, 𝑅 𝑓 :
𝜆 𝑘 = ҧ𝛿 𝑘 − 𝑅 𝑓
• In general the arbitrage pricing theory can be rewritten as:
E (𝑅𝑖) - 𝑅 𝑓 = [ ҧ𝛿1 − 𝑅 𝑓 ] 𝑏𝑖1 + ….. + [ ҧ𝛿 𝑘 − 𝑅 𝑓 ] 𝑏𝑖𝑘 … (13)](https://image.slidesharecdn.com/multi-factormodelsinassetpricing-171002183702/85/Multi-factor-models-in-asset-pricing-18-320.jpg)
![Superiority of APT over CAPM
1. The APT makes no assumptions about the empirical distribution of asset
returns.
2. The APT makes no strong assumptions about individuals' utility functions (at
least nothing stronger than greed and risk aversion).
3. The APT allows the equilibrium returns of assets to be dependent on many
factors, not just one (e.g., beta).
4. The APT yields a statement about the relative pricing of any subset of assets;
hence one need not measure the entire universe of assets in order to test the
theory.
5. There is no special role for the market portfolio in the APT, whereas the CAPM
requires that the market portfolio be efficient.
6. The APT is easily extended to a multiperiod framework (Ross [1976]).](https://image.slidesharecdn.com/multi-factormodelsinassetpricing-171002183702/85/Multi-factor-models-in-asset-pricing-19-320.jpg)

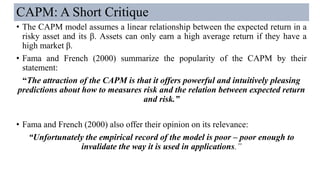
This document summarizes critiques of the Capital Asset Pricing Model (CAPM) and presents alternative models. It discusses empirical studies from the 1980s and 1990s that found variables other than beta help explain stock returns, contradicting CAPM. Fama and French's 1992 study found firm size and book-to-market ratio better predict returns than beta. Their three-factor model and the Arbitrage Pricing Theory were proposed as alternatives to CAPM. Overall, the document outlines major empirical challenges to CAPM and influential models that improved on its ability to explain stock returns.


