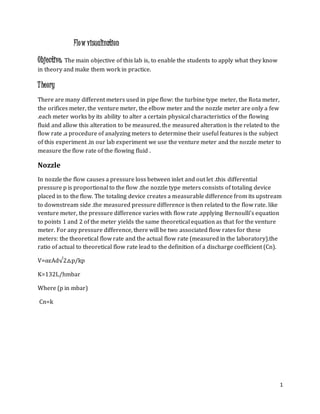
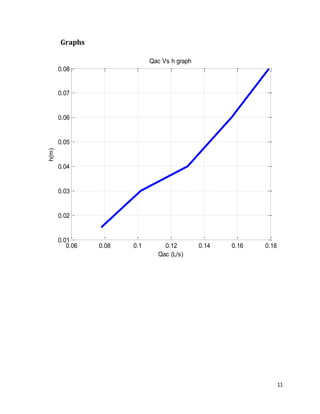
1
Flow visualization
Objective: The main objective of this lab is, to enable the students to apply what they know
in theory and make them work in practice.
Theory
There are many different meters used in pipe flow: the turbine type meter, the Rota meter,
the orifices meter, the venture meter, the elbow meter and the nozzle meter are only a few
.each meter works by its ability to alter a certain physical characteristics of the flowing
fluid and allow this alteration to be measured. the measured alteration is the related to the
flow rate .a procedure of analyzing meters to determine their useful features is the subject
of this experiment .in our lab experiment we use the venture meter and the nozzle meter to
measure the flow rate of the flowing fluid .
Nozzle
In nozzle the flow causes a pressure loss between inlet and out let .this differential
pressure p is proportional to the flow .the nozzle type meters consists of totaling device
placed in to the flow. The totaling device creates a measurable difference from its upstream
to downstream side .the measured pressure difference is then related to the flow rate. like
venture meter, the pressure difference varies with flow rate .applying Bernoulli’s equation
to points 1 and 2 of the meter yields the same theoretical equation as that for the venture
meter. For any pressure difference, there will be two associated flow rates for these
meters: the theoretical flow rate and the actual flow rate (measured in the laboratory).the
ratio of actual to theoretical flow rate lead to the definition of a discharge coefficient (Cn).
V=αεAd√2⧍p/kp
K=132L/hmbar
Where (p in mbar)
Cn=k
2
The venture meter
A fluid passing through smoothly varying constrictions experience changes in velocity and
pressure. These changes can be used to measure the flow rate of the fluid.
To calculate the flow rate of a fluid passing through a venture, enter the parameters below. (The
default calculation involves air passing through a medium-sized venture, with answers rounded
to 3 significant figures.)
3
It contains a constriction known as the throat. when fluid flow through the
constriction ,it must experience an increase in velocity over the upstream value .the
velocity increase is accompanied by a decrease in static pressure at the throat .the
difference between upstream and throat static pressure is then measured and
relabeled to the flow rate .the greater the flow rate ,the greater the pressure drop
p.so the pressure difference( h=p/g) can be found as a function of the flow rate flow
rate obtained with equation above .for any h,it is possible to define a coefficient of
discharge CV as
Cv=QAC/QTH
For each and every measured actual flow rate through the venture meter, it is possible to
calculate a theoretical volume flow rate, Reynolds number, and a discharge coefficient .the
Reynolds number is given by
Re=V2D2/
4
Where V2=the velocity at the throat of the meter
V2=QAC/A2
Using the hydrostatic equation applied to the air over liquid manometer, the pressure drop
and the head loss are related by:
(P1-p2)/ g=h
by combining the continuity equation,
Q=A1V1=A2V2
Where V=QTH
With Bernoulli equation
P1/ +v12/2= P2/+ v22/2
And substituting hydrostatic equation .it can be shown after simplification that the volume
flow rate through the venture meter is given by
QTH=A2gh/(1-(D24/D14))
The preceding equation represents the theoretical volume flow rate through the
venture meter. Notice that it was derived in the Bernoulli equation which does not
take frictional effect in to account .in the venture meter, there exists small pressure
loss due to viscous effects. thus for any pressure difference ,the actual flow rate will
be somewhat less than the theoretical value .the pressure in the venture is inversely
proportional to the velocity in the venture according to Bernoulli’s law equation .two
tapping’s allow measurement of the inlet pressure and the pressure are the smallest
area. this differential pressure
V=αεAd√2⧍p/kp
K=132L/hmbar
5
Material/apparatusused
Material Facilities
U tube manometer Electric power
Venture meter
Nozzle meter
water
Stop watch
Volume meter
paper
pen
Datafornozzle
h1(mm) h2(mm) h(mm) Volume(L) Time(se) Volume
flow
rate(L/s)
340 260 80 5 28 0.179
310 250 60 5 32 0.1563
280 240 40 5 38.5 0.130
260 230 30 5 49.24 0.102
235 220 15 5 1.07min 0.078
Dataforventure
h1(mm) h2(mm) h(mm) Volume(L) Time(se) Volume
flow
rate(L/s)
285 10 275 5 28 0.179
280 60 220 5 32 0.1563
280 110 170 5 38.5 0.130
275 145 130 5 49.24 0.102
275 180 95 5 1.07min 0.078
6
Calculation& graphsfor venturemeter
From the diagram:
A1=333.8mm2
A2=84.6mm2
• From tis we can calculate D1&D2
• A1=D12*/4
4A1/=D12
D1=20.616mm
• A2=D22*/4
4A2/=D22
D2=10.4mm
Calculate:
Qact,QthRe,V2,V,h
1, Actual flow rates (Qact) =volume/time
Volume(L) Time(se) Volume
flow
rate(L/s)
5 28 0.179
5 32 0.1563
5 38.5 0.130
5 49.24 0.102
5 1.07min 0.078
7
2, Re= V2D2/
Where
Re=Reynaldo number
=kinematic viscosity of the water
3, calculate V2(the velocity at the throat of the meter)
V2=Qact/A2
A2(mm2) Qact(L/s) V2(m/s) (mm2/s) @
250C
D2(mm) Re
84.6 0.179 2.16 0.8926 10.4 25166.93
84.6 0.1563 1.848 0.8926 10.4 21531.705
84.6 0.130 1.537 0.8926 10.4 17908.13
84.6 0.102 1.206 0.8926 10.4 14051.535
84.6 0.078 0.922 0.8926 10.4 10400.0
4 calculate p:
(P1-P2)/g=h
h1(mm) h2(mm) h(mm) g(m/s2) (kg/m3) p(mbar)
285 10 275 10 997 26.9
280 60 220 10 997 21.52
280 110 170 10 997 16.62
275 145 130 10 997 12.715
275 180 95 10 997 9.3
5 calculate Qth:
Qth =A2gh/(1-(D24/D14))=132L/hr*p
A2(mm2) g(m/s2) h(m) D24(mm4) D14(mm4) 1-
D24/D14
Qth(L/s)
84.6 10 0.275 11698.586 180641.54 0.93524 0.1902
84.6 10 0.22 11698.586 180641.54 0.93524 0.1701
84.6 10 0.17 11698.586 180641.54 0.93524 0.1495
84.6 10 0.13 11698.586 180641.54 0.93524 0.13075
84.6 10 0.095 11698.586 180641.54 0.93524 0.112
8
6 calculate Cv: Cv= Qact/ Qth
Qact(L/s) Qth(L/s) Cv
0.179 0.1902 0.941
0.1563 0.1701 0.92
0.130 0.1495 0.87
0.102 0.13075 0.7801
0.078 0.112 0.69643
Graphs
0.1 0.11 0.12 0.13 0.14 0.15 0.16 0.17 0.18 0.19 0.2
0.08
0.1
0.12
0.14
0.16
0.18
0.2
0.22
0.24
0.26
0.28
Qth(L/s)
h(m)
Qth Vs h graph
9
0.06 0.08 0.1 0.12 0.14 0.16 0.18
0.08
0.1
0.12
0.14
0.16
0.18
0.2
0.22
0.24
0.26
0.28
Qac(L/s)
h(m)
Qac Vs graph
Calculation& graphsfor nozzle
1, Actual flow rates (Qact) =volume/time
Volume(L) Time(se) Volume
flow
rate(L/s)
5 28 0.179
5 32 0.1563
5 38.5 0.130
5 49.24 0.102
5 1.07min 0.078
10
2, calculate h:
(P1-P2)/g=h
h1(mm) h2(mm) h(mm) g(m/s2) (kg/m3) p(mbar)
340 260 80 10 997 7.824
310 250 60 10 997 5.87
280 240 40 10 997 3.912
260 230 30 10 997 2.934
235 220 15 10 997 1.47
3, calculate Qth:
Qth=kp
K=231L/hr
h1(mm) h2(mm) h(mm) Qth(L/s)
340 260 80 0.1795
310 250 60 0.1555
280 240 40 0.127
260 230 30 0.11
235 220 15 0.078
4, calculate Cn: Cn= Qact/ Qth
Qact(L/s) Qth(L/s) Cn
0.179 0.1795 0.9972
0.1563 0.1555 1.005
0.130 0.127 1.02362
0.102 0.11 0.93
0.078 0.0777 1.004
11
Graphs
0.06 0.08 0.1 0.12 0.14 0.16 0.18
0.01
0.02
0.03
0.04
0.05
0.06
0.07
0.08
Qac (L/s)
h(m)
Qac Vs h graph
12
0.06 0.08 0.1 0.12 0.14 0.16 0.18
0.01
0.02
0.03
0.04
0.05
0.06
0.07
0.08
Qth(L/s)
h(m)
Qth Vs h graph
Conclusion& discussion
In our first lab work on venture, we observe that, fluid's velocity must increase as it passes
through a constriction in accord with the principle of continuity, while its static pressure
must decrease in accord with the principle of conservation of mechanical energy. Thus any
gain in kinetic energy a fluid may accrue due to its increased velocity through a constriction
is balanced by a drop in pressure. This is reversed in nozzle meter, since the area of the
nozzle meter increases gradually, as fluid flow through it.
An equation for the drop in pressure due to the Venture effect may be derived from a
combination of Bernoulli's principle and the continuity equation.
13
In our lab work, we observe that as the area of the meter decrease, the velocity of the fluid
which passes through the meter increases. This in turn increases the pressure drop (the
difference of pressure between the inlet and throat of the venture meter).
The theoretical volume flow rate is greater than the actual one; this is because when we
apply the Bernoulli equation, we did not consider the frictional loss inside the meter.
As both the actual and the theoretical flow rate decrease the coefficient of discharge also
decrease in venture meter. But in nozzle meter, generally, the coefficient of discharge
increases.

Flow visualization

  • 1.
    1 Flow visualization Objective: Themain objective of this lab is, to enable the students to apply what they know in theory and make them work in practice. Theory There are many different meters used in pipe flow: the turbine type meter, the Rota meter, the orifices meter, the venture meter, the elbow meter and the nozzle meter are only a few .each meter works by its ability to alter a certain physical characteristics of the flowing fluid and allow this alteration to be measured. the measured alteration is the related to the flow rate .a procedure of analyzing meters to determine their useful features is the subject of this experiment .in our lab experiment we use the venture meter and the nozzle meter to measure the flow rate of the flowing fluid . Nozzle In nozzle the flow causes a pressure loss between inlet and out let .this differential pressure p is proportional to the flow .the nozzle type meters consists of totaling device placed in to the flow. The totaling device creates a measurable difference from its upstream to downstream side .the measured pressure difference is then related to the flow rate. like venture meter, the pressure difference varies with flow rate .applying Bernoulli’s equation to points 1 and 2 of the meter yields the same theoretical equation as that for the venture meter. For any pressure difference, there will be two associated flow rates for these meters: the theoretical flow rate and the actual flow rate (measured in the laboratory).the ratio of actual to theoretical flow rate lead to the definition of a discharge coefficient (Cn). V=αεAd√2⧍p/kp K=132L/hmbar Where (p in mbar) Cn=k
  • 2.
    2 The venture meter Afluid passing through smoothly varying constrictions experience changes in velocity and pressure. These changes can be used to measure the flow rate of the fluid. To calculate the flow rate of a fluid passing through a venture, enter the parameters below. (The default calculation involves air passing through a medium-sized venture, with answers rounded to 3 significant figures.)
  • 3.
    3 It contains aconstriction known as the throat. when fluid flow through the constriction ,it must experience an increase in velocity over the upstream value .the velocity increase is accompanied by a decrease in static pressure at the throat .the difference between upstream and throat static pressure is then measured and relabeled to the flow rate .the greater the flow rate ,the greater the pressure drop p.so the pressure difference( h=p/g) can be found as a function of the flow rate flow rate obtained with equation above .for any h,it is possible to define a coefficient of discharge CV as Cv=QAC/QTH For each and every measured actual flow rate through the venture meter, it is possible to calculate a theoretical volume flow rate, Reynolds number, and a discharge coefficient .the Reynolds number is given by Re=V2D2/
  • 4.
    4 Where V2=the velocityat the throat of the meter V2=QAC/A2 Using the hydrostatic equation applied to the air over liquid manometer, the pressure drop and the head loss are related by: (P1-p2)/ g=h by combining the continuity equation, Q=A1V1=A2V2 Where V=QTH With Bernoulli equation P1/ +v12/2= P2/+ v22/2 And substituting hydrostatic equation .it can be shown after simplification that the volume flow rate through the venture meter is given by QTH=A2gh/(1-(D24/D14)) The preceding equation represents the theoretical volume flow rate through the venture meter. Notice that it was derived in the Bernoulli equation which does not take frictional effect in to account .in the venture meter, there exists small pressure loss due to viscous effects. thus for any pressure difference ,the actual flow rate will be somewhat less than the theoretical value .the pressure in the venture is inversely proportional to the velocity in the venture according to Bernoulli’s law equation .two tapping’s allow measurement of the inlet pressure and the pressure are the smallest area. this differential pressure V=αεAd√2⧍p/kp K=132L/hmbar
  • 5.
    5 Material/apparatusused Material Facilities U tubemanometer Electric power Venture meter Nozzle meter water Stop watch Volume meter paper pen Datafornozzle h1(mm) h2(mm) h(mm) Volume(L) Time(se) Volume flow rate(L/s) 340 260 80 5 28 0.179 310 250 60 5 32 0.1563 280 240 40 5 38.5 0.130 260 230 30 5 49.24 0.102 235 220 15 5 1.07min 0.078 Dataforventure h1(mm) h2(mm) h(mm) Volume(L) Time(se) Volume flow rate(L/s) 285 10 275 5 28 0.179 280 60 220 5 32 0.1563 280 110 170 5 38.5 0.130 275 145 130 5 49.24 0.102 275 180 95 5 1.07min 0.078
  • 6.
    6 Calculation& graphsfor venturemeter Fromthe diagram: A1=333.8mm2 A2=84.6mm2 • From tis we can calculate D1&D2 • A1=D12*/4 4A1/=D12 D1=20.616mm • A2=D22*/4 4A2/=D22 D2=10.4mm Calculate: Qact,QthRe,V2,V,h 1, Actual flow rates (Qact) =volume/time Volume(L) Time(se) Volume flow rate(L/s) 5 28 0.179 5 32 0.1563 5 38.5 0.130 5 49.24 0.102 5 1.07min 0.078
  • 7.
    7 2, Re= V2D2/ Where Re=Reynaldonumber =kinematic viscosity of the water 3, calculate V2(the velocity at the throat of the meter) V2=Qact/A2 A2(mm2) Qact(L/s) V2(m/s) (mm2/s) @ 250C D2(mm) Re 84.6 0.179 2.16 0.8926 10.4 25166.93 84.6 0.1563 1.848 0.8926 10.4 21531.705 84.6 0.130 1.537 0.8926 10.4 17908.13 84.6 0.102 1.206 0.8926 10.4 14051.535 84.6 0.078 0.922 0.8926 10.4 10400.0 4 calculate p: (P1-P2)/g=h h1(mm) h2(mm) h(mm) g(m/s2) (kg/m3) p(mbar) 285 10 275 10 997 26.9 280 60 220 10 997 21.52 280 110 170 10 997 16.62 275 145 130 10 997 12.715 275 180 95 10 997 9.3 5 calculate Qth: Qth =A2gh/(1-(D24/D14))=132L/hr*p A2(mm2) g(m/s2) h(m) D24(mm4) D14(mm4) 1- D24/D14 Qth(L/s) 84.6 10 0.275 11698.586 180641.54 0.93524 0.1902 84.6 10 0.22 11698.586 180641.54 0.93524 0.1701 84.6 10 0.17 11698.586 180641.54 0.93524 0.1495 84.6 10 0.13 11698.586 180641.54 0.93524 0.13075 84.6 10 0.095 11698.586 180641.54 0.93524 0.112
  • 8.
    8 6 calculate Cv:Cv= Qact/ Qth Qact(L/s) Qth(L/s) Cv 0.179 0.1902 0.941 0.1563 0.1701 0.92 0.130 0.1495 0.87 0.102 0.13075 0.7801 0.078 0.112 0.69643 Graphs 0.1 0.11 0.12 0.13 0.14 0.15 0.16 0.17 0.18 0.19 0.2 0.08 0.1 0.12 0.14 0.16 0.18 0.2 0.22 0.24 0.26 0.28 Qth(L/s) h(m) Qth Vs h graph
  • 9.
    9 0.06 0.08 0.10.12 0.14 0.16 0.18 0.08 0.1 0.12 0.14 0.16 0.18 0.2 0.22 0.24 0.26 0.28 Qac(L/s) h(m) Qac Vs graph Calculation& graphsfor nozzle 1, Actual flow rates (Qact) =volume/time Volume(L) Time(se) Volume flow rate(L/s) 5 28 0.179 5 32 0.1563 5 38.5 0.130 5 49.24 0.102 5 1.07min 0.078
  • 10.
    10 2, calculate h: (P1-P2)/g=h h1(mm)h2(mm) h(mm) g(m/s2) (kg/m3) p(mbar) 340 260 80 10 997 7.824 310 250 60 10 997 5.87 280 240 40 10 997 3.912 260 230 30 10 997 2.934 235 220 15 10 997 1.47 3, calculate Qth: Qth=kp K=231L/hr h1(mm) h2(mm) h(mm) Qth(L/s) 340 260 80 0.1795 310 250 60 0.1555 280 240 40 0.127 260 230 30 0.11 235 220 15 0.078 4, calculate Cn: Cn= Qact/ Qth Qact(L/s) Qth(L/s) Cn 0.179 0.1795 0.9972 0.1563 0.1555 1.005 0.130 0.127 1.02362 0.102 0.11 0.93 0.078 0.0777 1.004
  • 11.
    11 Graphs 0.06 0.08 0.10.12 0.14 0.16 0.18 0.01 0.02 0.03 0.04 0.05 0.06 0.07 0.08 Qac (L/s) h(m) Qac Vs h graph
  • 12.
    12 0.06 0.08 0.10.12 0.14 0.16 0.18 0.01 0.02 0.03 0.04 0.05 0.06 0.07 0.08 Qth(L/s) h(m) Qth Vs h graph Conclusion& discussion In our first lab work on venture, we observe that, fluid's velocity must increase as it passes through a constriction in accord with the principle of continuity, while its static pressure must decrease in accord with the principle of conservation of mechanical energy. Thus any gain in kinetic energy a fluid may accrue due to its increased velocity through a constriction is balanced by a drop in pressure. This is reversed in nozzle meter, since the area of the nozzle meter increases gradually, as fluid flow through it. An equation for the drop in pressure due to the Venture effect may be derived from a combination of Bernoulli's principle and the continuity equation.
  • 13.
    13 In our labwork, we observe that as the area of the meter decrease, the velocity of the fluid which passes through the meter increases. This in turn increases the pressure drop (the difference of pressure between the inlet and throat of the venture meter). The theoretical volume flow rate is greater than the actual one; this is because when we apply the Bernoulli equation, we did not consider the frictional loss inside the meter. As both the actual and the theoretical flow rate decrease the coefficient of discharge also decrease in venture meter. But in nozzle meter, generally, the coefficient of discharge increases.