Downloaded 157 times

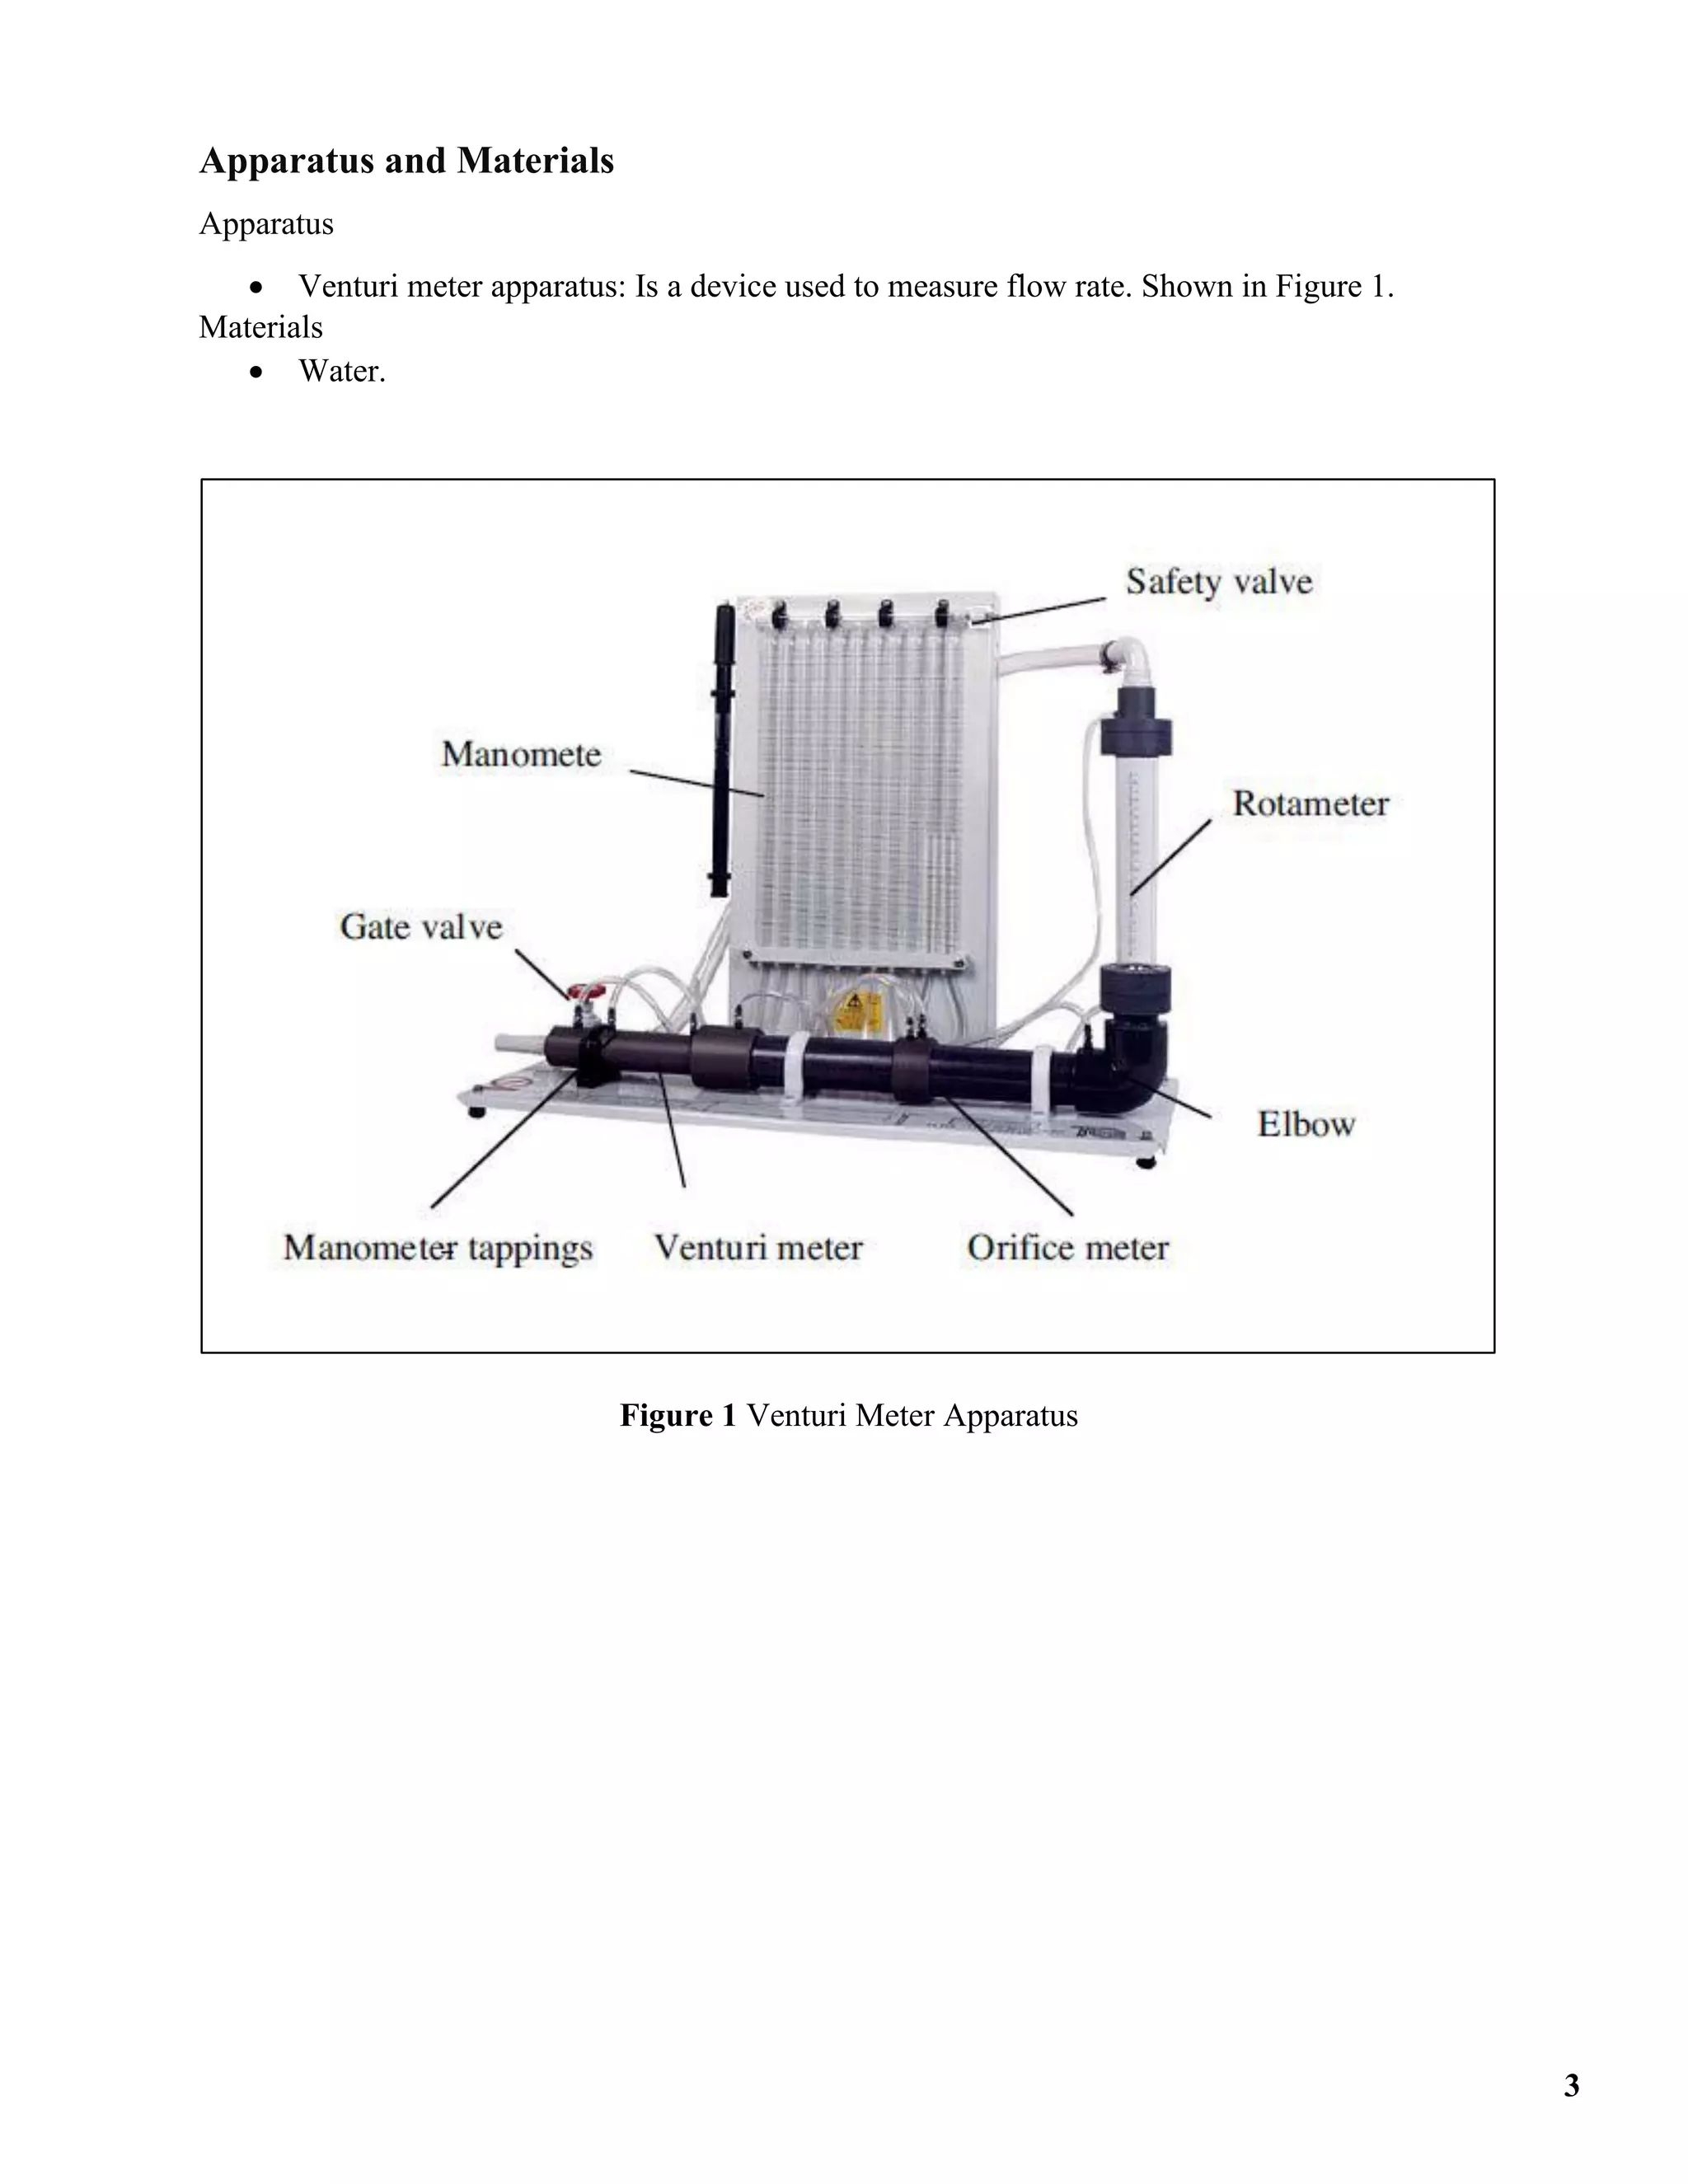

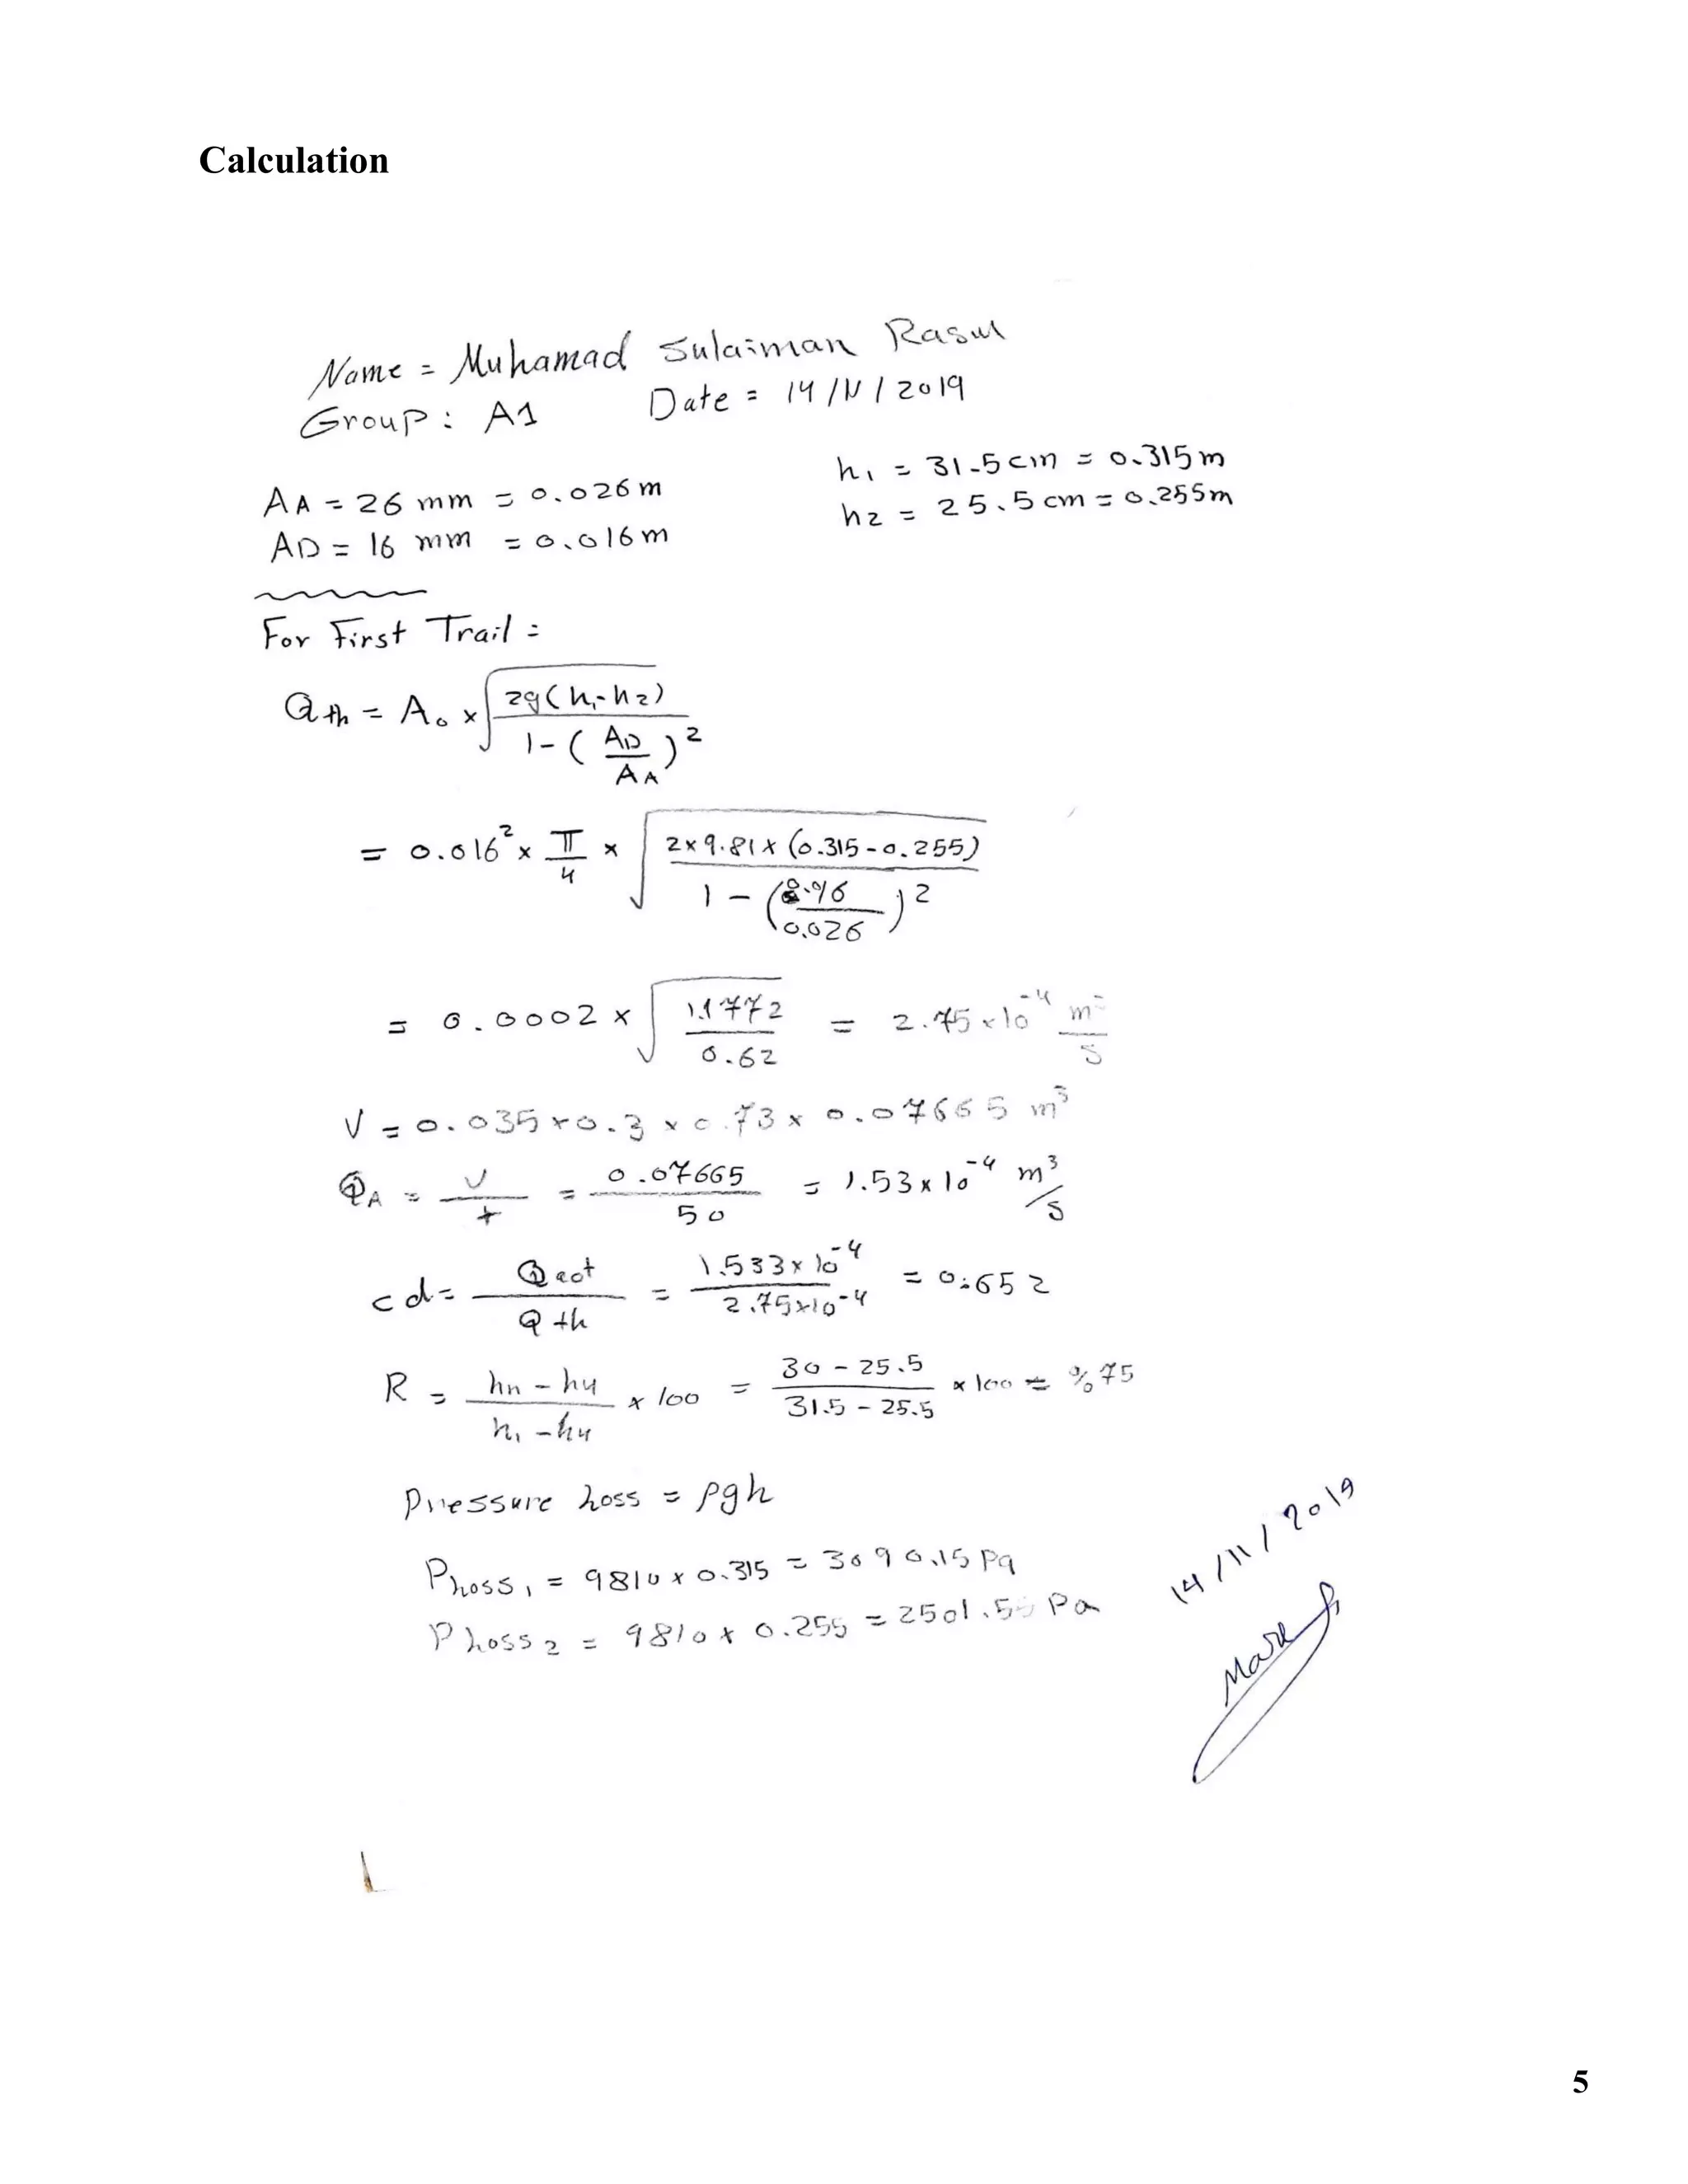
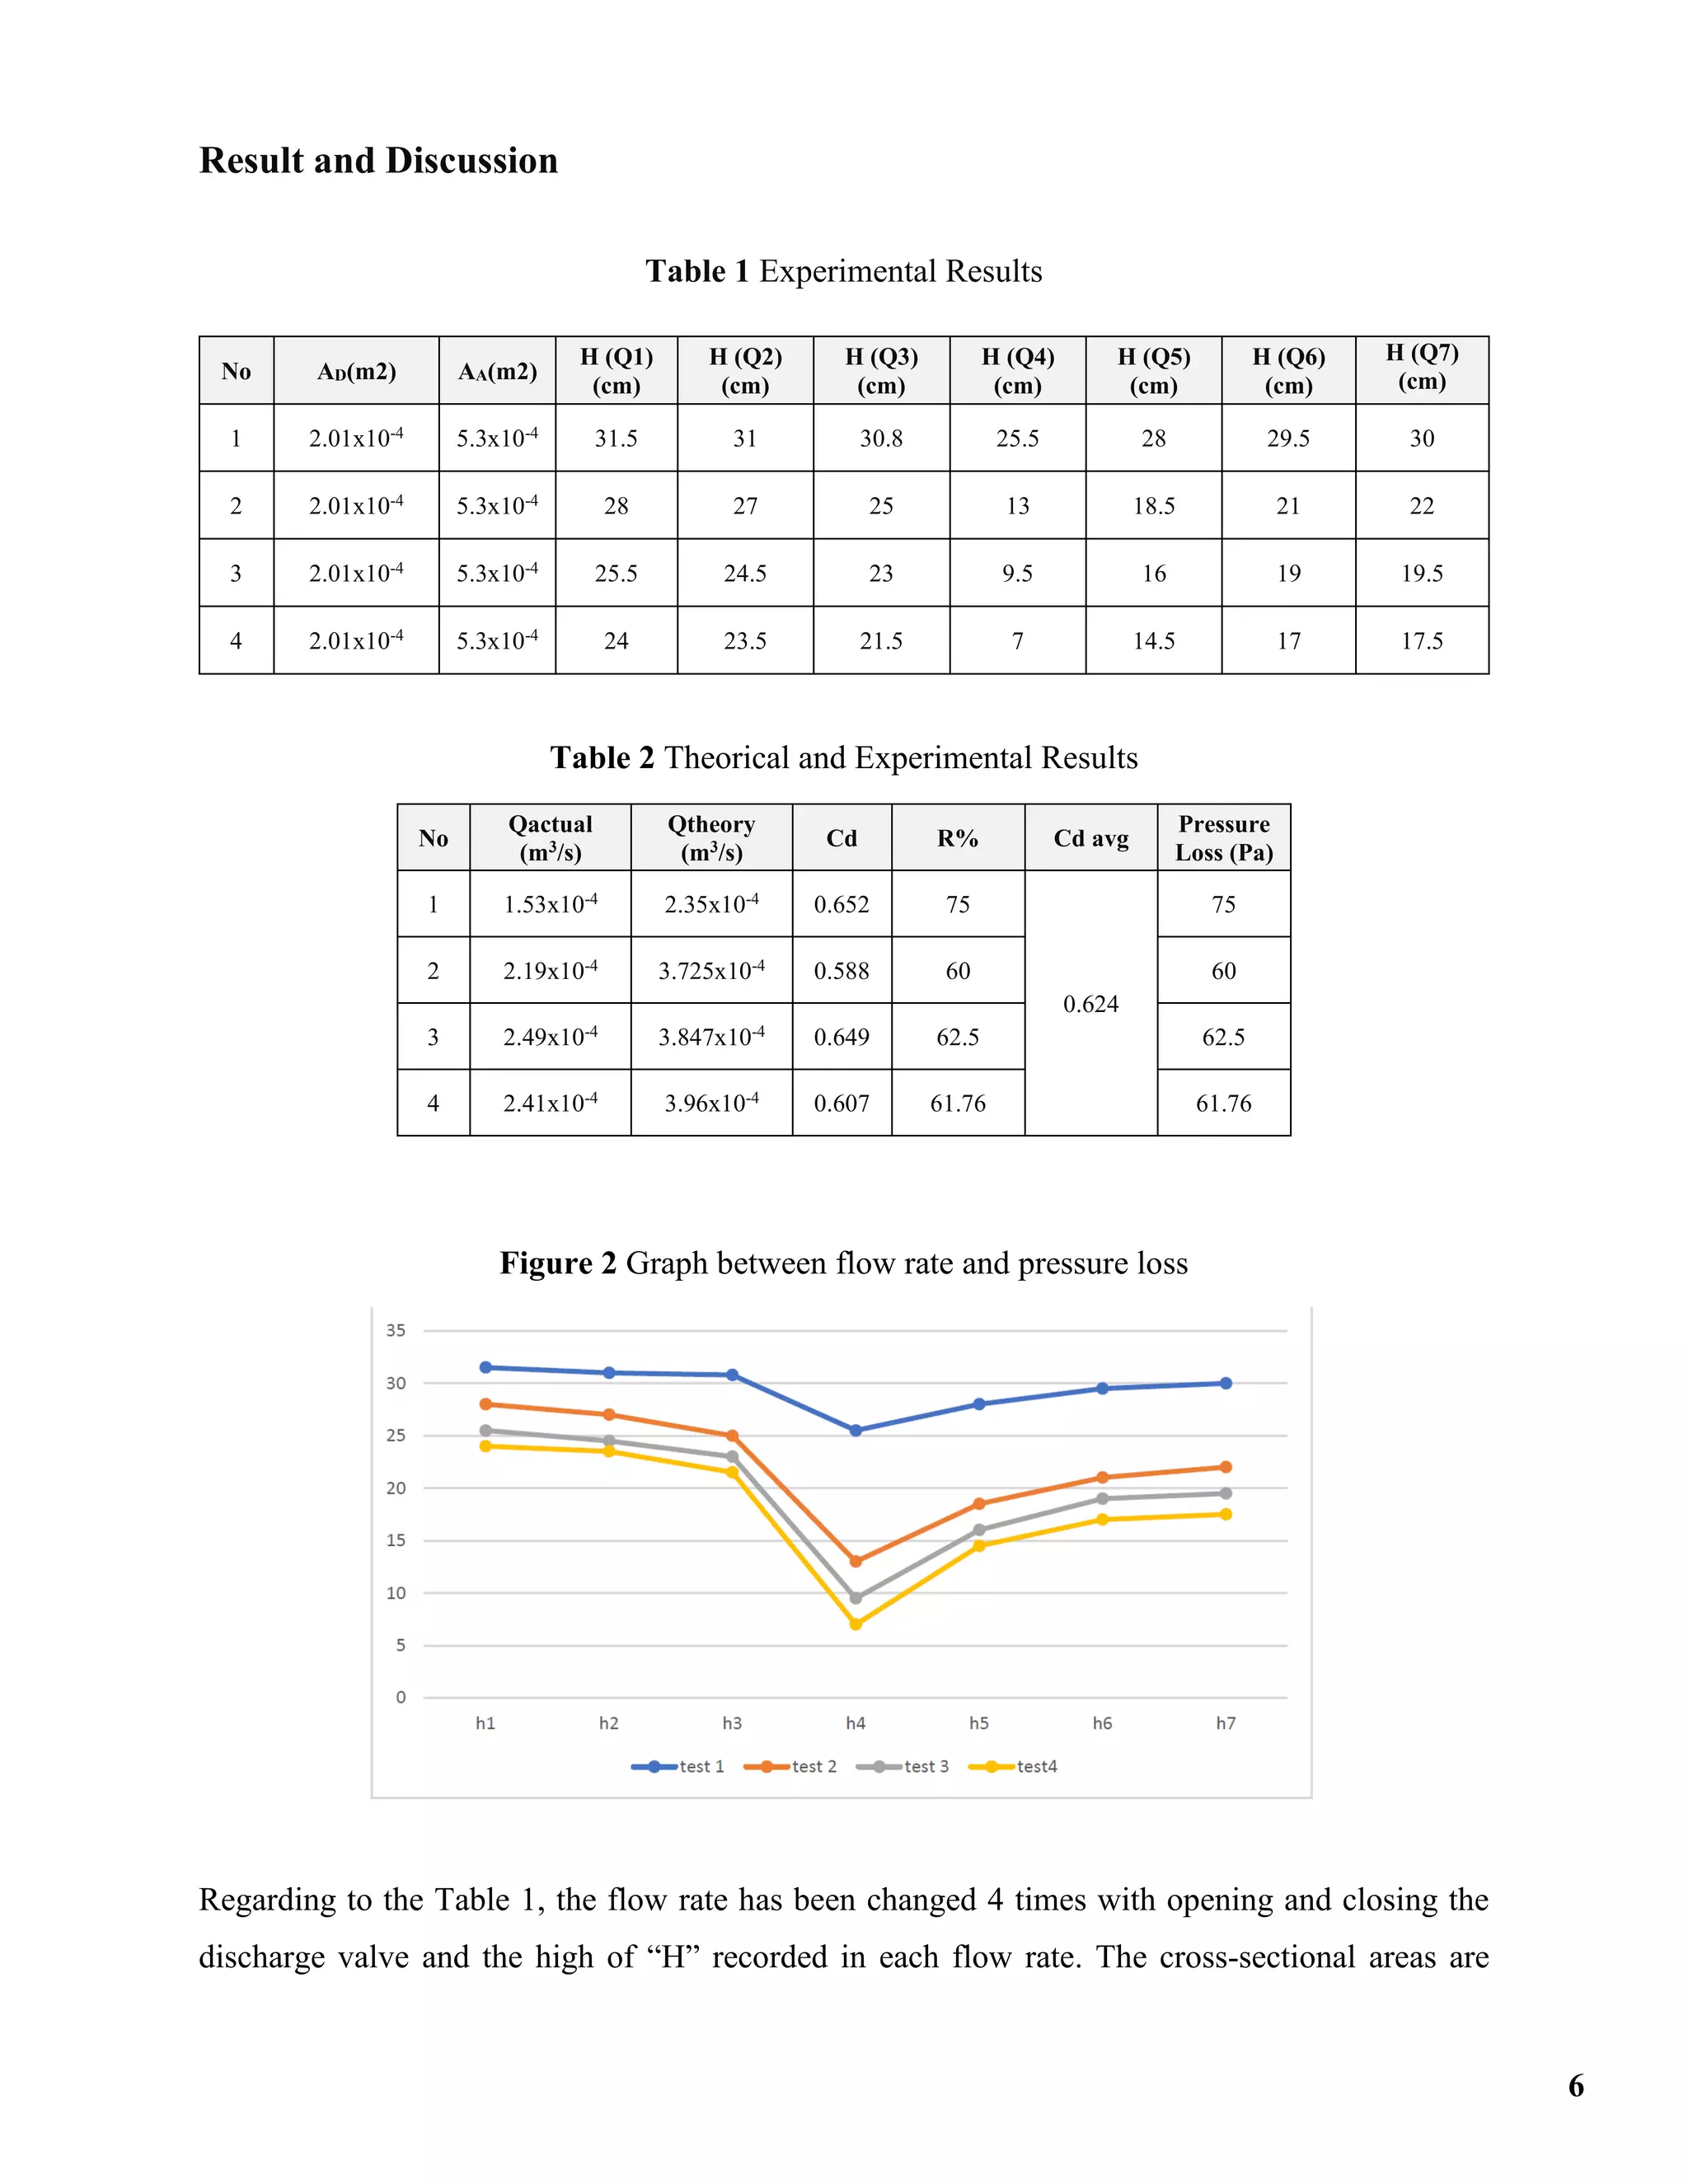


The document outlines an experiment conducted at Soran University to measure flow rates using a Venturi meter, detailing the apparatus, procedure, and calculations for both compressible and incompressible fluids. It includes theoretical and experimental results, discussing pressure drops and flow rate differences observed during the experiment, along with the average discharge coefficient. The conclusion emphasizes the Venturi meter's effectiveness in determining flow rates and managing fluid discharge in various industrial applications.


