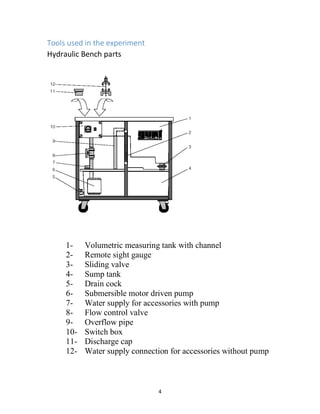
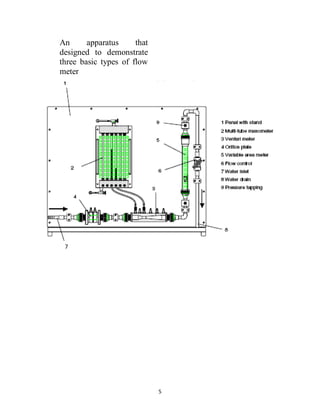
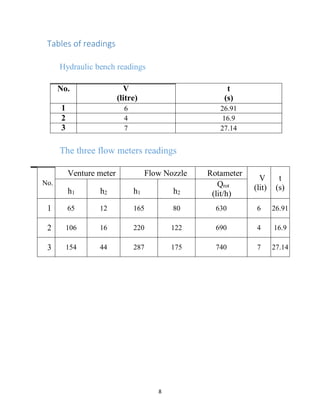
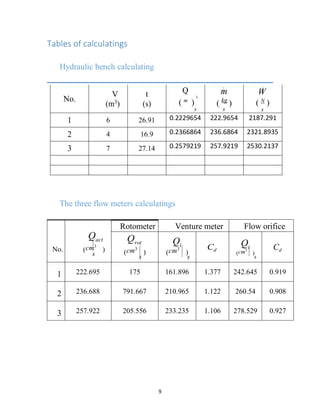
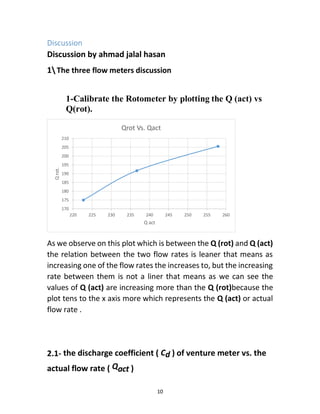
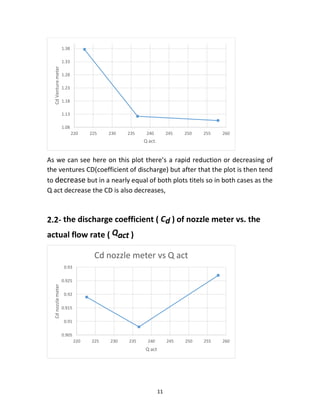
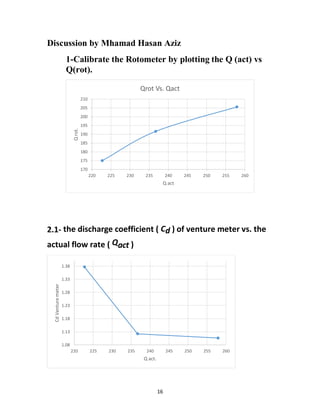
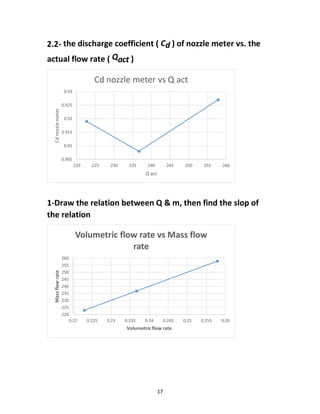
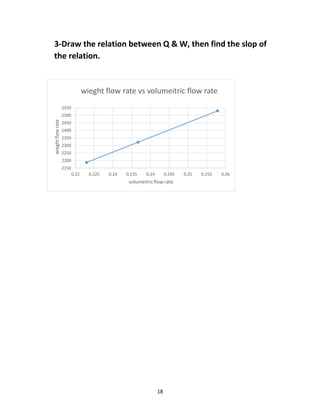
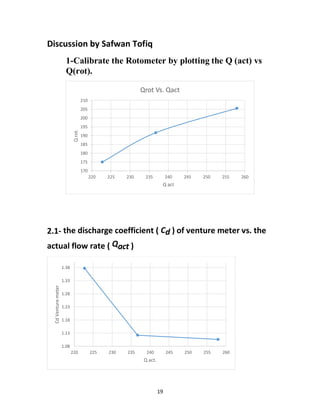
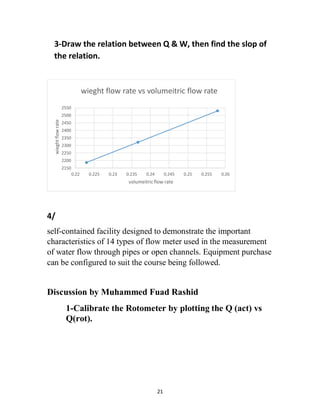
This document describes an experiment conducted to demonstrate and measure fluid flow rates using different flow meter types. The experiment utilized a hydraulic bench unit with a volumetric measuring tank and submersible pump. Three common flow meters were tested: a rotameter, venture meter, and orifice plate. Readings were taken from each meter and calculations were performed to determine flow rates and discharge coefficients. Plots were made comparing actual flow rates to measured rates from each meter. The results showed the relationships between variables and effectiveness of different flow meter designs.
The aim of the fluid flow rate experiment is to measure the fluid flow rate using a device called the hydraulic bench unit, which is also used to prove the Bernoulli’s Theorem Demonstration by measuring the overall pressure of the fluid flow.
this document contains a list of experiments which is performed in the fluid mechanics laboratory.As this in not a professional document there might be some mistakes in the observations or plots, the writer and the publisher is a student of civil engineering at UET Peshawar.
SAIF ALDIN ALI MADIN
سيف الدين علي ماضي
S96aif@gmail.com
1. Studying the performance of this type of centrifugal pump
2. Calculating the theoretical efficiency of centrifugal pump and
compare with experimental efficiency of centrifugal pump
this is the experiment of fluid mechanics .FLOW OVER A SHARP CRESTED WEIR.experiment of weir.from this experiment we can learn discharge over the sharp crested weir and etc.
PLEASE NOTE THIS IS PART-1
By Referring or said Learning This Presentation You Can Clear Your Basics Fundamental Doubts about Fluid Mechanics. In this Presentation You Will Learn about Fluid Pressure, Pressure at Point, Pascal's Law, Types Of Pressure and Pressure Measurements.
,friction pipe ,friction loss along a pipe ,pipe ,along a ,loss along ,loss along a ,friction loss ,friction loss along a ,loss along a pipe ,along a pipe ,friction loss alon ,friction loss along a p ,loss along a pip
1. The background of Fluid Mechanics
2. Fields of Fluid mechanics
3. Introduction and Basic concepts
4. Properties of Fluids
5. Pressure and fluid statics
6. Hydrodynamics
Energy losses in Bends, loss coefficient related to velocity head.Pelton Whee...Salman Jailani
In this slide you learn the how to make the lablayout and the study the Energy losses, Pelton Wheel. Kaplan TURBINE, Franices TURBine And its Efficiency of Mecahanical Power Plants..
00923006902338
This is a preliminary text for the chapter. The Oslo Group is invited to provide comments on the
general structure and coverage of the chapter (for example, if it covers the relevant aspects related to
measurement units and conversion factors, and if there are additional topics that should be covered in
this chapter), and on the recommendations to be contained in IRES.
The current text presents the recommendations from the UN Manual F.29 as well as some points that
were raised during the last OG meeting. The issue of “harmonization” of standard/default conversion
factors still needs to be addressed. It was suggested that tables be moved to an annex. Please provide
your views on which ones should be retained in the chapter.
Vaccine management system project report documentation..pdfKamal Acharya
The Division of Vaccine and Immunization is facing increasing difficulty monitoring vaccines and other commodities distribution once they have been distributed from the national stores. With the introduction of new vaccines, more challenges have been anticipated with this additions posing serious threat to the already over strained vaccine supply chain system in Kenya.
Sachpazis:Terzaghi Bearing Capacity Estimation in simple terms with Calculati...Dr.Costas Sachpazis
Terzaghi's soil bearing capacity theory, developed by Karl Terzaghi, is a fundamental principle in geotechnical engineering used to determine the bearing capacity of shallow foundations. This theory provides a method to calculate the ultimate bearing capacity of soil, which is the maximum load per unit area that the soil can support without undergoing shear failure. The Calculation HTML Code included.
Welcome to WIPAC Monthly the magazine brought to you by the LinkedIn Group Water Industry Process Automation & Control.
In this month's edition, along with this month's industry news to celebrate the 13 years since the group was created we have articles including
A case study of the used of Advanced Process Control at the Wastewater Treatment works at Lleida in Spain
A look back on an article on smart wastewater networks in order to see how the industry has measured up in the interim around the adoption of Digital Transformation in the Water Industry.
Water scarcity is the lack of fresh water resources to meet the standard water demand. There are two type of water scarcity. One is physical. The other is economic water scarcity.
Industrial Training at Shahjalal Fertilizer Company Limited (SFCL)MdTanvirMahtab2
This presentation is about the working procedure of Shahjalal Fertilizer Company Limited (SFCL). A Govt. owned Company of Bangladesh Chemical Industries Corporation under Ministry of Industries.
Courier management system project report.pdfKamal Acharya
It is now-a-days very important for the people to send or receive articles like imported furniture, electronic items, gifts, business goods and the like. People depend vastly on different transport systems which mostly use the manual way of receiving and delivering the articles. There is no way to track the articles till they are received and there is no way to let the customer know what happened in transit, once he booked some articles. In such a situation, we need a system which completely computerizes the cargo activities including time to time tracking of the articles sent. This need is fulfilled by Courier Management System software which is online software for the cargo management people that enables them to receive the goods from a source and send them to a required destination and track their status from time to time.
Explore the innovative world of trenchless pipe repair with our comprehensive guide, "The Benefits and Techniques of Trenchless Pipe Repair." This document delves into the modern methods of repairing underground pipes without the need for extensive excavation, highlighting the numerous advantages and the latest techniques used in the industry.
Learn about the cost savings, reduced environmental impact, and minimal disruption associated with trenchless technology. Discover detailed explanations of popular techniques such as pipe bursting, cured-in-place pipe (CIPP) lining, and directional drilling. Understand how these methods can be applied to various types of infrastructure, from residential plumbing to large-scale municipal systems.
Ideal for homeowners, contractors, engineers, and anyone interested in modern plumbing solutions, this guide provides valuable insights into why trenchless pipe repair is becoming the preferred choice for pipe rehabilitation. Stay informed about the latest advancements and best practices in the field.
Automobile Management System Project Report.pdfKamal Acharya
The proposed project is developed to manage the automobile in the automobile dealer company. The main module in this project is login, automobile management, customer management, sales, complaints and reports. The first module is the login. The automobile showroom owner should login to the project for usage. The username and password are verified and if it is correct, next form opens. If the username and password are not correct, it shows the error message.
When a customer search for a automobile, if the automobile is available, they will be taken to a page that shows the details of the automobile including automobile name, automobile ID, quantity, price etc. “Automobile Management System” is useful for maintaining automobiles, customers effectively and hence helps for establishing good relation between customer and automobile organization. It contains various customized modules for effectively maintaining automobiles and stock information accurately and safely.
When the automobile is sold to the customer, stock will be reduced automatically. When a new purchase is made, stock will be increased automatically. While selecting automobiles for sale, the proposed software will automatically check for total number of available stock of that particular item, if the total stock of that particular item is less than 5, software will notify the user to purchase the particular item.
Also when the user tries to sale items which are not in stock, the system will prompt the user that the stock is not enough. Customers of this system can search for a automobile; can purchase a automobile easily by selecting fast. On the other hand the stock of automobiles can be maintained perfectly by the automobile shop manager overcoming the drawbacks of existing system.
Immunizing Image Classifiers Against Localized Adversary Attacksgerogepatton
This paper addresses the vulnerability of deep learning models, particularly convolutional neural networks
(CNN)s, to adversarial attacks and presents a proactive training technique designed to counter them. We
introduce a novel volumization algorithm, which transforms 2D images into 3D volumetric representations.
When combined with 3D convolution and deep curriculum learning optimization (CLO), itsignificantly improves
the immunity of models against localized universal attacks by up to 40%. We evaluate our proposed approach
using contemporary CNN architectures and the modified Canadian Institute for Advanced Research (CIFAR-10
and CIFAR-100) and ImageNet Large Scale Visual Recognition Challenge (ILSVRC12) datasets, showcasing
accuracy improvements over previous techniques. The results indicate that the combination of the volumetric
input and curriculum learning holds significant promise for mitigating adversarial attacks without necessitating
adversary training.
1. Faculty of Engineering Petroleum
Engineering Department
Fluid Mechanics Laboratory, 2nd stage
Experiment Name. Flow meter Demonstration and
Fluid flow rate
Prepared by: Muhammed Fuad Rashid
Ahmad Jalal Hasan
Muhammad Hasan Aziz
Safwan Tofiq Ameen
Group: A
Supervised by: Mr. Dara & Mr. Younis
2. Contents
Aim of the experiment....................................................................................................................................... 3
Introduction....................................................................................................................................................... 4
Hydraulic bench unit ...................................................................................................................................... 4
Unit description ............................................................................................................................................. 1
Rotometer ..................................................................................................................................................... 2
Nozzle and Orifice plate ................................................................................................................................. 2
Venture meter ............................................................................................................................................... 3
Tools used in the experiment............................................................................................................................. 4
Procedure.......................................................................................................................................................... 6
Procedure of hydraulic bench......................................................................................................................... 6
Determining flow rate using the three basic flow meters............................................................................... 7
Connecting and operating the manometer..................................................................................................... 7
Tables of readings.............................................................................................................................................. 8
Hydraulic bench readings ............................................................................................................................... 8
The three flow meters readings...................................................................................................................... 8
Tables of calculatings ......................................................................................................................................... 9
Hydraulic bench calculating............................................................................................................................ 9
The three flow meters calculatings................................................................................................................. 9
...................................................................................................................................................................... 9
Discussion.........................................................................................................................................................10
References........................................................................................................................................................25
3. Aim of the experiment
1-Comparison between different flow meter types.
2-Determining the discharge coefficient
3-Measuring the fluid flow rate.
4. Introduction
Hydraulic bench unit
The basic Hydraulics Bench and the various ancillary modules
available form a comprehensive laboratory facility which enables a
detailed Mechanics of Fluids Laboratory. The hydraulics bench unit
provides the basic services for the pumping and volumetric
measurement of the water supply with which all the additional
accessories and experiments are used.
The working surface of the unit is in fiberglass, molded to provide a
recessed area on which to mount experiments. An integral weir tank
is provided along with a volumetric measuring tank. The measuring
tank is stepped to enable for accurate measuring of both high and
low flow rates. A level indicator allows convenient read out of the
flow. The measuring tank discharges into a fiberglass sump tank via
a valve. Overflow pipe is provided. An electric motor drives a
submersible motor driven pump which delivers water to the outlet
at the working surface for connection to the individual experiments.
1- Volumetric measuring tank with
channel
2-Remote sight gauge
3- Sliding valve
4- Sump tank
5- Drain cock
6- Submersible motor driven
pump
7- Water supply for accessories
with pump
8- Flow control valve
9- Overflow pipe
10- Switch box
11- Discharge cap
12- Water supply connection for
accessories without pump
1
6. 2
Rotometer
A rotometer with the following characteristics
is used to measure flow rate:
- Plastic measuring tube
- Interchangeable stainless steel float
- Interchangeable percentual scale
- Max. flow rate 1600 l/h
The flow rate can be read from the upper edge
of the conical attachment.
Air bubbles or dirt particles on the float may
affect measurement precision.
To flush them out, operate the test stand at
maximum flow rate first. To do so, open all
cocks fully.
Nozzle and Orifice plate
The orifice plate housing is made of
transparent plastic allowing visible
functioning of the orifice plate. The flow
causes a pressure loss between inlet and
outlet. Two tapings allow measurement of
inlet and outlet pressures. This differential
pressure (p1-p2) is proportional to the
volume flow rate:
Q cd A2
7. 3
Venture meter
The Venturi housing is made of
transparent plastic allowing visible
functioning of the Venturi. The
pressure in the Venturi is inversely
proportional to the velocity in the
Venturi according to Bernoulli’s law.
Two tapings allow measurement of the
inlet pressure and the pressure at the
smallest area. This differential pressure
(p1-p2) is proportional to the volume
flow rate:
Q cd A2
8. 4
Tools used in the experiment
Hydraulic Bench parts
1- Volumetric measuring tank with channel
2- Remote sight gauge
3- Sliding valve
4- Sump tank
5- Drain cock
6- Submersible motor driven pump
7- Water supply for accessories with pump
8- Flow control valve
9- Overflow pipe
10- Switch box
11- Discharge cap
12- Water supply connection for accessories without pump
10. 6
Procedure
Procedure of hydraulic bench
1-Turn on the pump.
2-Set the stop watch to zero.
3-Close the valve at the bottom of the volumetric
tank, wait until the liquid reachs a value of 10 litres
and at the same start the watch.
4-After the liquid reached a value of 20 litres stop the watch.
5-Read off and note the measurement time and the
high value of water in tank.
11. 7
Determining flow rate using the three basic flow meters
Connecting and operating the manometer
1. Arrange the experimentation set-up on the
Hydraulic Bench such that the discharge routes
the water into the channel.
2. Make hose connection between Hydraulic Bench and unit.
3. Connect measurement lines.
4. Open all valves at pipe section and 6-tube
manometer, let the water flow for 1 minute.
5. Close flow control valve.
6. Close drain valve of the 6-tube manometer to vent the
measurement lines.
7. Close vent valves of the 6-tube manometer.
8. Close water inlet.
9. Disconnect measurement lines.
Open vent and drain valve to discharge level tubes of the 6-tube
manometer.
10. Close vent and drain valves
11. Open flow control valve slowly
12. Connect measurement lines again
13. Open water inlet slowly
14. Adjust the heights of the water in the
manometer tubes with the help of flow control
valve until water becomes visible
15. Set the flow rate and the measuring scale
with the inlet and outlet control valves
16. Determine volumetric flow rate. To do so,
use stopwatch to establish time t required for raising
the level in the volumetric tank of the Hydraulic
Bench.
12. 8
Tables of readings
Hydraulic bench readings
No. V
(litre)
t
(s)
1 6 26.91
2 4 16.9
3 7 27.14
The three flow meters readings
No.
Venture meter Flow Nozzle Rotameter
V
(lit)
t
(s)h1 h2 h1 h2
Qrot
(lit/h)
1 65 12 165 80 630 6 26.91
2 106 16 220 122 690 4 16.9
3 154 44 287 175 740 7 27.14
13. 9
Tables of calculatings
Hydraulic bench calculating
No.
V
(m3
)
t
(s)
Q
3
( m
)
s
m
( kg
)
s
W
( N
)
s
1 6 26.91 0.2229654 222.9654 2187.291
2 4 16.9 0.2366864 236.6864 2321.8935
3 7 27.14 0.2579219 257.9219 2530.2137
The three flow meters calculatings
No.
Qact
(cm3
)
s
Rotometer Venture meter Flow orifice
Qrot
(cm3
)
s
Qi
(cm3
)
s
Cd
Qi
(cm3
)
s
Cd
1 222.695 175 161.896 1.377 242.645 0.919
2 236.688 791.667 210.965 1.122 260.54 0.908
3 257.922 205.556 233.235 1.106 278.529 0.927
14. 10
Discussion
Discussion by ahmad jalal hasan
1The three flow meters discussion
1-Calibrate the Rotometer by plotting the Q (act) vs
Q(rot).
As we observe on this plot which is between the Q (rot) and Q (act)
the relation between the two flow rates is leaner that means as
increasing one of the flow rates the increases to, but the increasing
rate between them is not a liner that means as we can see the
values of Q (act) are increasing more than the Q (rot)because the
plot tens to the x axis more which represents the Q (act) or actual
flow rate .
2.1- the discharge coefficient ( Cd ) of venture meter vs. the
actual flow rate ( Qact )
170
175
180
185
190
195
200
205
210
220 225 230 235 240 245 250 255 260
Qrot.
Q act
Qrot Vs. Qact
15. 11
As we can see here on this plot there’s a rapid reduction or decreasing of
the ventures CD(coefficient of discharge) but after that the plot is then tend
to decrease but in a nearly equal of both plots titels so in both cases as the
Q act decrease the CD is also decreases,
2.2- the discharge coefficient ( Cd ) of nozzle meter vs. the
actual flow rate ( Qact )
1.08
1.13
1.18
1.23
1.28
1.33
1.38
220 225 230 235 240 245 250 255 260
CdVenturemeter
Q act.
0.905
0.91
0.915
0.92
0.925
0.93
220 225 230 235 240 245 250 255 260
Cdnozzlemeter
Q act
Cd nozzle meter vs Q act
16. 12
In this plot which is between CD of the nozzle meter and Q act
there’s also a rapid decreasing between the two titles this is down
to a specific point then after that point again the leaner relation
ship stars so as the two titles will increase together , this relation is
between three point that but it could be another relation after
other points after this three points
2The hydraulic bench discussion
1-Draw the relation between Q & m, then find the slop of
the relation
17. 13
The slope of the plot equals to 1000
3-Draw the relation between Q & W, then find the slop of
the relation.
The slop of the plot equals to 9809.984
220
225
230
235
240
245
250
255
260
0.22 0.225 0.23 0.235 0.24 0.245 0.25 0.255 0.26
Massflowrate
Volumetric flow rate
Volumetric flow rate vs Mass flow
rate
2150
2200
2250
2300
2350
2400
2450
2500
2550
0.22 0.225 0.23 0.235 0.24 0.245 0.25 0.255 0.26
wieghtflowrate
volumeitricflow rate
wieght flow rate vs volumeitric flow rate
18. 14
3-What do you understand by the slops above?
According to these two slopes which for the first one is 1000 which obtained
from the plot of Q & m and the second plot which is between Q &
W equals to 9809.984 both two plots are leaner which means both
of them are inceasing with there x any y representation’s as Q or M
or W but there’s a different in the values of the 2 slopes which will
make the second more leaner in the ratio of increasing between to
its values which is between Q & W more than the first plot which
then tend to increase in ratio more than the Q s which means the
M tends to increase in higher values than the its Q value in first
plot.
4-what are the factors that could effect on a fluids flow rate?
Viscosity of the fluid
Density of the fluid
Velocity of the fluid
Change in temperature that will Couse to change in viscosity
and density
Physical properties of the pipe that the fluid goes throw i.e..
The length, inner dimeter
5-how does the flow rate of a fluid can affect and help our
life?
19. 15
The flow rate in our life can help us in such ways,for example the
sun warms a certain place and thus decreases the density of the fluid
which is air, this reduction of density expands against the fluid thus
making wind .
6-do all liquids flow?
We can say all liquids flow and fill the shape of the container and
not change in volume the limitation of the space between the
particles of the fluid have only limited compressibility.
7-how can a fluid flow?
There is a way to make the fluids flow through a pipe which is to tilt
the pipe and make the pipe down ward so as to the gravitational
energy which is kinetic to convert to kinetic energy thus makes the
fluid to go dawn ward and make it flow.
8-can flow rate of a fluid affected by cohesion?
Yes it can be, first cohesion is the force of attraction between the
molecules, so here we have two cases that cohesion effect on flow
rate;
Fluids with high cohesion such as maple syrup has low flow rate
But fluid with low cohesion are thin and runny and have faster flow
rates like water .
20. 16
Discussion by Mhamad Hasan Aziz
1-Calibrate the Rotometer by plotting the Q (act) vs
Q(rot).
2.1- the discharge coefficient ( Cd ) of venture meter vs. the
actual flow rate ( Qact )
170
175
180
185
190
195
200
205
210
220 225 230 235 240 245 250 255 260
Qrot.
Q act
Qrot Vs. Qact
1.08
1.13
1.18
1.23
1.28
1.33
1.38
220 225 230 235 240 245 250 255 260
CdVenturemeter
Q act.
21. 17
2.2- the discharge coefficient ( Cd ) of nozzle meter vs. the
actual flow rate ( Qact )
1-Draw the relation between Q & m, then find the slop of
the relation
220
225
230
235
240
245
250
255
260
0.22 0.225 0.23 0.235 0.24 0.245 0.25 0.255 0.26
Massflowrate
Volumetric flow rate
Volumetric flow rate vs Mass flow
rate
0.905
0.91
0.915
0.92
0.925
0.93
220 225 230 235 240 245 250 255 260
Cdnozzlemeter
Q act
Cd nozzle meter vs Q act
22. 18
3-Draw the relation between Q & W, then find the slop of
the relation.
2150
2200
2250
2300
2350
2400
2450
2500
2550
0.22 0.225 0.23 0.235 0.24 0.245 0.25 0.255 0.26
wieghtflowrate
volumeitricflow rate
wieght flow rate vs volumeitric flow rate
23. 19
Discussion by Safwan Tofiq
1-Calibrate the Rotometer by plotting the Q (act) vs
Q(rot).
2.1- the discharge coefficient ( Cd ) of venture meter vs. the
actual flow rate ( Qact )
170
175
180
185
190
195
200
205
210
220 225 230 235 240 245 250 255 260
Qrot.
Q act
Qrot Vs. Qact
1.08
1.13
1.18
1.23
1.28
1.33
1.38
220 225 230 235 240 245 250 255 260
CdVenturemeter
Q act.
24. 20
2.2- the discharge coefficient ( Cd ) of nozzle meter vs. the
actual flow rate ( Qact )
1-Draw the relation between Q & m, then find the slop of
the relation
220
225
230
235
240
245
250
255
260
0.22 0.225 0.23 0.235 0.24 0.245 0.25 0.255 0.26
Massflowrate
Volumetric flow rate
Volumetric flow rate vs Mass flow
rate
0.905
0.91
0.915
0.92
0.925
0.93
220 225 230 235 240 245 250 255 260
Cdnozzlemeter
Q act
Cd nozzle meter vs Q act
25. 21
3-Draw the relation between Q & W, then find the slop of
the relation.
4/
self-contained facility designed to demonstrate the important
characteristics of 14 types of flow meter used in the measurement
of water flow through pipes or open channels. Equipment purchase
can be configured to suit the course being followed.
Discussion by Muhammed Fuad Rashid
1-Calibrate the Rotometer by plotting the Q (act) vs
Q(rot).
2150
2200
2250
2300
2350
2400
2450
2500
2550
0.22 0.225 0.23 0.235 0.24 0.245 0.25 0.255 0.26
wieghtflowrate
volumeitricflow rate
wieght flow rate vs volumeitric flow rate
26. 22
2.1- the discharge coefficient ( Cd ) of venture meter vs. the
actual flow rate ( Qact )
2.2- the discharge coefficient ( Cd ) of nozzle meter vs. the
actual flow rate ( Qact )
170
175
180
185
190
195
200
205
210
220 225 230 235 240 245 250 255 260
Qrot.
Q act
Qrot Vs. Qact
1.08
1.13
1.18
1.23
1.28
1.33
1.38
220 225 230 235 240 245 250 255 260
CdVenturemeter
Q act.
27. 23
1-Draw the relation between Q & m, then find the slop of
the relation
3-Draw the relation between Q & W, then find the slop of
the relation.
220
225
230
235
240
245
250
255
260
0.22 0.225 0.23 0.235 0.24 0.245 0.25 0.255 0.26
Massflowrate
Volumetric flow rate
Volumetric flow rate vs Mass flow
rate
0.905
0.91
0.915
0.92
0.925
0.93
220 225 230 235 240 245 250 255 260
Cdnozzlemeter
Q act
Cd nozzle meter vs Q act
28. 24
3-What do you understand by the slops above?
If we look at the diagrams above we’ll understand that there are a
proportional relation between Qact. And Qrot although they both used to
determine flow rate but there are some slightly difference between them
that because of the way that the operator used the methods and maybe
they was not accurate in timing or reading scales and also different
operators had done the experiment separately so this is increase the
chance of making errors despite that the Qact. Supposed to be more
accurate because we are using it as a reference to find out the m , W and
Cd.
The relations between Cd Venture meter and Qact
Are linear relation but according to our experiments the relations between
Cd Rotometer and Qact is not linear.
As it’s predicted the relations between Volumetric Flow rate with mass and
weight flow rates are proportionally increase and decrease because they (m
and W) are derived from volumetric flow rate despite that m is effected by
density of the fluid and W is depends on density of the fluid and
acceleration of gravity.
2150
2200
2250
2300
2350
2400
2450
2500
2550
0.22 0.225 0.23 0.235 0.24 0.245 0.25 0.255 0.26
wieghtflowrate
volumeitricflow rate
wieght flow rate vs volumeitric flow rate
29. 25
References
References: “Basic Concepts Related to Flowing Water and Measurement”.
http://www.usbr.gov/.
Bragg, S.L., (1960). “Effect of Compressibility on the Discharge Coefficient
of Orifices and Convergent Nozzles”. Journal of Mechanical Engineering Vol.
2(35). http://jms.sagepub.com/.
Cengel, Y. A. and Cimbala, J.M. (2014). Fluid Mechanics: Fundamentals and
Applications. (pp. 89-93). New York City, New York: McGraw-Hill.
(2010). “Fundamentals of Orifice Meter Measurement”. Daniel
Measurement and Control White Papers.
http://www2.emersonprocess.com/.
Hua, Jian, James M. Steichen, & Bruce M. McEnroe. (1989). “Orifice Plates
to Control the Capacity of Terrace Intake Risers”. Applied Engineering in
Agriculture Vol. 5(3):397-401. http://elibrary.asabe.org/.
(2005). “Types of Gas Mass Flow Meters”. Alicat Mass Flow Meters and
Pressure Controllers. http://www.alicat.com/