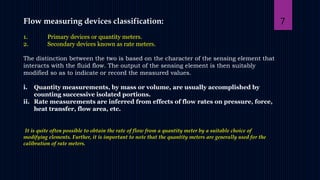
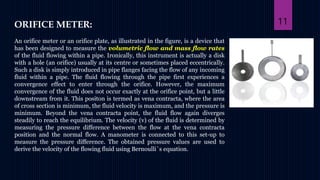
SlideShare a Scribd company logo
1 of 37
Fluid flow
Measurement
1
In the physical world, mechanical
engineers are frequently required to
monitor or control the flow of various
fluids through pipes, ducts and
assorted vessels. This fluid can range
from thick oils to light gasses. While
some techniques work better with
some groups of fluids, and less well
with others, some are not at all suitable
for some applications. In this primer on
fluid flow instrumentation we will look
at a wide variety of flow transducers
and their application in the physical
world.
Introduction: 2
FLOW MEASUREMENT
has a history of about 3000 years. It has been studied only in the last 200 years and in the last 30
years all the new techniques have evolved. There is now a wide variety of methods available to
measure the flow of liquids, solids, gases and vapours.
There are three different flow quantities to be measured :-
1. The actual velocity of the fluid at a given point (measured in metres per second).
2. The volume rate of flow (measured in metres cubed per minute).
3. The mass flow rate (measured in kilograms per second).
It is also possible to measure total flow which is the total volume or mass which
has flowed in a set time period.
3
Flow measurements application :
1. transportation of solids as slurries.
2. compressed natural gas in pipelines.
3. water and gas supply systems to domestic consumers.
4. irrigation systems and a number of industrial process control systems.
The types of flows encountered is one or combination of the
following types:
1. Clean or dirty/opaque.
2. wet or dry.
3. Hazardous/corrosive or safe.
4. Single-phase.
5. Two phase or multiphase.
6. laminar or transitional or turbulent.
pressure may vary from vacuums to high pressures of many atmospheres,
temperature may vary from cryogenic levels to hundreds of centigrade, and flow
rate may be of miniscule type, i.e., few drops per minute or massive type involving
thousands of litres per minute
4
Flow meter is an instrument that is
used to gauge the flow of gases or
fluid through a pipe. Flow
measurement applications differ
extensively with respect to the
conditional benchmarks, situational
limitations, and engineering
requirements.
Flow meter has other names such as
fluid meter, fluid sensor, flow sensor
and flow gauge. They have a wide
range of applications across different
industries based on its basic
function, which is to offer precise
monitoring and measurement for flow
of fluids or gases.
5
The selection of flow measuring equipment
depends primarily on………….
1. The nature of the metered fluid and the demands of the associated plant.
For example : an aircraft fuel meter require to be compact and must not be affected by the
changes in orientation, but has to handle only clean and non-corrosive fluid.
2. Many industrial flow meters have to work with fluids which may be corrosive in nature or may contain
foreign matters, but the equipment may be relatively large and of fixed type.
3. Various performance parameters like range, accuracy, repeatability, linearity, dynamic response,
4. Type of output like analog/digital, etc.
5. Functions to Indicate or record the rate of flow, total flow or may be both these quantities
6
Flow measuring devices classification:
1. Primary devices or quantity meters.
2. Secondary devices known as rate meters.
The distinction between the two is based on the character of the sensing element that
interacts with the fluid flow. The output of the sensing element is then suitably
modified so as to indicate or record the measured values.
i. Quantity measurements, by mass or volume, are usually accomplished by
counting successive isolated portions.
ii. Rate measurements are inferred from effects of flow rates on pressure, force,
heat transfer, flow area, etc.
It is quite often possible to obtain the rate of flow from a quantity meter by a suitable choice of
modifying elements. Further, it is important to note that the quantity meters are generally used for the
calibration of rate meters.
7
The most common principals for fluid flow
metering are:
1. Differential Pressure Flow meters
2. Velocity Flow meters
3. Positive Displacement Flow meters
4. Mass Flow meters
5. Open Channel Flow meters
8
Differential Pressure Flow Meters
Differential pressure flow meters measure the differential
pressure across an orifice where flow is directly related to
the square root of the differential pressure produced.
There are also primary and secondary elements in
differential flow meters. The primary element produces
change in kinetic energy using either flow nozzle, pitot
tube, orifice plate, or venturi flow meters. The secondary
element measures the differential pressure and provides
the signal.
9
10
ORIFICE METER:
An orifice meter or an orifice plate, as illustrated in the figure, is a device that
has been designed to measure the volumetric flow and mass flow rates
of the fluid flowing within a pipe. Ironically, this instrument is actually a disk
with a hole (an orifice) usually at its centre or sometimes placed eccentrically.
Such a disk is simply introduced in pipe flanges facing the flow of any incoming
fluid within a pipe. The fluid flowing through the pipe first experiences a
convergence effect to enter through the orifice. However, the maximum
convergence of the fluid does not occur exactly at the orifice point, but a little
downstream from it. This positon is termed as vena contracta, where the area
of cross section is minimum, the fluid velocity is maximum, and the pressure is
minimum. Beyond the vena contracta point, the fluid flow again diverges
steadily to reach the equilibrium. The velocity (v) of the fluid is determined by
measuring the pressure difference between the flow at the vena contracta
position and the normal flow. A manometer is connected to this set-up to
measure the pressure difference. The obtained pressure values are used to
derive the velocity of the flowing fluid using Bernoulli`s equation.
11
12
(v1 2 )/2] + gh1 + (P1/ρ1) = [(v2 2 )/2] + gh2 +
(P2/ρ2)
Here, v1 and v2 refer to the velocity of the fluid at the
normal flow and vena contracta positions, respectively;
g is the acceleration due to gravity;
h1 and h2 refer to the vertical distance of the normal flow
and vena contracta positions, from the datum line,
respectively;
P1 and P2 refer to the pressure values at the normal flow
and vena contracta positions, respectively;
ρ1 and ρ2 are the fluid densities at the normal flow and
vena contracta positions, respectively.
13
In incompressible fluids, ρ1 = ρ2 = ρ.
Assuming the pipe is horizontal, gh1 = gh2
The equation could be simplified as follows: (v2 2 – v1 2 )/2 = (P1 – P2)/ρ
This equation can be further simplified by substituting v1 = Q/A1; v2 = Q/A2,
where Q is the volumetric flow rate.
Since A1 and A2 cannot be directly equated to the areas of pipe and vena contracta
respectively, a coefficient of discharge (Cd) is introduced into the equation.
Q = Cd [A2/√1 − ( 𝐴2 /𝐴1 ) 2 ] √ 2 (𝑃1−𝑃2) 𝜌
Further Q = K√𝛥𝑃
Here, K = Cd {A2 x 1.414/√𝜌[1 − ( 𝐴2/ 𝐴1 ) 2 ]}
is a constant with respect to the application of the orifice meter.
14
Example:
The differential pressure across an orifice meter in an airline is
measured by a simple water manometer. The manometer registers a
differential head of 100mm water when the flow rate in the line is 10,000
m3 /hour of air at a density of 2 kg/m3 . A proposal is made to use the
same installation to measure the rate of flow of water in the line, using
mercury in place of water in the manometer. Estimate the difference in
the levels of mercury on the two sides of manometer which would be
obtained for a flow rate of 2,000 m3 /Hour of water. Assume that co-
efficient of discharge remains the same & there is negligible compression
of air. The density of mercury is 13.6 x10³ Kg/m3 .
Let subscripts 1and 2 refer to air and water respectively.
Differential pressure (P1 – P2)1 = g h1 (ρm – ρf) = 9.81 x 100 x 10-3
(1000 – 2) = 979 N / m2
The flow rate is given by, Q = {(Cd A2) / [√1 – (A2 / A1)2]} x √ (2/ρ) (P1 –
P2)
Therefore, Q1 / Q2 = [√ (2/ρ1) (P1 – P2)1] / [√ (2/ρ2) (P1 – P2)2]
10,000 / 2,000 = [√ (2/2) x 979] / [√ (2/1000) x (P1 – P2)2] (P1 – P2)2 =
19580 N / m2
Differential pressure in case of water with mercury manometer is,
19580 / [(13.6 – 1) x 9.81] = 158.4 mm of Hg
15
The Pitot Tube:
A pitot tube is a simple device meant
for measuring the velocity of a liquid
at any point. In its simple form the
pitot tube consists of a glass tube
whose lower end is bent at right
angles (Fig). The device is placed in a
moving liquid with the lower opening
directed in the upstream direction.
The liquid level in the pitot tube will
depend on the velocity of the stream.
The pitot tube in the form shown in
the figure is meant for measuring the
velocity at any point in a stream of
liquid whose surface is open to the
atmosphere.
Let the inlet of the pitot tube be at
depth H below the liquid surface.
Consider the two points A and B. The
point B is just at the inlet to the pitot
tube while the point A is at the same
level as that of B but at some distance
from B.
16
If the pitot tube is to be used to
measure the velocity of a liquid
in a pipe, then we must adopt
some method to know the static
pressure head H. For instance,
we may use a pitot tube and a
vertical piezometer tube and
measure the difference of the
liquid levels in the two tubes.
See Fig. Another method is to
connect the pitot tube and the
piezometer tube and note the
difference of liquid levels in the
two tubes. See Fig.
17
In another arrangement the pitot tube and vertical tube connected to
the pipe may be connected to a U-tube containing a heavy liquid
like mercury. See Fig. If the difference of level of the heavy liquid in
the U-tube is y
In the arrangements described above two openings are needed in the pipe wall. Moreover, the
static pressure tap does not sense the pressure at the point where the stagnation pressure is
measured. To overcome these difficulties the pitot-static tube (Fig.) is devised.
18
Pitot static Tube:
The pitot tube, illustrated in figure, is a device that is used to
measure the local velocity and total pressure of a fluid, as
against the velocity measured across the tube in case of an
orifice plate and a venture meter. It finds extensive application
in aircrafts.
As illustrated in the figure, a pitot tube consists of an L shaped
structure held upfront against the fluid flow. It consists of a
static probe and an impact probe. The impact probe should
face a direction that is against the fluid flow. While the static
probe measures the static pressure in the system, the impact
probe is meant to measure the total pressure of the system.
When the fluid flows against the tip of the impact probe, it is
brought to rest.
This has an effect (rise) on the pressure (P2) corresponding to
P1 at the static probe. Applying Bernoulli`s Theorem for an
incompressible fluid, we get the following equation:
(P2/ρ) = v2 2 + (P1/ρ) or velocity v = √ 2 𝜌 (𝑃2 − 𝑃1)
19
Pitot tubes were invented by Henri Pitot in 1732 to measure the flowing
velocity of fluids. Basically a differential pressure (d/p) flow meter, a
pitot tube measures two pressures: the static and the total impact
pressure. The static pressure is the operating pressure in the pipe, duct,
or the environment, upstream to the pitot tube. It is measured at right
angles to the flow direction, preferably in a low turbulence location
(Figure)
The total impact pressure (PT) is the sum of the static and kinetic
pressures and is detected as the flowing stream impacts on the pitot
opening. To measure impact pressure, most pitot tubes use a small,
sometimes L-shaped tube, with the opening directly facing the oncoming
flow stream. The point velocity of approach (VP) can be calculated by
taking the square root of the dynamic pressure – which is the difference
between total pressure (PT) and the static pressure (P) – and
multiplying that by the C/D ratio, where C is a dimensional constant and
D is density:
VP = C(PT – P)1/2 / D
20
When the flowrate is obtained by multiplying the point velocity (VP) by the cross-sectional area of the
pipe or duct, it is critical that the velocity measurement be made at an insertion depth which
corresponds to the average velocity. As the flow velocity rises, the velocity profile in the pipe changes
from elongated (laminar) to more-flat (turbulent). This changes the point of average velocity and
requires an adjustment of the insertion depth. Pitot tubes are recommended only for highly turbulent
flows (Reynolds numbers > 20,000) and, under these conditions, the velocity profile tends to be flat
enough so that the insertion depth is not critical.
In 1797, G.B. Venturi developed a short tube with a throat-like passage that increases flow velocity and
reduces the permanent pressure drop. Special pitot designs are available that, instead of providing just
an impact hole for opening, add a single or double venturi to the impact opening of the pitot tube. The
venturi version generates a higher differential pressure than does a regular pitot tube.
21
Static Pressure Measurement
In jacketed (dual-walled) pitot tube designs, the impact pressure port faces forward into the flow, while
static ports are, instead, spaced around the outer tube. Both pressure signals (PT and P) are routed by
tubing to a d/p indicator or transmitter. In industrial applications, the static pressure (P) can be measured
in three ways:
1. Through taps in the pipe wall – pressure taps connect the tube to a manometer where the pressure
differential is indicated.
2. By static probes inserted in the process stream.
3. By small openings located on the pitot tube itself or on a separate aerodynamic element.
Wall taps can measure static pressures at flow velocities up to 200 ft/sec. A static probe (resembling an L-
shaped pitot tube) can have four holes of 0.04 inches in diameter, spaced 90o apart. Aerodynamic bodies
can be cylinders or wedges, with two or more sensing ports.
Errors in detecting static pressure arise from fluid viscosity, velocity, and fluid compressibility. The key to
accurate static pressure detection is to minimize the kinetic component in the pressure measurement.
22
Example: A submarine moves horizontally in the sea and has its axis much below the
surface of sea water. A pitot tube properly placed just in front of the submarine is
connected to a differential pressure gauge. The pressure differential between the pitot
pressure and static pressure was found to be 20 kN/m2 . Find the speed of the
submarine if the density of sea water is 1026 kg/m3 .
The pressure differential between the pitot pressure and static pressure,
= 20 kN/m2 = 20 x 103 /(1026 x 9.81) = 1.987 m of sea water.
This head is due to the velocity of fluid with respect to the submarine, i.e., due to the velocity of the
submarine.
V2 /2g = 1.987
V = √1.987 x 2 x 9.81 = 6.24 m/s
23
Rotameter:
Force Direction of force Type of force
Weight (w) Downward Constant
Buoyancy (b) Upward Constant
Drag/ Blow force (d) Upward Variable
Three forces act on the float. They are as follows.
 Rotameter is a device which is used in chemical and related
industries in order to measure the flow rate or average velocity
of the flowing fluid.
 Rotameter is a simple equipment which consists of a tapered
tube and a float. The float is placed inside the tube and usually
nets are placed at both the ends of the tube. This arrangement
can be connected with a pipe line with flanged connections.
Rotameters are always installed vertically in the pipelines. A
scale is marked on the tube to read the values of flow rate
directly.
24
Rotameter Working:
 When the fluid is not flowing then the float rests at the bottom of the rotameter.
The fluid is made to pass through the rotameter such that the direction of flow of
the fluid is parallel to the axis of the rotameter.
 The flow of fluid through the rotameter causes the float to move along with the
fluid. There are two primary forces involved, an upward drag force due to the
motion of the fluid in upward direction and a downward force due to gravity
which is due to the weight of the float itself. When these forces are balanced then
the float moves to a particular location in the tube and it stays right there
because it has achieved dynamic equilibrium.
 In case it happens that the flow rate of fluid flowing through the rotameter is
very high then it may happen that the float may get swept along with the fluid.
The nets attached to either side of the rotameter ensure that the float does not
get carried away in the pipe line. If it happens then it may get stuck near a valve
in pipeline and cause blockage or enter equipment down the line and cause it to
malfunction. A down side of net is that if the flow rate of flowing fluid is very
high then the float will get stuck near the net and act as a blockage for the fluid
flow, this may cause the flanges to get weakened and the liquid may start
showering at the site of rupture.
25
The force balance equation of the float is
Fdrag + Fbuoyancy = Fweight
Af (Pd – Pu) + ρff g Vf = ρf g Vf
(Pd – Pu) = (Vf/Af) g (ρf - ρff)
Where ρf and ρff are the densities of the float and floating fluid, respectively
Vf is the volume of the float Pd and Pu are the pressure at the downward and
upward faces of the float, respectively
Now a kind of constriction is formed between the downward surface and
upward surface of the float.
Using equation, Q = Cd [A2/√1 − ( 𝐴2 𝐴1 ) 2 ] √ 2 (𝑃1−𝑃2) 𝜌
we get the volume rate of flow: Q = Cd [At (At – Af)/√(At)2 − (At – Af)2 ] √2𝑔
√(Pd – Pu)/ρff g
Where At is the area of the tube at the float level, (At – Af) is the minimum
annular area between tube and the float and Cd is the coefficient of discharge.
Substituting the value of (Pd – Pu)
from equation (Pd – Pu) = (Vf/Af) g (ρf - ρff)
We get, Q = Cd [(At – Af)/√1 − (At – Af)2/(At )2] √2𝑔 √(Vf/Af) √(ρf - ρff)/ ρff
If the variation of Cd with the float position is slight and if (At – Af)/At ˂ 1,
then Q = 𝐾 √(ρf - ρff)/ ρff,
Where K is the constant of the rotameter.
26
Example: A rotameter is calibrated for metering a liquid of density 1000 kg/m3 and has a
scale ranging from 1 to 100 liter/min. It is intended to use this meter for metering the
flow of gas of density 1.25 kg/m3 with a flow range between 20 and 2000 liter/min.
Determine the density of the new float, if the original one has the density of 2000 kg/m3
The shape and volume of both floats is assumed to be the same.
Let the subscripts 1 and 2 refer to the liquid flow and gas flow, respectively, through the rotameter.
Using the equation, Q = 𝐾 √(ρf - ρff)/ ρff,
we get the actual discharge as: Q1 = K √(ρf1 - ρff1)/ ρff1 - for liquid flow
Q2 = K √(ρf2 - ρff2)/ ρff2 - for gas flow
Where K is the constant of the rotameter.
The scale ratio between gas flow and liquid flow is, 20/1 = 2000/100 = 20
Therefore, Q2 = 20Q1 or Q2/Q1 = 20
Substituting the values of Q1 and Q2 from the rotameter discharge equation
we get, Q2/Q1 = 20 = [(ρf2 - ρff2) ρff1/[(ρf1 - ρff1) ρff2] ^1/2
Substituting the values of ρf1, ρg1 and ρg2 and squaring we get,
400 = [(ρf2 – 1.25) x 1000]/ [(2000 – 1000) x 1.25
Simplifying the above expression we get, Ρf2 = density of float for gas flows = 501.25 kg/m3
27
Important applications of rotameter
 The rotameter is used in process industries.
 It is used for monitoring gas and water flow in plants
or labs.
 It is used for monitoring filtration loading.
 Applicable to a wide variety of gases and liquids
 Flow range 0.04 L/h to 150 m3/h for water
 Flow range 0.5 L/h to 3000 m3/h for air
 Uncertainty 0.4% to 4% of maximum flow
 Insensitivity to non-uniformity in the inflow (no
upstream straight piping needed)
 Typical maximum temperature 400°C
 Typical maximum pressure 4 MPa (40 bar)
 Low investment cost
 Low installation cost
28
Advantages of Rotameter:
 It is simple to install and is easy and cheap to maintain.
 It has a linear scale over large range of flow rates.
 The pressure drop across the float is constant. Hence the pressure loss due to the float itself is quite small.
 Rotameters are very versatile, they can be easily sized or their use can be changed for different systems.
Disadvantages of Rotameter:
 It requires a certain minimum magnitude of flow rate of fluid below which the float would fall and just stick to the rotameter.
 If opaque fluid is used then the scale is not properly visible, it may cause misreading the meter.
 It cannot be installed in a horizontal position.
 If flow rate of fluid is very high then glass tubes may be subject to breakage.
29
Positive Displacement Flowmeters
A positive displacement flowmeter, commonly called a PD meter, measures the volume flow
rate of a continuous flow stream by momentarily entrapping a segment of the fluid into a
chamber of known volume and releasing that fluid back into the flow stream on the discharge
side of the meter.
By monitoring the number of entrapments for a known period of time or number of
entrapments per unit time, the total volume of flow or the flow rate of the stream can be
ascertained.
The total volume and the flow rate can then be displayed locally or transmitted to a remote
monitoring station.
Advantages PD Meters
1. High-quality, high accuracy, a wide range, and
are very reliable, insensitive to inlet flow profile
distortions, low pressure drop across the meter.
2. Until the introduction of electronic correctors
and flow controls on other types of meters, PD
meters were most widely used in batch loading
and dispensing applications. All mechanical
units can be installed in remote locations.
Dis-advantages PD Meters
1. Bulky, especially in the larger sizes.
2. The fluid must be clean for measurement
accuracy and longevity of the meter.
3. More accurate PD meters are quite expensive.
4. Have high inertia of the moving parts; a sudden
change in the flow rate can damage the meter.
5. Only for limited ranges of pressure and
temperature
6. Most PD meters require a good maintenance
schedule and are high repair and maintenance
meters.
7. Recurring costs in maintaining a positive
displacement flowmeter can be a significant
factor in overall flowmeter cost.
30
Industries:
The industries where they are used in descending order are oil and gas, water and
wastewater, chemical, power, pharmaceutical, food and beverage, pulp and paper,
metals and mining and aerospace.
Application Cautions for Positive Displacement Flowmeters:
Avoid using positive displacement flowmeters in dirty fluids unless the dirt can be
effectively removed upstream of the flowmeter. Operating these flowmeters in dirty
fluids can cause plugging and increase maintenance costs. Be careful when selecting
bearings because the non-lubricating nature of some fluids, impurities, and dirt can
increase bearing wear and maintenance costs. Note that bearings usually do not
necessarily fail catastrophically; they can slow down and adversely affect accuracy
before they stop working.
Avoid liquids with gas bubbles unless the bubbles can be effectively removed. As
viscosity increases, be sure to ensure that the pressure drop across the flowmeter is
acceptable. Make sure that the viscosity of the operating fluid is similar to that of the
calibrated fluid, because the different amounts of slippage exhibited by different fluids
can cause measurement error.
31
Nutating Disc Flow Meters
Working Principle
Nutating disc flow meters are one of the most common types
of positive displacement flow meter. They operate by having a disc
mounted to a central ball. When fluid enters the chamber, it causes the
disc to wobble (nutate), transferring the displaced volume to the register.
Something to keep in mind, is that due to the nutating discs
nature, the accuracy of this type of flow meter can be
adversely affected by fluctuations in liquid viscosity
Liquid enters a precision-machined chamber containing a disc
which nutates (wobbles). The position of the disc divides the
chamber into compartments containing an exact volume.
Liquid pressure drives the disc to wobble and a roller cam
causes the nutating disc to make a complete cycle.
This motion is translated into rotary motion by means of a ball
and shaft, which is attached to the disc. The movements of the
disc are transmitted by gear train to an indicator/totalizer or
pulse transmitter.
There are inherently more leakage paths in this design and it
tends to be used where longer flow meter life is required rather
than high performance; however, close clearances between the
disc and chamber ensure minimum leakage for accurate and
repeatable measure of each volume cycle.
32
A disc attached to a sphere is mounted inside a
spherical chamber. As fluid flows through the
chamber, the disc and sphere unit nutates.
The nutation causes a pin, mounted on the
sphere perpendicular to the disc, to rock.
Each revolution of the pin indicates a fixed
volume of liquid has passed. A mechanical or
electromagnetic sensor detects the rocking of
the pin and the flow is measured.
Advantages of Nutating Disc Flow Meters:
May be constructed from a variety of materials.
High accuracy and repeatability.
Disadvantages of Nutating Disc Flow Meters:
Accuracy is adversely affected by viscosities
below the meter’s designated threshold.
33
ROTARY VANE METER
It comprises a casing containing a rotor assembly fitted with four
blades in opposing pairs, each pair being mounted on rigid
tubular rods. Above the rotor casing is bolted an inlet and outlet
manifold whilst a calibrating mechanism and direct-reading
mechanical counter are bolted on the front cover. The only moving
parts within the fluid being metered are the rotor and rotor blades,
which are constantly immersed. In operation, fluid enters the
meter through the inlet manifold and causes the rotor to revolve
in a clockwise direction by pressure on the blades. The proximity
of the rotor to the casing forms an efficient seal, whilst the profile
of the casing ensures that the blades are guided on to the
measuring crescent, where the combined effects of gravitational
and centrifugal forces cause a very efficient seal to be formed. An
extension shaft driving through a pressure-tight gland in the front
cover of the meter transmits the rotor revolutions through
calibrating gearing and thence to a counter or pulse generator for
remote indication. In the range, two basic categories of meter are
offered, one for general bulk metering in ranges 6.6–80, 12.3–15
and 17.7–230 m3, while for high-flow rate bunkering ranges 41.5–
415 m3/h and 83–830 m3/h are obtainable.
34
Reference has been made to a calibrating mechanism
interposed between the rotor shaft and readout counter.
The unit comprises a stepless friction wheel and disc, the
ratio being adjusted by means of a calibration screw. On
BM series meters one complete turn of the screw alters the
calibration by approximately 0.1% while similar rotation
on LBM meters alters the calibration by 0.23%. Thus,
calibration adjustment can be effected at any chosen flow
rate and this feature, coupled with an inherent
repeatability of ±0.01%, enables very accurate readings to
be taken.
35
Lobed Impeller Flow meter:
The schematic diagram of a lobed impeller flowmeter
are as shown in the figure. They may be used either for
gas or liquid flow measurements. The meter consists of
a working chamber containing two machined lobed
impellers, whose position is determined by gears fitted
on their respective shafts. The impellers are involute-
shaped so that they remain in contact with each other
Suppose the meter is used for gas measurements. The
gas enters the working chamber from the top and the
pressure of the gas causes the impellers to rotate. Each
complete revolution of an impeller necessitates its
passing through the vertical position twice and each
time a pocket of gas shown by hatched portion in figure
shown is trapped. Consequently volume of gas passed
for each revolution of the impellers is four times the
hatched portion multiplied by the axial length of the
impellers.
36
Q1) A gas (density = 0.8 kg/m3 ) flows through a 20 cm diameter pipe at the rate of 1000 m3 /h.
The flow is measured by a pitot tube located centrally in the pipe and connected to an inclined
manometer (inclination 12 in 1). It contains an oil of sp. gr. 0.85 as the manometric liquid. If the
average velocity of the gas is 0.8 of the maximum velocity, determine the manometric reading
for this flow.
Q2) A miniature pitot tube is used to measure the velocity of blood flow and a differential
pressure gauge records a pressure of 1 Torr (1 Torr = 1 mm of mercury pressure). If the density of
the blood is taken to be 1020 kg/m3 , calculate the blood velocity.
Q3) A rotameter has been calibrated in liter/min for water. It is to be used for metering brine
solution of sp. gr. 1.15. For this purpose, the density of the float has been changed from 2000
2250 kg/m3 without altering the shape and volume of the float. What correction factor should be
introduced in the original scale in order to use the rotameter for the brine solution
Practice Problems:
37

More Related Content

Similar to FLOW(NEW).pptx .

- VENTURI METER .docx
- VENTURI METER .docx- VENTURI METER .docx
- VENTURI METER .docxHogr kamal
 
flow of fluid and its mechanism along with principle
flow of fluid and its mechanism along with principleflow of fluid and its mechanism along with principle
flow of fluid and its mechanism along with principleAkankshaPatel55
 
Design Of Flow Meters
Design Of Flow MetersDesign Of Flow Meters
Design Of Flow MetersJaydeep Vakil
 
A Presentation on Field Instrumentation .pdf
A Presentation on Field Instrumentation .pdfA Presentation on Field Instrumentation .pdf
A Presentation on Field Instrumentation .pdfEmmanuelMatutu
 
Hydraulic Principles & Applications
Hydraulic Principles & ApplicationsHydraulic Principles & Applications
Hydraulic Principles & ApplicationsSahl Buhary
 
378994777-Pressure-Measurements.ppt lecture
378994777-Pressure-Measurements.ppt lecture378994777-Pressure-Measurements.ppt lecture
378994777-Pressure-Measurements.ppt lectureGeorgeGomez31
 
Basic equation of fluid flow mechan.pptx
Basic equation of fluid flow mechan.pptxBasic equation of fluid flow mechan.pptx
Basic equation of fluid flow mechan.pptxAjithPArun1
 
Flow measurement basics
Flow measurement basicsFlow measurement basics
Flow measurement basicsSalman1011
 
Volume flow rate_measurement
Volume flow rate_measurementVolume flow rate_measurement
Volume flow rate_measurementaparna kadam
 
ROLE OF CONTROL AND INSTRUMENTATION IN THERMAL POWER PLANT
ROLE OF CONTROL AND INSTRUMENTATION IN THERMAL POWER PLANTROLE OF CONTROL AND INSTRUMENTATION IN THERMAL POWER PLANT
ROLE OF CONTROL AND INSTRUMENTATION IN THERMAL POWER PLANTGaurav Rai
 
On Absorption Practice, Methods and Theory: An Empirical Example
On Absorption Practice, Methods and Theory: An Empirical Example On Absorption Practice, Methods and Theory: An Empirical Example
On Absorption Practice, Methods and Theory: An Empirical Example JosephLehmann4
 
measurement of the flow of fluid by the venturimeter and the pitot tube and ...
 measurement of the flow of fluid by the venturimeter and the pitot tube and ... measurement of the flow of fluid by the venturimeter and the pitot tube and ...
measurement of the flow of fluid by the venturimeter and the pitot tube and ...AshishBhadani4
 
Venturimeter (FLUID MECHANICS)
Venturimeter (FLUID MECHANICS)Venturimeter (FLUID MECHANICS)
Venturimeter (FLUID MECHANICS)45208120968
 

Similar to FLOW(NEW).pptx . (20)

- VENTURI METER .docx
- VENTURI METER .docx- VENTURI METER .docx
- VENTURI METER .docx
 
flow of fluid and its mechanism along with principle
flow of fluid and its mechanism along with principleflow of fluid and its mechanism along with principle
flow of fluid and its mechanism along with principle
 
Flow visualization
Flow visualizationFlow visualization
Flow visualization
 
Design Of Flow Meters
Design Of Flow MetersDesign Of Flow Meters
Design Of Flow Meters
 
exp.9 flow meter demonstration
exp.9 flow meter demonstrationexp.9 flow meter demonstration
exp.9 flow meter demonstration
 
A Presentation on Field Instrumentation.
A Presentation on Field Instrumentation.A Presentation on Field Instrumentation.
A Presentation on Field Instrumentation.
 
A Presentation on Field Instrumentation .pdf
A Presentation on Field Instrumentation .pdfA Presentation on Field Instrumentation .pdf
A Presentation on Field Instrumentation .pdf
 
Flow measurement part i
Flow measurement   part iFlow measurement   part i
Flow measurement part i
 
Hydraulic Principles & Applications
Hydraulic Principles & ApplicationsHydraulic Principles & Applications
Hydraulic Principles & Applications
 
378994777-Pressure-Measurements.ppt lecture
378994777-Pressure-Measurements.ppt lecture378994777-Pressure-Measurements.ppt lecture
378994777-Pressure-Measurements.ppt lecture
 
Qb103352
Qb103352Qb103352
Qb103352
 
Basic equation of fluid flow mechan.pptx
Basic equation of fluid flow mechan.pptxBasic equation of fluid flow mechan.pptx
Basic equation of fluid flow mechan.pptx
 
Flow measurement basics
Flow measurement basicsFlow measurement basics
Flow measurement basics
 
Volume flow rate_measurement
Volume flow rate_measurementVolume flow rate_measurement
Volume flow rate_measurement
 
ROLE OF CONTROL AND INSTRUMENTATION IN THERMAL POWER PLANT
ROLE OF CONTROL AND INSTRUMENTATION IN THERMAL POWER PLANTROLE OF CONTROL AND INSTRUMENTATION IN THERMAL POWER PLANT
ROLE OF CONTROL AND INSTRUMENTATION IN THERMAL POWER PLANT
 
FMHM-1.pptx
FMHM-1.pptxFMHM-1.pptx
FMHM-1.pptx
 
On Absorption Practice, Methods and Theory: An Empirical Example
On Absorption Practice, Methods and Theory: An Empirical Example On Absorption Practice, Methods and Theory: An Empirical Example
On Absorption Practice, Methods and Theory: An Empirical Example
 
measurement of the flow of fluid by the venturimeter and the pitot tube and ...
 measurement of the flow of fluid by the venturimeter and the pitot tube and ... measurement of the flow of fluid by the venturimeter and the pitot tube and ...
measurement of the flow of fluid by the venturimeter and the pitot tube and ...
 
Flow Measurement
Flow MeasurementFlow Measurement
Flow Measurement
 
Venturimeter (FLUID MECHANICS)
Venturimeter (FLUID MECHANICS)Venturimeter (FLUID MECHANICS)
Venturimeter (FLUID MECHANICS)
 

More from happycocoman

gas turbine cycles.pptx .
gas turbine cycles.pptx                    .gas turbine cycles.pptx                    .
gas turbine cycles.pptx .happycocoman
 
RECIPROCATING_AIR_COMPRESSOR.ppt .
RECIPROCATING_AIR_COMPRESSOR.ppt         .RECIPROCATING_AIR_COMPRESSOR.ppt         .
RECIPROCATING_AIR_COMPRESSOR.ppt .happycocoman
 
SURFACE TEXTURE 2022.pptx .
SURFACE TEXTURE 2022.pptx                  .SURFACE TEXTURE 2022.pptx                  .
SURFACE TEXTURE 2022.pptx .happycocoman
 
Numericals on Raciprocating air compressor.ppt
Numericals on  Raciprocating air compressor.pptNumericals on  Raciprocating air compressor.ppt
Numericals on Raciprocating air compressor.ppthappycocoman
 
Vapor_power cycles KM.pptx ..
Vapor_power cycles KM.pptx            ..Vapor_power cycles KM.pptx            ..
Vapor_power cycles KM.pptx ..happycocoman
 
Vapor power cycles by Anupama.pptx .
Vapor power cycles by Anupama.pptx     .Vapor power cycles by Anupama.pptx     .
Vapor power cycles by Anupama.pptx .happycocoman
 
Performance and Testing of Internal Combustion Engines.ppt
Performance and Testing of Internal Combustion Engines.pptPerformance and Testing of Internal Combustion Engines.ppt
Performance and Testing of Internal Combustion Engines.ppthappycocoman
 
ICenginesNumericals (1).pptx .
ICenginesNumericals (1).pptx             .ICenginesNumericals (1).pptx             .
ICenginesNumericals (1).pptx .happycocoman
 
Air standard cycles_PPT KM1.pptx .
Air standard cycles_PPT KM1.pptx          .Air standard cycles_PPT KM1.pptx          .
Air standard cycles_PPT KM1.pptx .happycocoman
 
Pressure Measurement ppt.pptx .
Pressure Measurement ppt.pptx               .Pressure Measurement ppt.pptx               .
Pressure Measurement ppt.pptx .happycocoman
 
Measurements & Measurement .Systems.pptx
Measurements & Measurement .Systems.pptxMeasurements & Measurement .Systems.pptx
Measurements & Measurement .Systems.pptxhappycocoman
 
Strain Measurement (NEW).pptx .
Strain Measurement (NEW).pptx               .Strain Measurement (NEW).pptx               .
Strain Measurement (NEW).pptx .happycocoman
 
Force and torque measurements.pptx .
Force and torque measurements.pptx      .Force and torque measurements.pptx      .
Force and torque measurements.pptx .happycocoman
 
Chapter 11 - SCREW THREADS sllides.pdf .
Chapter 11 - SCREW THREADS sllides.pdf       .Chapter 11 - SCREW THREADS sllides.pdf       .
Chapter 11 - SCREW THREADS sllides.pdf .happycocoman
 
Measurement of form errors.pptx .
Measurement of form errors.pptx            .Measurement of form errors.pptx            .
Measurement of form errors.pptx .happycocoman
 
9. Surface Texture - PPT.pdf .
9. Surface Texture - PPT.pdf               .9. Surface Texture - PPT.pdf               .
9. Surface Texture - PPT.pdf .happycocoman
 
10. Screw Threads - PPT.pdf .
10. Screw Threads - PPT.pdf                    .10. Screw Threads - PPT.pdf                    .
10. Screw Threads - PPT.pdf .happycocoman
 
Measurement of Form errors complete slides.pdf
Measurement of Form errors complete slides.pdfMeasurement of Form errors complete slides.pdf
Measurement of Form errors complete slides.pdfhappycocoman
 
Limits Fits and Tolerances ppt.pdf .
Limits Fits and Tolerances ppt.pdf     .Limits Fits and Tolerances ppt.pdf     .
Limits Fits and Tolerances ppt.pdf .happycocoman
 
Pressure Measurement ppt.pptx .
Pressure Measurement ppt.pptx             .Pressure Measurement ppt.pptx             .
Pressure Measurement ppt.pptx .happycocoman
 

More from happycocoman (20)

gas turbine cycles.pptx .
gas turbine cycles.pptx                    .gas turbine cycles.pptx                    .
gas turbine cycles.pptx .
 
RECIPROCATING_AIR_COMPRESSOR.ppt .
RECIPROCATING_AIR_COMPRESSOR.ppt         .RECIPROCATING_AIR_COMPRESSOR.ppt         .
RECIPROCATING_AIR_COMPRESSOR.ppt .
 
SURFACE TEXTURE 2022.pptx .
SURFACE TEXTURE 2022.pptx                  .SURFACE TEXTURE 2022.pptx                  .
SURFACE TEXTURE 2022.pptx .
 
Numericals on Raciprocating air compressor.ppt
Numericals on  Raciprocating air compressor.pptNumericals on  Raciprocating air compressor.ppt
Numericals on Raciprocating air compressor.ppt
 
Vapor_power cycles KM.pptx ..
Vapor_power cycles KM.pptx            ..Vapor_power cycles KM.pptx            ..
Vapor_power cycles KM.pptx ..
 
Vapor power cycles by Anupama.pptx .
Vapor power cycles by Anupama.pptx     .Vapor power cycles by Anupama.pptx     .
Vapor power cycles by Anupama.pptx .
 
Performance and Testing of Internal Combustion Engines.ppt
Performance and Testing of Internal Combustion Engines.pptPerformance and Testing of Internal Combustion Engines.ppt
Performance and Testing of Internal Combustion Engines.ppt
 
ICenginesNumericals (1).pptx .
ICenginesNumericals (1).pptx             .ICenginesNumericals (1).pptx             .
ICenginesNumericals (1).pptx .
 
Air standard cycles_PPT KM1.pptx .
Air standard cycles_PPT KM1.pptx          .Air standard cycles_PPT KM1.pptx          .
Air standard cycles_PPT KM1.pptx .
 
Pressure Measurement ppt.pptx .
Pressure Measurement ppt.pptx               .Pressure Measurement ppt.pptx               .
Pressure Measurement ppt.pptx .
 
Measurements & Measurement .Systems.pptx
Measurements & Measurement .Systems.pptxMeasurements & Measurement .Systems.pptx
Measurements & Measurement .Systems.pptx
 
Strain Measurement (NEW).pptx .
Strain Measurement (NEW).pptx               .Strain Measurement (NEW).pptx               .
Strain Measurement (NEW).pptx .
 
Force and torque measurements.pptx .
Force and torque measurements.pptx      .Force and torque measurements.pptx      .
Force and torque measurements.pptx .
 
Chapter 11 - SCREW THREADS sllides.pdf .
Chapter 11 - SCREW THREADS sllides.pdf       .Chapter 11 - SCREW THREADS sllides.pdf       .
Chapter 11 - SCREW THREADS sllides.pdf .
 
Measurement of form errors.pptx .
Measurement of form errors.pptx            .Measurement of form errors.pptx            .
Measurement of form errors.pptx .
 
9. Surface Texture - PPT.pdf .
9. Surface Texture - PPT.pdf               .9. Surface Texture - PPT.pdf               .
9. Surface Texture - PPT.pdf .
 
10. Screw Threads - PPT.pdf .
10. Screw Threads - PPT.pdf                    .10. Screw Threads - PPT.pdf                    .
10. Screw Threads - PPT.pdf .
 
Measurement of Form errors complete slides.pdf
Measurement of Form errors complete slides.pdfMeasurement of Form errors complete slides.pdf
Measurement of Form errors complete slides.pdf
 
Limits Fits and Tolerances ppt.pdf .
Limits Fits and Tolerances ppt.pdf     .Limits Fits and Tolerances ppt.pdf     .
Limits Fits and Tolerances ppt.pdf .
 
Pressure Measurement ppt.pptx .
Pressure Measurement ppt.pptx             .Pressure Measurement ppt.pptx             .
Pressure Measurement ppt.pptx .
 

Recently uploaded

INFLUENCE OF NANOSILICA ON THE PROPERTIES OF CONCRETE
INFLUENCE OF NANOSILICA ON THE PROPERTIES OF CONCRETEINFLUENCE OF NANOSILICA ON THE PROPERTIES OF CONCRETE
INFLUENCE OF NANOSILICA ON THE PROPERTIES OF CONCRETEroselinkalist12
 
Architect Hassan Khalil Portfolio for 2024
Architect Hassan Khalil Portfolio for 2024Architect Hassan Khalil Portfolio for 2024
Architect Hassan Khalil Portfolio for 2024hassan khalil
 
Biology for Computer Engineers Course Handout.pptx
Biology for Computer Engineers Course Handout.pptxBiology for Computer Engineers Course Handout.pptx
Biology for Computer Engineers Course Handout.pptxDeepakSakkari2
 
Software and Systems Engineering Standards: Verification and Validation of Sy...
Software and Systems Engineering Standards: Verification and Validation of Sy...Software and Systems Engineering Standards: Verification and Validation of Sy...
Software and Systems Engineering Standards: Verification and Validation of Sy...VICTOR MAESTRE RAMIREZ
 
CCS355 Neural Network & Deep Learning UNIT III notes and Question bank .pdf
CCS355 Neural Network & Deep Learning UNIT III notes and Question bank .pdfCCS355 Neural Network & Deep Learning UNIT III notes and Question bank .pdf
CCS355 Neural Network & Deep Learning UNIT III notes and Question bank .pdfAsst.prof M.Gokilavani
 
Current Transformer Drawing and GTP for MSETCL
Current Transformer Drawing and GTP for MSETCLCurrent Transformer Drawing and GTP for MSETCL
Current Transformer Drawing and GTP for MSETCLDeelipZope
 
Concrete Mix Design - IS 10262-2019 - .pptx
Concrete Mix Design - IS 10262-2019 - .pptxConcrete Mix Design - IS 10262-2019 - .pptx
Concrete Mix Design - IS 10262-2019 - .pptxKartikeyaDwivedi3
 
Heart Disease Prediction using machine learning.pptx
Heart Disease Prediction using machine learning.pptxHeart Disease Prediction using machine learning.pptx
Heart Disease Prediction using machine learning.pptxPoojaBan
 
What are the advantages and disadvantages of membrane structures.pptx
What are the advantages and disadvantages of membrane structures.pptxWhat are the advantages and disadvantages of membrane structures.pptx
What are the advantages and disadvantages of membrane structures.pptxwendy cai
 
complete construction, environmental and economics information of biomass com...
complete construction, environmental and economics information of biomass com...complete construction, environmental and economics information of biomass com...
complete construction, environmental and economics information of biomass com...asadnawaz62
 
IVE Industry Focused Event - Defence Sector 2024
IVE Industry Focused Event - Defence Sector 2024IVE Industry Focused Event - Defence Sector 2024
IVE Industry Focused Event - Defence Sector 2024Mark Billinghurst
 
Oxy acetylene welding presentation note.
Oxy acetylene welding presentation note.Oxy acetylene welding presentation note.
Oxy acetylene welding presentation note.eptoze12
 
OSVC_Meta-Data based Simulation Automation to overcome Verification Challenge...
OSVC_Meta-Data based Simulation Automation to overcome Verification Challenge...OSVC_Meta-Data based Simulation Automation to overcome Verification Challenge...
OSVC_Meta-Data based Simulation Automation to overcome Verification Challenge...Soham Mondal
 
Call Us ≽ 8377877756 ≼ Call Girls In Shastri Nagar (Delhi)
Call Us ≽ 8377877756 ≼ Call Girls In Shastri Nagar (Delhi)Call Us ≽ 8377877756 ≼ Call Girls In Shastri Nagar (Delhi)
Call Us ≽ 8377877756 ≼ Call Girls In Shastri Nagar (Delhi)dollysharma2066
 
Decoding Kotlin - Your guide to solving the mysterious in Kotlin.pptx
Decoding Kotlin - Your guide to solving the mysterious in Kotlin.pptxDecoding Kotlin - Your guide to solving the mysterious in Kotlin.pptx
Decoding Kotlin - Your guide to solving the mysterious in Kotlin.pptxJoão Esperancinha
 
Internship report on mechanical engineering
Internship report on mechanical engineeringInternship report on mechanical engineering
Internship report on mechanical engineeringmalavadedarshan25
 
VIP Call Girls Service Hitech City Hyderabad Call +91-8250192130
VIP Call Girls Service Hitech City Hyderabad Call +91-8250192130VIP Call Girls Service Hitech City Hyderabad Call +91-8250192130
VIP Call Girls Service Hitech City Hyderabad Call +91-8250192130Suhani Kapoor
 

Recently uploaded (20)

INFLUENCE OF NANOSILICA ON THE PROPERTIES OF CONCRETE
INFLUENCE OF NANOSILICA ON THE PROPERTIES OF CONCRETEINFLUENCE OF NANOSILICA ON THE PROPERTIES OF CONCRETE
INFLUENCE OF NANOSILICA ON THE PROPERTIES OF CONCRETE
 
Architect Hassan Khalil Portfolio for 2024
Architect Hassan Khalil Portfolio for 2024Architect Hassan Khalil Portfolio for 2024
Architect Hassan Khalil Portfolio for 2024
 
Biology for Computer Engineers Course Handout.pptx
Biology for Computer Engineers Course Handout.pptxBiology for Computer Engineers Course Handout.pptx
Biology for Computer Engineers Course Handout.pptx
 
Software and Systems Engineering Standards: Verification and Validation of Sy...
Software and Systems Engineering Standards: Verification and Validation of Sy...Software and Systems Engineering Standards: Verification and Validation of Sy...
Software and Systems Engineering Standards: Verification and Validation of Sy...
 
CCS355 Neural Network & Deep Learning UNIT III notes and Question bank .pdf
CCS355 Neural Network & Deep Learning UNIT III notes and Question bank .pdfCCS355 Neural Network & Deep Learning UNIT III notes and Question bank .pdf
CCS355 Neural Network & Deep Learning UNIT III notes and Question bank .pdf
 
Current Transformer Drawing and GTP for MSETCL
Current Transformer Drawing and GTP for MSETCLCurrent Transformer Drawing and GTP for MSETCL
Current Transformer Drawing and GTP for MSETCL
 
Concrete Mix Design - IS 10262-2019 - .pptx
Concrete Mix Design - IS 10262-2019 - .pptxConcrete Mix Design - IS 10262-2019 - .pptx
Concrete Mix Design - IS 10262-2019 - .pptx
 
Heart Disease Prediction using machine learning.pptx
Heart Disease Prediction using machine learning.pptxHeart Disease Prediction using machine learning.pptx
Heart Disease Prediction using machine learning.pptx
 
young call girls in Rajiv Chowk🔝 9953056974 🔝 Delhi escort Service
young call girls in Rajiv Chowk🔝 9953056974 🔝 Delhi escort Serviceyoung call girls in Rajiv Chowk🔝 9953056974 🔝 Delhi escort Service
young call girls in Rajiv Chowk🔝 9953056974 🔝 Delhi escort Service
 
What are the advantages and disadvantages of membrane structures.pptx
What are the advantages and disadvantages of membrane structures.pptxWhat are the advantages and disadvantages of membrane structures.pptx
What are the advantages and disadvantages of membrane structures.pptx
 
complete construction, environmental and economics information of biomass com...
complete construction, environmental and economics information of biomass com...complete construction, environmental and economics information of biomass com...
complete construction, environmental and economics information of biomass com...
 
IVE Industry Focused Event - Defence Sector 2024
IVE Industry Focused Event - Defence Sector 2024IVE Industry Focused Event - Defence Sector 2024
IVE Industry Focused Event - Defence Sector 2024
 
Oxy acetylene welding presentation note.
Oxy acetylene welding presentation note.Oxy acetylene welding presentation note.
Oxy acetylene welding presentation note.
 
OSVC_Meta-Data based Simulation Automation to overcome Verification Challenge...
OSVC_Meta-Data based Simulation Automation to overcome Verification Challenge...OSVC_Meta-Data based Simulation Automation to overcome Verification Challenge...
OSVC_Meta-Data based Simulation Automation to overcome Verification Challenge...
 
Call Us ≽ 8377877756 ≼ Call Girls In Shastri Nagar (Delhi)
Call Us ≽ 8377877756 ≼ Call Girls In Shastri Nagar (Delhi)Call Us ≽ 8377877756 ≼ Call Girls In Shastri Nagar (Delhi)
Call Us ≽ 8377877756 ≼ Call Girls In Shastri Nagar (Delhi)
 
Decoding Kotlin - Your guide to solving the mysterious in Kotlin.pptx
Decoding Kotlin - Your guide to solving the mysterious in Kotlin.pptxDecoding Kotlin - Your guide to solving the mysterious in Kotlin.pptx
Decoding Kotlin - Your guide to solving the mysterious in Kotlin.pptx
 
Internship report on mechanical engineering
Internship report on mechanical engineeringInternship report on mechanical engineering
Internship report on mechanical engineering
 
VIP Call Girls Service Hitech City Hyderabad Call +91-8250192130
VIP Call Girls Service Hitech City Hyderabad Call +91-8250192130VIP Call Girls Service Hitech City Hyderabad Call +91-8250192130
VIP Call Girls Service Hitech City Hyderabad Call +91-8250192130
 
Design and analysis of solar grass cutter.pdf
Design and analysis of solar grass cutter.pdfDesign and analysis of solar grass cutter.pdf
Design and analysis of solar grass cutter.pdf
 
young call girls in Green Park🔝 9953056974 🔝 escort Service
young call girls in Green Park🔝 9953056974 🔝 escort Serviceyoung call girls in Green Park🔝 9953056974 🔝 escort Service
young call girls in Green Park🔝 9953056974 🔝 escort Service
 

FLOW(NEW).pptx .

  • 2. In the physical world, mechanical engineers are frequently required to monitor or control the flow of various fluids through pipes, ducts and assorted vessels. This fluid can range from thick oils to light gasses. While some techniques work better with some groups of fluids, and less well with others, some are not at all suitable for some applications. In this primer on fluid flow instrumentation we will look at a wide variety of flow transducers and their application in the physical world. Introduction: 2
  • 3. FLOW MEASUREMENT has a history of about 3000 years. It has been studied only in the last 200 years and in the last 30 years all the new techniques have evolved. There is now a wide variety of methods available to measure the flow of liquids, solids, gases and vapours. There are three different flow quantities to be measured :- 1. The actual velocity of the fluid at a given point (measured in metres per second). 2. The volume rate of flow (measured in metres cubed per minute). 3. The mass flow rate (measured in kilograms per second). It is also possible to measure total flow which is the total volume or mass which has flowed in a set time period. 3
  • 4. Flow measurements application : 1. transportation of solids as slurries. 2. compressed natural gas in pipelines. 3. water and gas supply systems to domestic consumers. 4. irrigation systems and a number of industrial process control systems. The types of flows encountered is one or combination of the following types: 1. Clean or dirty/opaque. 2. wet or dry. 3. Hazardous/corrosive or safe. 4. Single-phase. 5. Two phase or multiphase. 6. laminar or transitional or turbulent. pressure may vary from vacuums to high pressures of many atmospheres, temperature may vary from cryogenic levels to hundreds of centigrade, and flow rate may be of miniscule type, i.e., few drops per minute or massive type involving thousands of litres per minute 4
  • 5. Flow meter is an instrument that is used to gauge the flow of gases or fluid through a pipe. Flow measurement applications differ extensively with respect to the conditional benchmarks, situational limitations, and engineering requirements. Flow meter has other names such as fluid meter, fluid sensor, flow sensor and flow gauge. They have a wide range of applications across different industries based on its basic function, which is to offer precise monitoring and measurement for flow of fluids or gases. 5
  • 6. The selection of flow measuring equipment depends primarily on…………. 1. The nature of the metered fluid and the demands of the associated plant. For example : an aircraft fuel meter require to be compact and must not be affected by the changes in orientation, but has to handle only clean and non-corrosive fluid. 2. Many industrial flow meters have to work with fluids which may be corrosive in nature or may contain foreign matters, but the equipment may be relatively large and of fixed type. 3. Various performance parameters like range, accuracy, repeatability, linearity, dynamic response, 4. Type of output like analog/digital, etc. 5. Functions to Indicate or record the rate of flow, total flow or may be both these quantities 6
  • 7. Flow measuring devices classification: 1. Primary devices or quantity meters. 2. Secondary devices known as rate meters. The distinction between the two is based on the character of the sensing element that interacts with the fluid flow. The output of the sensing element is then suitably modified so as to indicate or record the measured values. i. Quantity measurements, by mass or volume, are usually accomplished by counting successive isolated portions. ii. Rate measurements are inferred from effects of flow rates on pressure, force, heat transfer, flow area, etc. It is quite often possible to obtain the rate of flow from a quantity meter by a suitable choice of modifying elements. Further, it is important to note that the quantity meters are generally used for the calibration of rate meters. 7
  • 8. The most common principals for fluid flow metering are: 1. Differential Pressure Flow meters 2. Velocity Flow meters 3. Positive Displacement Flow meters 4. Mass Flow meters 5. Open Channel Flow meters 8
  • 9. Differential Pressure Flow Meters Differential pressure flow meters measure the differential pressure across an orifice where flow is directly related to the square root of the differential pressure produced. There are also primary and secondary elements in differential flow meters. The primary element produces change in kinetic energy using either flow nozzle, pitot tube, orifice plate, or venturi flow meters. The secondary element measures the differential pressure and provides the signal. 9
  • 10. 10
  • 11. ORIFICE METER: An orifice meter or an orifice plate, as illustrated in the figure, is a device that has been designed to measure the volumetric flow and mass flow rates of the fluid flowing within a pipe. Ironically, this instrument is actually a disk with a hole (an orifice) usually at its centre or sometimes placed eccentrically. Such a disk is simply introduced in pipe flanges facing the flow of any incoming fluid within a pipe. The fluid flowing through the pipe first experiences a convergence effect to enter through the orifice. However, the maximum convergence of the fluid does not occur exactly at the orifice point, but a little downstream from it. This positon is termed as vena contracta, where the area of cross section is minimum, the fluid velocity is maximum, and the pressure is minimum. Beyond the vena contracta point, the fluid flow again diverges steadily to reach the equilibrium. The velocity (v) of the fluid is determined by measuring the pressure difference between the flow at the vena contracta position and the normal flow. A manometer is connected to this set-up to measure the pressure difference. The obtained pressure values are used to derive the velocity of the flowing fluid using Bernoulli`s equation. 11
  • 12. 12
  • 13. (v1 2 )/2] + gh1 + (P1/ρ1) = [(v2 2 )/2] + gh2 + (P2/ρ2) Here, v1 and v2 refer to the velocity of the fluid at the normal flow and vena contracta positions, respectively; g is the acceleration due to gravity; h1 and h2 refer to the vertical distance of the normal flow and vena contracta positions, from the datum line, respectively; P1 and P2 refer to the pressure values at the normal flow and vena contracta positions, respectively; ρ1 and ρ2 are the fluid densities at the normal flow and vena contracta positions, respectively. 13
  • 14. In incompressible fluids, ρ1 = ρ2 = ρ. Assuming the pipe is horizontal, gh1 = gh2 The equation could be simplified as follows: (v2 2 – v1 2 )/2 = (P1 – P2)/ρ This equation can be further simplified by substituting v1 = Q/A1; v2 = Q/A2, where Q is the volumetric flow rate. Since A1 and A2 cannot be directly equated to the areas of pipe and vena contracta respectively, a coefficient of discharge (Cd) is introduced into the equation. Q = Cd [A2/√1 − ( 𝐴2 /𝐴1 ) 2 ] √ 2 (𝑃1−𝑃2) 𝜌 Further Q = K√𝛥𝑃 Here, K = Cd {A2 x 1.414/√𝜌[1 − ( 𝐴2/ 𝐴1 ) 2 ]} is a constant with respect to the application of the orifice meter. 14
  • 15. Example: The differential pressure across an orifice meter in an airline is measured by a simple water manometer. The manometer registers a differential head of 100mm water when the flow rate in the line is 10,000 m3 /hour of air at a density of 2 kg/m3 . A proposal is made to use the same installation to measure the rate of flow of water in the line, using mercury in place of water in the manometer. Estimate the difference in the levels of mercury on the two sides of manometer which would be obtained for a flow rate of 2,000 m3 /Hour of water. Assume that co- efficient of discharge remains the same & there is negligible compression of air. The density of mercury is 13.6 x10³ Kg/m3 . Let subscripts 1and 2 refer to air and water respectively. Differential pressure (P1 – P2)1 = g h1 (ρm – ρf) = 9.81 x 100 x 10-3 (1000 – 2) = 979 N / m2 The flow rate is given by, Q = {(Cd A2) / [√1 – (A2 / A1)2]} x √ (2/ρ) (P1 – P2) Therefore, Q1 / Q2 = [√ (2/ρ1) (P1 – P2)1] / [√ (2/ρ2) (P1 – P2)2] 10,000 / 2,000 = [√ (2/2) x 979] / [√ (2/1000) x (P1 – P2)2] (P1 – P2)2 = 19580 N / m2 Differential pressure in case of water with mercury manometer is, 19580 / [(13.6 – 1) x 9.81] = 158.4 mm of Hg 15
  • 16. The Pitot Tube: A pitot tube is a simple device meant for measuring the velocity of a liquid at any point. In its simple form the pitot tube consists of a glass tube whose lower end is bent at right angles (Fig). The device is placed in a moving liquid with the lower opening directed in the upstream direction. The liquid level in the pitot tube will depend on the velocity of the stream. The pitot tube in the form shown in the figure is meant for measuring the velocity at any point in a stream of liquid whose surface is open to the atmosphere. Let the inlet of the pitot tube be at depth H below the liquid surface. Consider the two points A and B. The point B is just at the inlet to the pitot tube while the point A is at the same level as that of B but at some distance from B. 16
  • 17. If the pitot tube is to be used to measure the velocity of a liquid in a pipe, then we must adopt some method to know the static pressure head H. For instance, we may use a pitot tube and a vertical piezometer tube and measure the difference of the liquid levels in the two tubes. See Fig. Another method is to connect the pitot tube and the piezometer tube and note the difference of liquid levels in the two tubes. See Fig. 17
  • 18. In another arrangement the pitot tube and vertical tube connected to the pipe may be connected to a U-tube containing a heavy liquid like mercury. See Fig. If the difference of level of the heavy liquid in the U-tube is y In the arrangements described above two openings are needed in the pipe wall. Moreover, the static pressure tap does not sense the pressure at the point where the stagnation pressure is measured. To overcome these difficulties the pitot-static tube (Fig.) is devised. 18
  • 19. Pitot static Tube: The pitot tube, illustrated in figure, is a device that is used to measure the local velocity and total pressure of a fluid, as against the velocity measured across the tube in case of an orifice plate and a venture meter. It finds extensive application in aircrafts. As illustrated in the figure, a pitot tube consists of an L shaped structure held upfront against the fluid flow. It consists of a static probe and an impact probe. The impact probe should face a direction that is against the fluid flow. While the static probe measures the static pressure in the system, the impact probe is meant to measure the total pressure of the system. When the fluid flows against the tip of the impact probe, it is brought to rest. This has an effect (rise) on the pressure (P2) corresponding to P1 at the static probe. Applying Bernoulli`s Theorem for an incompressible fluid, we get the following equation: (P2/ρ) = v2 2 + (P1/ρ) or velocity v = √ 2 𝜌 (𝑃2 − 𝑃1) 19
  • 20. Pitot tubes were invented by Henri Pitot in 1732 to measure the flowing velocity of fluids. Basically a differential pressure (d/p) flow meter, a pitot tube measures two pressures: the static and the total impact pressure. The static pressure is the operating pressure in the pipe, duct, or the environment, upstream to the pitot tube. It is measured at right angles to the flow direction, preferably in a low turbulence location (Figure) The total impact pressure (PT) is the sum of the static and kinetic pressures and is detected as the flowing stream impacts on the pitot opening. To measure impact pressure, most pitot tubes use a small, sometimes L-shaped tube, with the opening directly facing the oncoming flow stream. The point velocity of approach (VP) can be calculated by taking the square root of the dynamic pressure – which is the difference between total pressure (PT) and the static pressure (P) – and multiplying that by the C/D ratio, where C is a dimensional constant and D is density: VP = C(PT – P)1/2 / D 20
  • 21. When the flowrate is obtained by multiplying the point velocity (VP) by the cross-sectional area of the pipe or duct, it is critical that the velocity measurement be made at an insertion depth which corresponds to the average velocity. As the flow velocity rises, the velocity profile in the pipe changes from elongated (laminar) to more-flat (turbulent). This changes the point of average velocity and requires an adjustment of the insertion depth. Pitot tubes are recommended only for highly turbulent flows (Reynolds numbers > 20,000) and, under these conditions, the velocity profile tends to be flat enough so that the insertion depth is not critical. In 1797, G.B. Venturi developed a short tube with a throat-like passage that increases flow velocity and reduces the permanent pressure drop. Special pitot designs are available that, instead of providing just an impact hole for opening, add a single or double venturi to the impact opening of the pitot tube. The venturi version generates a higher differential pressure than does a regular pitot tube. 21
  • 22. Static Pressure Measurement In jacketed (dual-walled) pitot tube designs, the impact pressure port faces forward into the flow, while static ports are, instead, spaced around the outer tube. Both pressure signals (PT and P) are routed by tubing to a d/p indicator or transmitter. In industrial applications, the static pressure (P) can be measured in three ways: 1. Through taps in the pipe wall – pressure taps connect the tube to a manometer where the pressure differential is indicated. 2. By static probes inserted in the process stream. 3. By small openings located on the pitot tube itself or on a separate aerodynamic element. Wall taps can measure static pressures at flow velocities up to 200 ft/sec. A static probe (resembling an L- shaped pitot tube) can have four holes of 0.04 inches in diameter, spaced 90o apart. Aerodynamic bodies can be cylinders or wedges, with two or more sensing ports. Errors in detecting static pressure arise from fluid viscosity, velocity, and fluid compressibility. The key to accurate static pressure detection is to minimize the kinetic component in the pressure measurement. 22
  • 23. Example: A submarine moves horizontally in the sea and has its axis much below the surface of sea water. A pitot tube properly placed just in front of the submarine is connected to a differential pressure gauge. The pressure differential between the pitot pressure and static pressure was found to be 20 kN/m2 . Find the speed of the submarine if the density of sea water is 1026 kg/m3 . The pressure differential between the pitot pressure and static pressure, = 20 kN/m2 = 20 x 103 /(1026 x 9.81) = 1.987 m of sea water. This head is due to the velocity of fluid with respect to the submarine, i.e., due to the velocity of the submarine. V2 /2g = 1.987 V = √1.987 x 2 x 9.81 = 6.24 m/s 23
  • 24. Rotameter: Force Direction of force Type of force Weight (w) Downward Constant Buoyancy (b) Upward Constant Drag/ Blow force (d) Upward Variable Three forces act on the float. They are as follows.  Rotameter is a device which is used in chemical and related industries in order to measure the flow rate or average velocity of the flowing fluid.  Rotameter is a simple equipment which consists of a tapered tube and a float. The float is placed inside the tube and usually nets are placed at both the ends of the tube. This arrangement can be connected with a pipe line with flanged connections. Rotameters are always installed vertically in the pipelines. A scale is marked on the tube to read the values of flow rate directly. 24
  • 25. Rotameter Working:  When the fluid is not flowing then the float rests at the bottom of the rotameter. The fluid is made to pass through the rotameter such that the direction of flow of the fluid is parallel to the axis of the rotameter.  The flow of fluid through the rotameter causes the float to move along with the fluid. There are two primary forces involved, an upward drag force due to the motion of the fluid in upward direction and a downward force due to gravity which is due to the weight of the float itself. When these forces are balanced then the float moves to a particular location in the tube and it stays right there because it has achieved dynamic equilibrium.  In case it happens that the flow rate of fluid flowing through the rotameter is very high then it may happen that the float may get swept along with the fluid. The nets attached to either side of the rotameter ensure that the float does not get carried away in the pipe line. If it happens then it may get stuck near a valve in pipeline and cause blockage or enter equipment down the line and cause it to malfunction. A down side of net is that if the flow rate of flowing fluid is very high then the float will get stuck near the net and act as a blockage for the fluid flow, this may cause the flanges to get weakened and the liquid may start showering at the site of rupture. 25
  • 26. The force balance equation of the float is Fdrag + Fbuoyancy = Fweight Af (Pd – Pu) + ρff g Vf = ρf g Vf (Pd – Pu) = (Vf/Af) g (ρf - ρff) Where ρf and ρff are the densities of the float and floating fluid, respectively Vf is the volume of the float Pd and Pu are the pressure at the downward and upward faces of the float, respectively Now a kind of constriction is formed between the downward surface and upward surface of the float. Using equation, Q = Cd [A2/√1 − ( 𝐴2 𝐴1 ) 2 ] √ 2 (𝑃1−𝑃2) 𝜌 we get the volume rate of flow: Q = Cd [At (At – Af)/√(At)2 − (At – Af)2 ] √2𝑔 √(Pd – Pu)/ρff g Where At is the area of the tube at the float level, (At – Af) is the minimum annular area between tube and the float and Cd is the coefficient of discharge. Substituting the value of (Pd – Pu) from equation (Pd – Pu) = (Vf/Af) g (ρf - ρff) We get, Q = Cd [(At – Af)/√1 − (At – Af)2/(At )2] √2𝑔 √(Vf/Af) √(ρf - ρff)/ ρff If the variation of Cd with the float position is slight and if (At – Af)/At ˂ 1, then Q = 𝐾 √(ρf - ρff)/ ρff, Where K is the constant of the rotameter. 26
  • 27. Example: A rotameter is calibrated for metering a liquid of density 1000 kg/m3 and has a scale ranging from 1 to 100 liter/min. It is intended to use this meter for metering the flow of gas of density 1.25 kg/m3 with a flow range between 20 and 2000 liter/min. Determine the density of the new float, if the original one has the density of 2000 kg/m3 The shape and volume of both floats is assumed to be the same. Let the subscripts 1 and 2 refer to the liquid flow and gas flow, respectively, through the rotameter. Using the equation, Q = 𝐾 √(ρf - ρff)/ ρff, we get the actual discharge as: Q1 = K √(ρf1 - ρff1)/ ρff1 - for liquid flow Q2 = K √(ρf2 - ρff2)/ ρff2 - for gas flow Where K is the constant of the rotameter. The scale ratio between gas flow and liquid flow is, 20/1 = 2000/100 = 20 Therefore, Q2 = 20Q1 or Q2/Q1 = 20 Substituting the values of Q1 and Q2 from the rotameter discharge equation we get, Q2/Q1 = 20 = [(ρf2 - ρff2) ρff1/[(ρf1 - ρff1) ρff2] ^1/2 Substituting the values of ρf1, ρg1 and ρg2 and squaring we get, 400 = [(ρf2 – 1.25) x 1000]/ [(2000 – 1000) x 1.25 Simplifying the above expression we get, Ρf2 = density of float for gas flows = 501.25 kg/m3 27
  • 28. Important applications of rotameter  The rotameter is used in process industries.  It is used for monitoring gas and water flow in plants or labs.  It is used for monitoring filtration loading.  Applicable to a wide variety of gases and liquids  Flow range 0.04 L/h to 150 m3/h for water  Flow range 0.5 L/h to 3000 m3/h for air  Uncertainty 0.4% to 4% of maximum flow  Insensitivity to non-uniformity in the inflow (no upstream straight piping needed)  Typical maximum temperature 400°C  Typical maximum pressure 4 MPa (40 bar)  Low investment cost  Low installation cost 28
  • 29. Advantages of Rotameter:  It is simple to install and is easy and cheap to maintain.  It has a linear scale over large range of flow rates.  The pressure drop across the float is constant. Hence the pressure loss due to the float itself is quite small.  Rotameters are very versatile, they can be easily sized or their use can be changed for different systems. Disadvantages of Rotameter:  It requires a certain minimum magnitude of flow rate of fluid below which the float would fall and just stick to the rotameter.  If opaque fluid is used then the scale is not properly visible, it may cause misreading the meter.  It cannot be installed in a horizontal position.  If flow rate of fluid is very high then glass tubes may be subject to breakage. 29
  • 30. Positive Displacement Flowmeters A positive displacement flowmeter, commonly called a PD meter, measures the volume flow rate of a continuous flow stream by momentarily entrapping a segment of the fluid into a chamber of known volume and releasing that fluid back into the flow stream on the discharge side of the meter. By monitoring the number of entrapments for a known period of time or number of entrapments per unit time, the total volume of flow or the flow rate of the stream can be ascertained. The total volume and the flow rate can then be displayed locally or transmitted to a remote monitoring station. Advantages PD Meters 1. High-quality, high accuracy, a wide range, and are very reliable, insensitive to inlet flow profile distortions, low pressure drop across the meter. 2. Until the introduction of electronic correctors and flow controls on other types of meters, PD meters were most widely used in batch loading and dispensing applications. All mechanical units can be installed in remote locations. Dis-advantages PD Meters 1. Bulky, especially in the larger sizes. 2. The fluid must be clean for measurement accuracy and longevity of the meter. 3. More accurate PD meters are quite expensive. 4. Have high inertia of the moving parts; a sudden change in the flow rate can damage the meter. 5. Only for limited ranges of pressure and temperature 6. Most PD meters require a good maintenance schedule and are high repair and maintenance meters. 7. Recurring costs in maintaining a positive displacement flowmeter can be a significant factor in overall flowmeter cost. 30
  • 31. Industries: The industries where they are used in descending order are oil and gas, water and wastewater, chemical, power, pharmaceutical, food and beverage, pulp and paper, metals and mining and aerospace. Application Cautions for Positive Displacement Flowmeters: Avoid using positive displacement flowmeters in dirty fluids unless the dirt can be effectively removed upstream of the flowmeter. Operating these flowmeters in dirty fluids can cause plugging and increase maintenance costs. Be careful when selecting bearings because the non-lubricating nature of some fluids, impurities, and dirt can increase bearing wear and maintenance costs. Note that bearings usually do not necessarily fail catastrophically; they can slow down and adversely affect accuracy before they stop working. Avoid liquids with gas bubbles unless the bubbles can be effectively removed. As viscosity increases, be sure to ensure that the pressure drop across the flowmeter is acceptable. Make sure that the viscosity of the operating fluid is similar to that of the calibrated fluid, because the different amounts of slippage exhibited by different fluids can cause measurement error. 31
  • 32. Nutating Disc Flow Meters Working Principle Nutating disc flow meters are one of the most common types of positive displacement flow meter. They operate by having a disc mounted to a central ball. When fluid enters the chamber, it causes the disc to wobble (nutate), transferring the displaced volume to the register. Something to keep in mind, is that due to the nutating discs nature, the accuracy of this type of flow meter can be adversely affected by fluctuations in liquid viscosity Liquid enters a precision-machined chamber containing a disc which nutates (wobbles). The position of the disc divides the chamber into compartments containing an exact volume. Liquid pressure drives the disc to wobble and a roller cam causes the nutating disc to make a complete cycle. This motion is translated into rotary motion by means of a ball and shaft, which is attached to the disc. The movements of the disc are transmitted by gear train to an indicator/totalizer or pulse transmitter. There are inherently more leakage paths in this design and it tends to be used where longer flow meter life is required rather than high performance; however, close clearances between the disc and chamber ensure minimum leakage for accurate and repeatable measure of each volume cycle. 32
  • 33. A disc attached to a sphere is mounted inside a spherical chamber. As fluid flows through the chamber, the disc and sphere unit nutates. The nutation causes a pin, mounted on the sphere perpendicular to the disc, to rock. Each revolution of the pin indicates a fixed volume of liquid has passed. A mechanical or electromagnetic sensor detects the rocking of the pin and the flow is measured. Advantages of Nutating Disc Flow Meters: May be constructed from a variety of materials. High accuracy and repeatability. Disadvantages of Nutating Disc Flow Meters: Accuracy is adversely affected by viscosities below the meter’s designated threshold. 33
  • 34. ROTARY VANE METER It comprises a casing containing a rotor assembly fitted with four blades in opposing pairs, each pair being mounted on rigid tubular rods. Above the rotor casing is bolted an inlet and outlet manifold whilst a calibrating mechanism and direct-reading mechanical counter are bolted on the front cover. The only moving parts within the fluid being metered are the rotor and rotor blades, which are constantly immersed. In operation, fluid enters the meter through the inlet manifold and causes the rotor to revolve in a clockwise direction by pressure on the blades. The proximity of the rotor to the casing forms an efficient seal, whilst the profile of the casing ensures that the blades are guided on to the measuring crescent, where the combined effects of gravitational and centrifugal forces cause a very efficient seal to be formed. An extension shaft driving through a pressure-tight gland in the front cover of the meter transmits the rotor revolutions through calibrating gearing and thence to a counter or pulse generator for remote indication. In the range, two basic categories of meter are offered, one for general bulk metering in ranges 6.6–80, 12.3–15 and 17.7–230 m3, while for high-flow rate bunkering ranges 41.5– 415 m3/h and 83–830 m3/h are obtainable. 34
  • 35. Reference has been made to a calibrating mechanism interposed between the rotor shaft and readout counter. The unit comprises a stepless friction wheel and disc, the ratio being adjusted by means of a calibration screw. On BM series meters one complete turn of the screw alters the calibration by approximately 0.1% while similar rotation on LBM meters alters the calibration by 0.23%. Thus, calibration adjustment can be effected at any chosen flow rate and this feature, coupled with an inherent repeatability of ±0.01%, enables very accurate readings to be taken. 35
  • 36. Lobed Impeller Flow meter: The schematic diagram of a lobed impeller flowmeter are as shown in the figure. They may be used either for gas or liquid flow measurements. The meter consists of a working chamber containing two machined lobed impellers, whose position is determined by gears fitted on their respective shafts. The impellers are involute- shaped so that they remain in contact with each other Suppose the meter is used for gas measurements. The gas enters the working chamber from the top and the pressure of the gas causes the impellers to rotate. Each complete revolution of an impeller necessitates its passing through the vertical position twice and each time a pocket of gas shown by hatched portion in figure shown is trapped. Consequently volume of gas passed for each revolution of the impellers is four times the hatched portion multiplied by the axial length of the impellers. 36
  • 37. Q1) A gas (density = 0.8 kg/m3 ) flows through a 20 cm diameter pipe at the rate of 1000 m3 /h. The flow is measured by a pitot tube located centrally in the pipe and connected to an inclined manometer (inclination 12 in 1). It contains an oil of sp. gr. 0.85 as the manometric liquid. If the average velocity of the gas is 0.8 of the maximum velocity, determine the manometric reading for this flow. Q2) A miniature pitot tube is used to measure the velocity of blood flow and a differential pressure gauge records a pressure of 1 Torr (1 Torr = 1 mm of mercury pressure). If the density of the blood is taken to be 1020 kg/m3 , calculate the blood velocity. Q3) A rotameter has been calibrated in liter/min for water. It is to be used for metering brine solution of sp. gr. 1.15. For this purpose, the density of the float has been changed from 2000 2250 kg/m3 without altering the shape and volume of the float. What correction factor should be introduced in the original scale in order to use the rotameter for the brine solution Practice Problems: 37