Downloaded 1,738 times


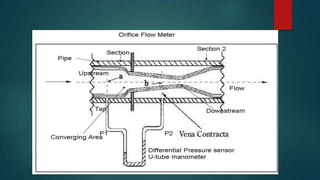

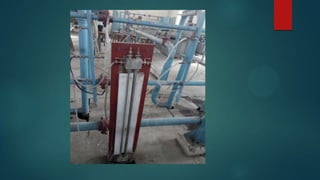
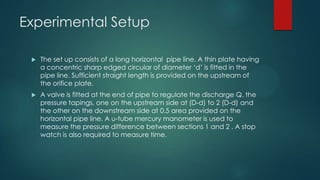
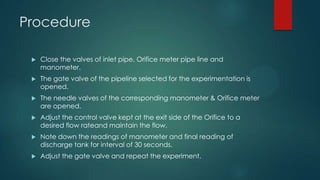


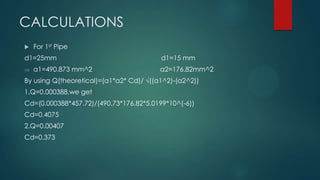


The document outlines the calibration and operation of an orifice meter, a device used to measure fluid discharge through pipes by creating a pressure difference. It details the setup, procedure, equations for discharge calculation, and experimental results, demonstrating how to determine the coefficient of discharge based on gathered data. Additionally, it discusses the advantages and disadvantages of the orifice meter compared to other devices, highlighting its space efficiency and higher friction losses.


