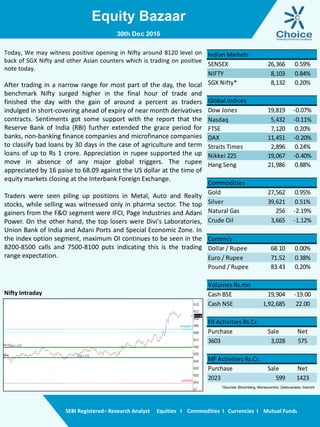
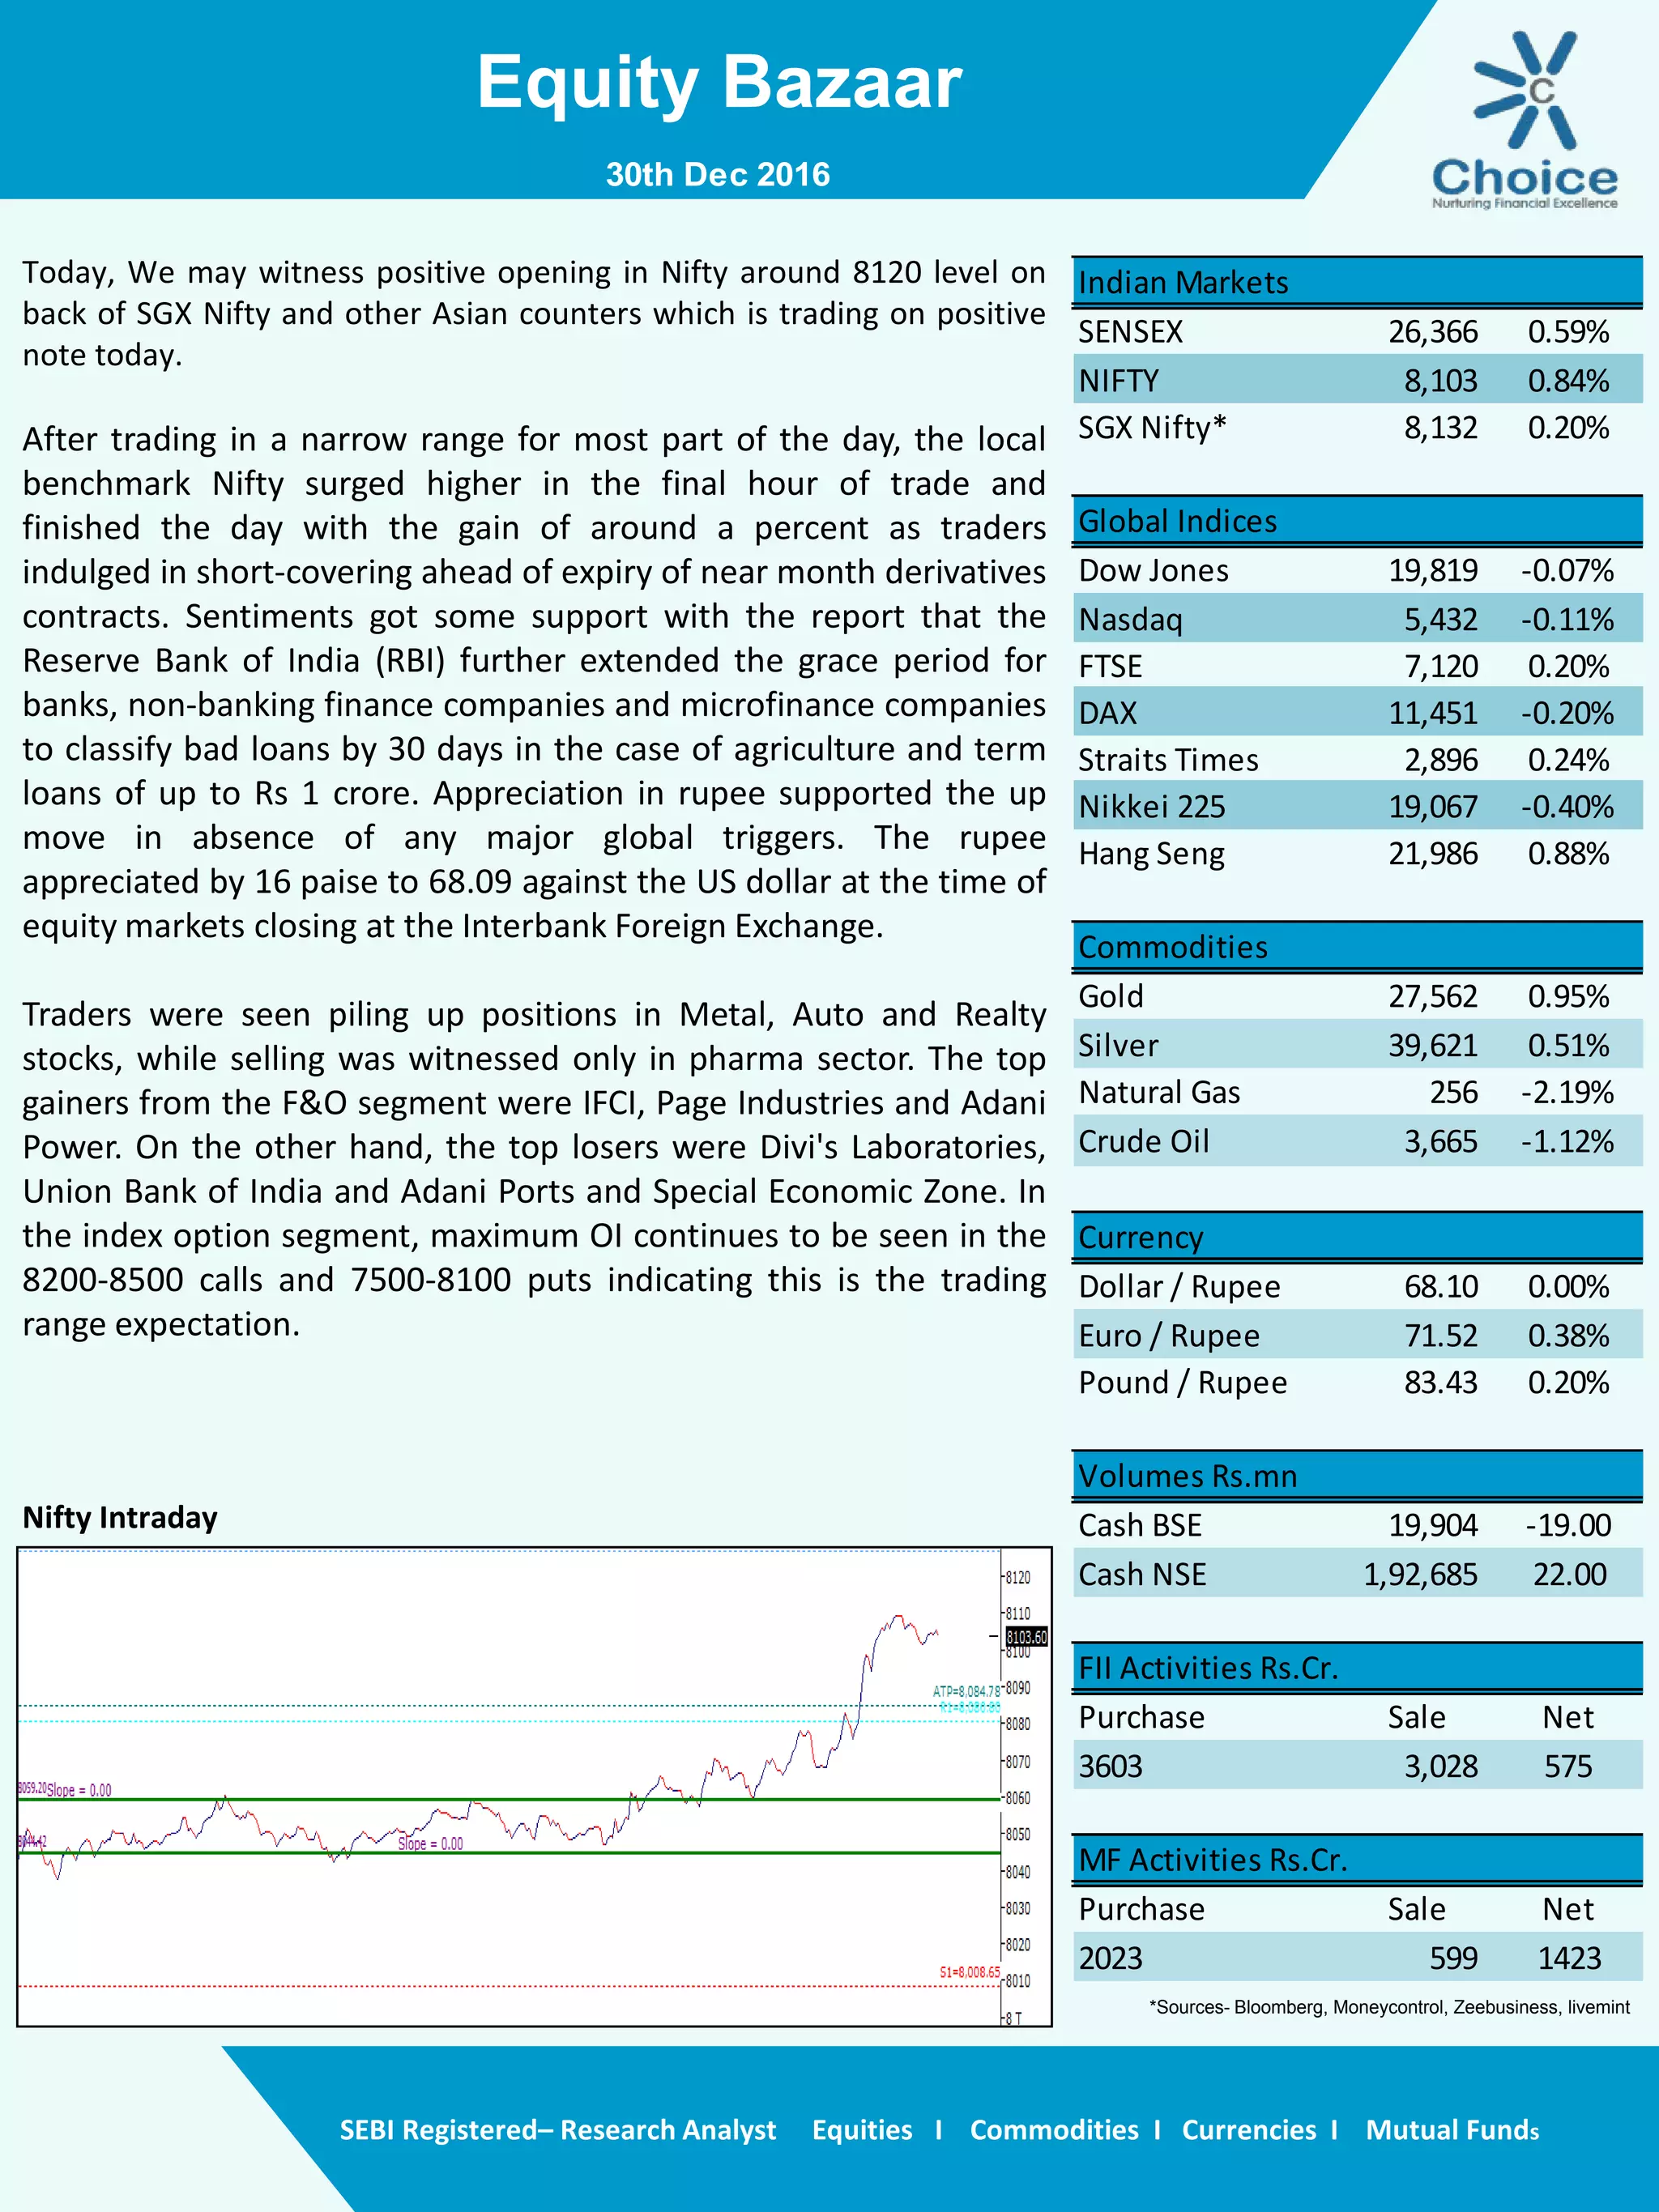
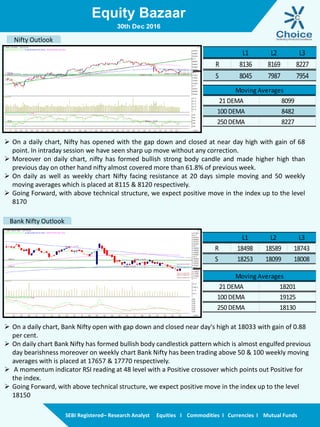
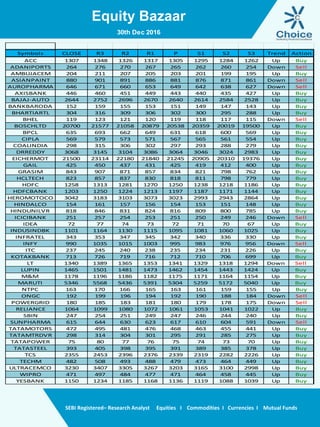
Call US 📞 9892124323 ✅ Kurla Call Girls In Kurla ( Mumbai ) secure service
Nifty Outlook and Technical Analysis
1. Equity Bazaar
SEBI Registered– Research Analyst Equities I Commodities I Currencies I Mutual Funds
Nifty Intraday
Today, We may witness positive opening in Nifty around 8120 level on
back of SGX Nifty and other Asian counters which is trading on positive
note today.
After trading in a narrow range for most part of the day, the local
benchmark Nifty surged higher in the final hour of trade and
finished the day with the gain of around a percent as traders
indulged in short-covering ahead of expiry of near month derivatives
contracts. Sentiments got some support with the report that the
Reserve Bank of India (RBI) further extended the grace period for
banks, non-banking finance companies and microfinance companies
to classify bad loans by 30 days in the case of agriculture and term
loans of up to Rs 1 crore. Appreciation in rupee supported the up
move in absence of any major global triggers. The rupee
appreciated by 16 paise to 68.09 against the US dollar at the time of
equity markets closing at the Interbank Foreign Exchange.
Traders were seen piling up positions in Metal, Auto and Realty
stocks, while selling was witnessed only in pharma sector. The top
gainers from the F&O segment were IFCI, Page Industries and Adani
Power. On the other hand, the top losers were Divi's Laboratories,
Union Bank of India and Adani Ports and Special Economic Zone. In
the index option segment, maximum OI continues to be seen in the
8200-8500 calls and 7500-8100 puts indicating this is the trading
range expectation.
30th Dec 2016
SENSEX 26,366 0.59%
NIFTY 8,103 0.84%
SGX Nifty* 8,132 0.20%
Global Indices
Dow Jones 19,819 -0.07%
Nasdaq 5,432 -0.11%
FTSE 7,120 0.20%
DAX 11,451 -0.20%
Straits Times 2,896 0.24%
Nikkei 225 19,067 -0.40%
Hang Seng 21,986 0.88%
Commodities
Gold 27,562 0.95%
Silver 39,621 0.51%
Natural Gas 256 -2.19%
Crude Oil 3,665 -1.12%
Currency
Dollar / Rupee 68.10 0.00%
Euro / Rupee 71.52 0.38%
Pound / Rupee 83.43 0.20%
Volumes Rs.mn
Cash BSE 19,904 -19.00
Cash NSE 1,92,685 22.00
FII Activities Rs.Cr.
Purchase Sale Net
3603 3,028 575
MF Activities Rs.Cr.
Purchase Sale Net
2023 599 1423
Indian Markets
*Sources- Bloomberg, Moneycontrol, Zeebusiness, livemint
2. Equity Bazaar
SEBI Registered– Research Analyst Equities I Commodities I Currencies I Mutual Funds
Nifty Outlook
Bank Nifty Outlook
30th Dec 2016
L1 L2 L3
R 8136 8169 8227
S 8045 7987 7954
21 DEMA 8099
100 DEMA 8482
250 DEMA 8227
Moving Averages
L1 L2 L3
R 18498 18589 18743
S 18253 18099 18008
21 DEMA 18201
100 DEMA 19125
250 DEMA 18130
Moving Averages
On a daily chart, Nifty has opened with the gap down and closed at near day high with gain of 68
point. In intraday session we have seen sharp up move without any correction.
Moreover on daily chart, nifty has formed bullish strong body candle and made higher high than
previous day on other hand nifty almost covered more than 61.8% of previous week.
On daily as well as weekly chart Nifty facing resistance at 20 days simple moving and 50 weekly
moving averages which is placed at 8115 & 8120 respectively.
Going Forward, with above technical structure, we expect positive move in the index up to the level
8170
On a daily chart, Bank Nifty open with gap down and closed near day's high at 18033 with gain of 0.88
per cent.
On daily chart Bank Nifty has formed bullish body candlestick pattern which is almost engulfed previous
day bearishness moreover on weekly chart Bank Nifty has been trading above 50 & 100 weekly moving
averages with is placed at 17657 & 17770 respectively.
A momentum indicator RSI reading at 48 level with a Positive crossover which points out Positive for
the index.
Going Forward, with above technical structure, we expect positive move in the index up to the level
18150
3. Equity Bazaar
SEBI Registered– Research Analyst Equities I Commodities I Currencies I Mutual Funds
30th Dec 2016
Symbols CLOSE R3 R2 R1 P S1 S2 S3 Trend Action
ACC 1307 1348 1326 1317 1305 1295 1284 1262 Up Buy
ADANIPORTS 264 276 270 267 265 262 260 254 Down Sell
AMBUJACEM 204 211 207 205 203 201 199 195 Up Buy
ASIANPAINT 880 901 891 886 881 876 871 861 Down Sell
AUROPHARMA 646 671 660 653 649 642 638 627 Down Sell
AXISBANK 446 460 451 449 443 440 435 427 Up Buy
BAJAJ-AUTO 2644 2752 2696 2670 2640 2614 2584 2528 Up Buy
BANKBARODA 152 159 155 153 151 149 147 143 Up Buy
BHARTIARTL 304 316 309 306 302 300 295 288 Up Buy
BHEL 119 123 121 120 119 118 117 115 Down Sell
BOSCHLTD 20700 21577 21058 20879 20538 20359 20019 19500 Up Buy
BPCL 635 693 662 649 631 618 600 569 Up Buy
CIPLA 569 579 573 571 567 565 561 554 Up Buy
COALINDIA 298 315 306 302 297 293 288 279 Up Buy
DRREDDY 3068 3145 3104 3086 3064 3046 3024 2983 Up Buy
EICHERMOT 21500 23114 22180 21840 21245 20905 20310 19376 Up Buy
GAIL 425 450 437 431 425 419 412 400 Up Buy
GRASIM 843 907 871 857 834 821 798 762 Up Buy
HCLTECH 823 857 837 830 818 811 798 779 Up Buy
HDFC 1258 1313 1281 1270 1250 1238 1218 1186 Up Buy
HDFCBANK 1203 1250 1224 1213 1197 1187 1171 1144 Up Buy
HEROMOTOCO 3042 3183 3103 3073 3023 2993 2943 2864 Up Buy
HINDALCO 154 161 157 156 154 153 151 148 Up Buy
HINDUNILVR 818 846 831 824 816 809 800 785 Up Buy
ICICIBANK 251 257 254 253 251 250 249 246 Down Sell
IDEA 72 77 74 73 72 71 70 67 Up Buy
INDUSINDBK 1101 1164 1130 1115 1095 1081 1060 1025 Up Buy
INFRATEL 343 353 347 345 342 340 336 330 Up Buy
INFY 990 1035 1015 1003 995 983 976 956 Down Sell
ITC 237 245 240 238 235 234 231 226 Up Buy
KOTAKBANK 713 726 719 716 712 710 706 699 Up Buy
LT 1340 1389 1365 1353 1341 1329 1318 1294 Down Sell
LUPIN 1465 1501 1481 1473 1462 1454 1443 1424 Up Buy
M&M 1178 1196 1186 1182 1175 1171 1164 1154 Up Buy
MARUTI 5346 5568 5436 5391 5304 5259 5172 5040 Up Buy
NTPC 163 170 166 165 163 161 159 155 Up Buy
ONGC 192 199 196 194 192 190 188 184 Down Sell
POWERGRID 180 185 183 181 180 179 178 175 Down Sell
RELIANCE 1064 1099 1080 1072 1061 1053 1041 1022 Up Buy
SBIN 247 254 251 249 247 246 244 240 Up Buy
SUNPHARMA 615 644 630 623 617 610 604 591 Down Sell
TATAMOTORS 472 495 481 476 468 463 455 441 Up Buy
TATAMTRDVR 298 314 304 301 295 291 285 275 Up Buy
TATAPOWER 75 80 77 76 75 74 73 70 Up Buy
TATASTEEL 393 405 398 395 391 389 385 378 Up Buy
TCS 2355 2453 2396 2376 2339 2319 2282 2226 Up Buy
TECHM 482 508 493 488 479 473 464 449 Up Buy
ULTRACEMCO 3230 3407 3305 3267 3203 3165 3100 2998 Up Buy
WIPRO 471 497 484 477 471 464 458 445 Up Buy
YESBANK 1150 1234 1185 1168 1136 1119 1088 1039 Up Buy
4. Equity Bazaar
SEBI Registered– Research Analyst Equities I Commodities I Currencies I Mutual Funds
Contact Us
www.choicebroking.in
Kkunal Parar
Sr. Research Associate
kkunal.parar@choiceindia.com
Vikas Chaudhari
Research Associate
vikas.chaudhari@choiceindia.com
www.choicebroking.incustomercare@choiceindia.com
Disclaimer
This is solely for information of clients of Choice Broking and does not construe to be an investment advice. It is also not intended as an offer or solicitation for the purchase and sale of any financial
instruments. Any action taken by you on the basis of the information contained herein is your responsibility alone and Choice Broking its subsidiaries or its employees or associates will not be liable in
any manner for the consequences of such action taken by you. We have exercised due diligence in checking the correctness and authenticity of the information contained in this recommendation, but
Choice Broking or any of its subsidiaries or associates or employees shall not be in any way responsible for any loss or damage that may arise to any person from any inadvertent error in the
information contained in this recommendation or any action taken on basis of this information. Technical analysis studies market psychology, price patterns and volume levels. It is used to forecast
future price and market movements. Technical analysis is complementary to fundamental analysis and news sources. The recommendations issued herewith might be contrary to recommendations
issued by Choice Broking in the company research undertaken as the recommendations stated in this report is derived purely from technical analysis. Choice Broking has based this document on
information obtained from sources it believes to be reliable but which it has not independently verified; Choice Broking makes no guarantee, representation or warranty and accepts no responsibility
or liability as to its accuracy or completeness. The opinions contained within the report are based upon publicly available information at the time of publication and are subject to change without
notice. The information and any disclosures provided herein are in summary form and have been prepared for informational purposes. The recommendations and suggested price levels are intended
purely for trading purposes. The recommendations are valid for the day of the report however trading trends and volumes might vary substantially on an intraday basis and the recommendations may
be subject to change. The information and any disclosures provided herein may be considered confidential. Any use, distribution, modification, copying, forwarding or disclosure by any person is
strictly prohibited. The information and any disclosures provided herein do not constitute a solicitation or offer to purchase or sell any security or other financial product or instrument. The current
performance may be unaudited. Past performance does not guarantee future returns. There can be no assurance that investments will achieve any targeted rates of return, and there is no guarantee
against the loss of your entire investment.
POTENTIAL CONFLICT OF INTEREST DISCLOSURE (as on date of report) Disclosure of interest statement – • Analyst interest of the stock /Instrument(s): - No. • Firm interest of the stock /
Instrument (s): - No.
Amit Pathania
Research Associate
amit.pathania@choiceindia.com
30th Dec 2016
Kapil Shah
Research Associate
kapil.shah@choiceindia.com
Kapil Shah
Digitally signed by Kapil Shah
DN: cn=Kapil Shah, o=Choice Equity Pvt Ltd,
ou=Research Team,
email=kapil.shah@choiceindia.com, c=US
Date: 2016.12.30 09:11:12 +05'30'