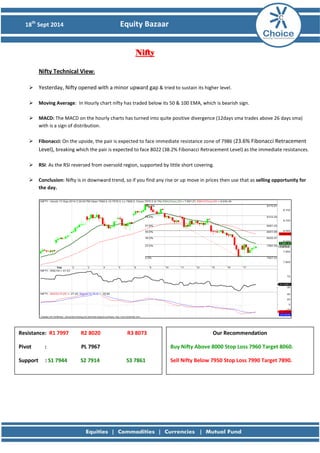
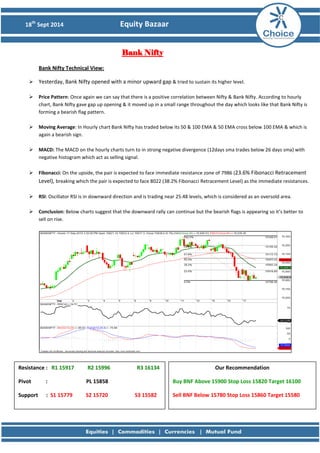
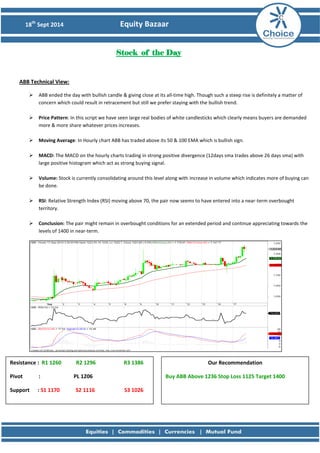
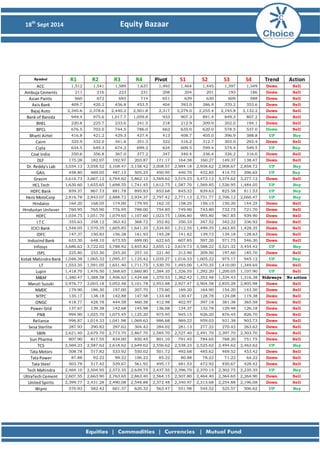
The document provides a technical analysis of the Nifty, Bank Nifty, and ABB stock from September 18th, 2014. It finds that the Nifty and Bank Nifty are in a downward trend based on indicators like the moving averages, MACD, and RSI. It recommends selling the Nifty below 7950 and the Bank Nifty below 15780. The analysis finds ABB to be in an upward trend based on positive divergences in the MACD and rising volume and recommends buying above 1236.
The document provides a technical analysis of the Nifty, Bank Nifty, and Tata Motors stock from September 17th, 2014. It finds that the indices are in a downward trend based on indicators such as moving averages, MACD, RSI, and stochastic signals. It recommends selling opportunities on rises in Nifty and Bank Nifty. For Tata Motors, it recommends selling below 498, citing oversold technical indicators.
The document provides a technical analysis of the Nifty, Bank Nifty, and Glenmark stock indexes and shares from October 14th, 2014. It notes that the Nifty opened with a gap down but recovered and closed higher, forming large real body green candles. It is analyzing support and resistance levels. For Bank Nifty, it examines moving averages and Fibonacci retracement levels. For Glenmark, it discusses a symmetrical triangle breakout. Recommendations are given to buy or sell depending on price movements and levels.
The document provides a technical analysis of the Indian stock market indices Nifty and Bank Nifty, and the stock Wipro, on September 26th, 2014. It summarizes that Nifty and Bank Nifty saw sharp selloffs and broke key support levels, signaling further declines. Technical indicators like MACD and RSI also show bearish momentum. Wipro is expected to decline further to test support at Rs. 560. Recommendations are given to buy or sell these securities based on technical breakouts of support and resistance levels.
The document provides a technical analysis of the Indian stock market index Nifty, the bank nifty index, and the stock ACC. For Nifty, it predicts short-term corrections may continue until 7750 levels. Bank Nifty is expected to see a pullback rally continue until 1600 if it sustains above its downtrend line. For ACC, rallies may continue until 1460 with buying on dips in the short term. It provides resistance and support levels for each, and buy/sell recommendations.
Daily Technical Trader - Qatar April 12, 2016QNB Group
The Index is back again in the ranging box
just above the 10,000 level. The Index
seems to be bouncing up on oil prices
while creating a Broadening formation.
Daily Technical Trader - KSA April 04, 2016QNB Group
The Index corrected further as we
expected and could continue with this
correction in the short term. Remaining
above the 6,000 is vital; the Index remains
in a short-term uptrend if it remains
above that level.
Daily Technical Trader - Qatar April 05, 2016QNB Group
Traded activity picked up yet the Index
remains in it trading range. At the current
formation, breaking below the 10,100
creates a Head and Shoulders reversal
pattern. It is a bearish pattern.
#ChoiceBroking #EquityBazaar - Today, We may witness mild positive opening in Nifty around 8610 level on back of SGX Nifty and other Asian counters which is trading on negative note today.
This document provides a daily technical analysis report on stocks and indices in Qatar. It includes commentary on the QSE Index and its movement, noting it added 2% and reached the daily 50SMA resistance area. Individual analyses are given for two stocks, SIIS and DBIS, with commentary on recent price action, expected resistance and support levels, and recommendations. Technical indicators like RSI and moving averages are referenced. Market activity indicators and index closing prices and movements are also summarized.
The market summary document provides an overview of the performance of key stock market indices and sectors in India on a given date. It summarizes that the indices opened flat but saw rising momentum over the day, closing near high levels. It also lists the top 5 gaining and losing stocks as well as the best and worst performing sectors for the day. Individual stocks are also analyzed with buy/sell recommendations given based on technical indicators.
The document provides a daily technical analysis of stocks traded on the Qatar Stock Exchange. It analyzes the performance of the QSE Index and several stocks. The key points are:
- The QSE Index gained 0.2% but market breadth was negative, suggesting the index may be running out of momentum. Support is seen at 12,400 and resistance at 12,600.
- Two stocks, GISS and MCGS are seen as potential short opportunities. GISS has fallen over 9% since late April and technical indicators suggest further downside to QR80-77.70. MCGS rose 30% since March and may correct to QR166-160.
- Technical indicators like MACD and R
QNBFS Daily Technical Trader - Qatar for October 17, 2017QNB Group
We have mentioned in previous reports that the Index is expected to recover (candlestick formation and positive divergence on the daily RSI vs the Index). There is another glimpse of hope; the Index broke above the downtrend channel in the short term (see intraday chart).
Daily Technical Trader - Qatar March 23, 2016QNB Group
This document provides a daily market summary and analysis of the Qatar stock market from QNBFS Research. It includes commentary on the movement of the QSE Index and expected support and resistance levels. It also provides stock recommendations and analysis for two stocks, IHGS and WDAM, noting price levels and technical indicators that suggest the stocks may be vulnerable to downward movement. Tables provide closing prices and technical indicators for indexes and numerous stocks traded on the Qatar exchange.
Daily Technical Trader - Qatar April 04, 2016QNB Group
Traded activity dropped even further in
the start of the week and the month for
that matter. The Index is at important
level and breaking below the 10,250 could
take us back to the 10,100 in the very
short term then 10,000 points.
This document provides a daily technical analysis of stocks on the Qatar Stock Exchange. It analyzes the performance of the QSE Index and two stocks, WDAM and VFQS. For each, it provides the current price, expected resistance and support levels, and a commentary on recent trends and outlook. Technical indicators like the RSI, moving averages and chart patterns are referenced to support the analysis. Market summary statistics for trading activity and index performance are also included.
The document provides a daily technical analysis and commentary on the Qatar Stock Exchange Index and the stock IQCD. It summarizes the previous day's market activity and performance of the index and IQCD. It identifies support and resistance levels and provides commentary on trends and potential price targets. Technical indicators like moving averages, Fibonacci levels, and candlestick patterns are analyzed to make recommendations on index and stock direction. Market breadth, volume and other indicators are also reviewed.
#ChoiceBroking #EquityBazaar - Today, We may witness flat opening in Nifty around 8710 level on back of SGX Nifty and other Asian counters which is trading on negative note today.
The document provides a daily technical analysis and outlook for the Nifty 50 and Bank Nifty stock indices based on their closing prices and technical indicators. It notes that the Nifty closed higher and broke out of a rising wedge pattern, suggesting further upside potential with resistance at 8,700 and support at 8,580. It also comments on movements in individual stocks and sectors. Bank Nifty faced resistance at 19,100 but defended earlier lows, indicating underlying strength, though some private banks outperformed while PSU banks saw profit-taking.
The document provides a technical analysis of the Nifty, Bank Nifty, and stock SRTEANSFIN from November 3rd, 2014. It notes that the indexes opened with gaps and gained throughout the day, with technical indicators like moving averages and MACD signaling continued uptrends. For Nifty, support is seen at 8225 and resistance at 8400. For Bank Nifty, support is at 16931 and resistance at 17273. SRTEANSFIN broke resistance and is recommended as a buy above 948 with a target of 980.
#ChoiceBroking #EquityBazaar - Today, We may gap up positive opening in Nifty around 7985 level on back of SGX Nifty and other Asian counters which is trading on positive note today.
The QSE Index rose 1% on the day, meeting resistance at the 50% Fibonacci retracement level from its February downtrend. The upcoming resistance is expected to be at 12,000, with support at 11,850. Two stocks, KCBK and QNCD, are highlighted for potential gains, with KCBK's target price at 20.60-20.90 QR and QNCD's at 123.40-125.00 QR if they break above resistance levels of 20.35 QR and 122.00 QR respectively. The document provides analysis and commentary on market indicators and stocks in the Qatari market.
#ChoiceBroking #EquityBazaar: Today, We may witness strong positive opening in Nifty around 7980 level on back of SGX Nifty and other Asian counters which is trading on positive note today.
The QSE Index fell 0.73% and closed at 11,669.62 points as it failed to sustain gains above the 11,760 resistance level. Two stocks are covered - ERES and QGTS. For ERES, a bounce is possible from current support levels near 19.00 due to a bullish candlestick pattern. The expected target price is 19.45-19.58 QR. For QGTS, the stock remains in an uptrend and the expected target price is 25.00-25.30 QR on a break above resistance at 24.50 QR. Intraday support and resistance levels along with moving averages are also provided for various stocks and indices.
QNBFS Daily Technical Trader - Qatar for January 18, 2018Aicha El-Mamy
The Index dropped slightly but it remains inside the short-term uptrend channel seen on both time frames. The bearish reversal tweezers-top formation has not been confirmed yet, and market participants remain uncertain on the current direction of the market around these levels. If the Index breaks above the 9,253, then expect an upswing. Otherwise, we may see further correction.
QNBFS Daily Technical Trader - Qatar for August 08, 2017QNB Group
The document provides a daily market summary and analysis of the Qatar Stock Exchange (QSE) Index and selected stocks. Some key points:
- The QSE Index stabilized after recent weakness but further declines are possible. Support is seen at 9,250 and resistance at 9,500.
- Trading activity increased significantly compared to the previous day.
- QIIK, a Shariah-compliant bank, has been trending up since June and may continue rising if participation increases, with resistance at 58.80-60.00 QR.
- Technical indicators are provided for the index and various sectors.
The document provides a daily technical analysis report on stocks traded on the Qatar stock exchange. It includes:
1) A summary of the day's trading activity on the QSE Index and performance of various sectors. The Index closed slightly down but near an important support level.
2) Analysis of two stocks, MARK and MCCS, including recent price movements, support/resistance levels, and outlook. The report recommends buy targets for MARK and sell targets for MCCS.
3) Tables with intraday Fibonacci support and resistance levels for various stocks and indices, along with their simple moving averages.
4) Definitions of technical analysis terms used in the report.
This document provides a daily technical analysis report on stocks traded on the Qatar stock exchange. It includes commentary on index levels and individual stocks, along with identifying potential support and resistance levels. Key points covered include:
- The QSE index opened lower but recovered most losses, remaining above important moving averages. Resistance is seen at 12,270 with support at 12,150.
- IQCD and MARK stocks are analyzed with potential price targets identified. Technical indicators show positive momentum for further price increases.
- Tables provide closing prices, intraday Fibonacci support/resistance levels, and moving average levels for various stocks and indexes.
- Gold and silver prices initially dropped but failed to sustain lower levels and rose, with gold forming a bullish pattern and silver a double bottom positive divergence, suggesting further upside.
- Most base metals also saw prices rise within defined ranges, with recommendations to buy copper, aluminum, nickel and zinc, and sell lead.
- Crude oil and natural gas rose but gains were capped by ample supply, with forecasts for further rises supported by declining inventories and expected cooler weather.
The document provides a technical analysis of gold, silver, and various base metals markets. It summarizes daily charts and technical indicators to identify key support and resistance levels. For gold and silver, it notes prices are near downtrend lines and momentum indicators suggest potential for higher prices. For copper, it finds prices have broken above resistance and may test higher levels. It also provides commentary on fundamental news affecting commodity prices and gives buy or neutral recommendations for various metals.
The document provides a technical analysis of trends in bullion and base metal prices on the MCX and COMEX exchanges.
For gold and silver on MCX, prices are consolidating near previous levels and outlook remains neutral to negative. On COMEX, gold faces resistance at 1195 USD and silver at 16.70 USD.
Among base metals, copper and lead prices are expected to drift lower while aluminum, nickel and zinc prices could rise. Crude oil prices are expected to fall further while natural gas prices may rise towards upper resistance levels. Pivot levels and recommendations are provided for different commodities.
The document provides a technical analysis of currency movements and economic indicators for the USDINR, EURINR, GBPINR, and JPYINR currency pairs. For each pair, it examines the price pattern, moving averages, momentum indicators, and concludes with a price forecast. It also includes a table of key economic data releases and their expected impact on the USD.
The document provides a technical analysis of several currency pairs including USDINR, EURINR, GBPINR, and JPYINR based on indicators like price patterns, moving averages, MACD, RSI, and ADX. It indicates bearish trends for USDINR, EURINR, and GBPINR, suggesting these currencies may continue to depreciate against the Indian rupee. The analysis also mentions upcoming economic data releases from the US and Eurozone that could impact the currencies. It concludes with disclosures about potential conflicts of interest.
Commodities call tracker From 17th to 28th Nov'14choice broking
This document contains a record of commodity call trades made between November 17th and 28th. It lists the date, lot size, type of call (buy/sell), commodity, initiated stop loss and target for 27 trades. It provides the results of each trade including prices achieved and profits/losses. The total profit for the period was 4075. It also notes some contact details for individuals at Choice Broking and includes standard disclosures around past performance and potential conflicts of interest.
The document provides a technical analysis of currency pairs USDINR, EURINR, GBPINR, and JPYINR against the Indian rupee. It analyzes short-term trends using indicators like moving averages, candlestick patterns, RSI, and ADX. Upward momentum is seen in most currency pairs from strong bullish candlestick patterns and indicators moving above key levels. Economic data from France, Germany, and Japan is also provided and may impact the respective currency pairs.
The document provides a technical analysis and recommendations for gold, silver, and other metals commodities trading on the MCX exchange in India. It finds that gold and silver prices remain in a bearish trend and are expected to drift lower. Copper prices may rise if they break above resistance at 412 levels. Crude oil prices are expected to remain under pressure and move lower. Natural gas prices could rise towards 268/270 levels. The analysis also provides pivot levels and recommendations to sell gold, silver, and crude oil futures contracts and buy aluminum, lead, nickel and natural gas contracts.
The document provides technical analysis and trading strategies for the Nifty 50, Bank Nifty, Bank of India stock, and various other stocks. It recommends buying positions in Nifty, Bank Nifty, and Bank of India based on indicators showing an upward trend and rising channel patterns. It also provides the day's highest Put and Call bases in Nifty futures and options and notes long and short buildups in various stocks.
The document provides a technical analysis of the Nifty, Bank Nifty, Ambuja Cements stock, and derivative markets from November 7th, 2014. It notes that Nifty and Bank Nifty opened flat but traded sideways, and recommends buy strategies for Nifty above 8400 and Bank Nifty above 17500. For Ambuja Cements, it recommends selling below 220 as technical indicators show weakness. Derivative analysis finds support at 8000 for Nifty and resistance at 8500.
The document provides a daily technical and fundamental analysis of currency pairs including USDINR, EURINR, GBPINR, and JPYINR. On the technical front, it analyzes price movements and momentum indicators for each currency pair. On the fundamental side, it outlines recent economic data and events affecting the valuations of each currency. It also provides buy and sell levels as well as details of upcoming economic indicators and their potential market impact.
The document provides a technical analysis of various currency pairs including USDINR, EURINR, GBPINR, and JPYINR. It finds that USDINR is in a sideways range ahead of important FOMC statements. EURINR and JPYINR remain in downtrends with no sign of reversal. GBPINR is in a strong sideways trend looking for a breakout. Technical indicators like moving averages, MACD, RSI, and ADX are analyzed for each pair. Economic data from the US, Eurozone, UK and Japan are also listed that could impact the pairs.
The document provides technical analysis and trading strategies for the Nifty 50, Bank Nifty, and M&M indexes and stocks. It recommends buying positions in these indexes and M&M with given entry and stop loss levels, targeting higher price levels. Additional commentary is provided on FII trading data, open interest in index options, and intraday option strategies based on support and resistance levels.
This document summarizes commodity call trading activity from October 1-15, 2014. It includes details of various buy and sell transactions carried out on different commodities like aluminum, lead, nickel, zinc, silver, etc. along with transaction sizes, initial prices, target prices, stop loss levels and results. The summary provides contact details of Choice India brokers and a disclaimer stating that this is only for information purposes and Choice India will not be responsible for any losses resulting from acting on this information.
The document provides a technical analysis of the Nifty, Bank Nifty, and stock of the day (SAIL). For Nifty, it notes the index closed near its bottom level and is in a sideways trend between support at 7968 and resistance at 8114. Most oscillators like MACD, Stochastic, and RSI are in oversold zones. For Bank Nifty, it provides a similar analysis noting a range between support and resistance levels. For SAIL, it recommends buying above 80.25 with a target of 83.3. In conclusion, the document performs technical analyses of indices and the stock of the day with recommendations.
The document provides a technical analysis of the Nifty, Bank Nifty, and Asian Paint stock from October 28th, 2014. It analyzes recent price movements and trends, technical indicators like moving averages and MACD, and provides buy/sell recommendations. Key levels of support and resistance are identified. Asian Paints is identified as the stock of the day and an ascending triangle pattern is observed on its hourly chart.
The document provides a technical analysis of the Nifty, Bank Nifty, and Ranbaxy stock from September 24th, 2014. It notes that Nifty broke below an important support level and is showing bearish technical indicators on hourly charts such as closing below moving averages. Bank Nifty also showed a sharp fall and bearish patterns. Ranbaxy is expected to continue its falling direction. Overall, the technical analysis indicates bearish trends for the indices and stock.
The document provides a technical analysis of the Nifty, Bank Nifty, and Ranbaxy stock from an Indian equity trading report dated September 24th, 2014. It summarizes that the indices have broken key support levels and technical indicators are signaling further downward movement. Specifically for Ranbaxy, it notes a bearish chart pattern and recommends selling the stock.
The document provides a technical analysis of the Nifty, Bank Nifty, Tata Steel stock, and derivatives. For Nifty, it notes a sharp bounce but sellers trying to dominate, and recommends buy positions above 8030 and sell below 7950. For Bank Nifty, it recommends buy above 15900 and sell below 15400. For Tata Steel, it recommends buy above 473 with a target of 520. It also provides support and resistance levels for various stocks and recommends overall bullish or bearish positions.
The document provides a technical analysis of the Nifty, Bank Nifty, and Crompton Greav stock. For Nifty, it notes that prices closed near the day's high after an initial drop and broke resistance. It recommends buying above 8470 with a target of 8600. For Bank Nifty, it observes consolidation between 17750 and 17480 and recommends buying above 17780 with a target of 18000. For Crompton Greav, it recommends buying above 195 based on a breakout from a downtrend and bullish candlestick pattern, with a target of 202.
The document provides a technical analysis of the Nifty, Bank Nifty, and Jubilant Food stock in India. It analyzes key indicators like price patterns, moving averages, MACD, and RSI to make recommendations. For Nifty, it recommends buying above 8030 and selling below 7880. For Bank Nifty, it recommends buying above 15400 and selling below 15000. For Jubilant Food, it recommends buying above 1288.
The document provides a technical analysis of the Nifty, Bank Nifty, and Ashok Leyland stock from an Indian equity research firm. It analyzes recent price movements and indicators like the MACD and RSI. It identifies support and resistance levels. Recommendations are given to buy or sell specific stocks depending on whether prices breach identified support or resistance levels.
The document provides a technical analysis of the Nifty, Bank Nifty, Tata Steel, and derivative markets from November 17, 2014. It notes that the Nifty opened lower on Friday but moved higher in the second half of trading, forming an indecisive candlestick pattern. Bank Nifty bounced from lower levels. Tata Steel gave a downtrend line breakout and sustained above resistance. It provides resistance and support levels and recommendations to buy or sell various securities.
The document provides a technical analysis of the Nifty, Bank Nifty, Dhanlaxmi Bank, and derivative markets from a daily report by Equity Bazaar on October 1st, 2014. It finds that Nifty and Bank Nifty are showing bearish signals on technical indicators like moving averages and MACD. Dhanlaxmi Bank is showing bullish signals and is recommended for buying. Option data suggests Nifty support at 7900 and resistance at 8100.
Epic research's daily derivative market report 25th november 2016.pdfEpic Research Limited
This was the biggest loss in a series for both the Sensex and Nifty since August 2013. Finally, the Sensex ended with a loss of 192 points at 25,860. The BSE Sensex opened at 26,049, touched an intra-day high of 26,049 and low of 25,810.
The document provides a technical analysis of the Nifty, Bank Nifty, and Havells stock from an 11th November 2014 report by Equity Bazaar. For Nifty, support is seen at 8300 and resistance at 8500. Bank Nifty faces support at 17179 and resistance at 17800. Havells is recommended to buy above 305 with support at 297 and resistance at 315/330.
The document provides a technical analysis of the Nifty, Bank Nifty, and stock Auropharma from November 5th, 2014. It finds that the Nifty and Bank Nifty are in uptrends based on moving average indicators and recommends buy positions. For Auropharma, it notes a downward resistance breakout and recommends a buy above 1013 with a target of 1080.
The market has kick-started in positive trend on Monday Nifty was up 46 points or 0.67 percent at 7468.75 The mixed trend seen In Europe and Asian markets. The Gain in the Indexes Followed on Europe Market and US Market that surge approx 1 per cent on last Friday after European Central Bank said to easing monetary policy in current fiscal,crude oil prices also rebounding.
The document provides a technical analysis of the Nifty, Bank Nifty, and Canara Bank indexes and stocks for October 31st, 2014. It finds that Nifty has strong support at 8088 levels and resistance at 8178 levels. Bank Nifty is moving in a sideways trend. Canara Bank is trading above key moving averages and support is seen at Rs. 382, with resistance at Rs. 405 if prices sustain above Rs. 390.
#ChoiceBroking #EquityBazaar- Today, We may witness flat opening in Nifty around 8577 level on back of SGX Nifty and other Asian counters which is trading on mixed note today.
The document provides a technical analysis of the Nifty 50 and Bank Nifty futures indexes. It notes that both indexes opened lower on Monday due to weak global cues. For Nifty, key support levels are seen at 7,700 and 7,600-7,516, while resistance is at 7,780-7,850. For Bank Nifty, support is at 16,300-16,100 and resistance at 16,500-16,750. The analysis also provides daily, weekly and monthly resistance and support levels for both indexes going forward as well as commentary on moving averages and parabolic SAR indicators.
QNBFS Daily Technical Trader - Qatar May 29, 2016QNB Group
The document provides a daily technical analysis report on the Qatar Stock Exchange (QSE) Index and the stock of Ooredoo (ORDS). It includes the following key points:
1) The QSE Index created an indecision candlestick and remains below the 9,800 resistance level, indicating bearish pressure may continue. Support is expected at 9,600.
2) ORDS stock price has created multiple lower tops and bottoms and moved below its 200-day simple moving average, suggesting bearish dominance. Price retreat to QR82.40-QR76.00 is expected if the stock breaches QR85.40 support.
3) The report provides other market data like index performance, volumes
The document provides a technical analysis of the Nifty, Bank Nifty, and CESC stocks. For Nifty, it notes the index opened positively but fell, and provides resistance and support levels. For Bank Nifty, it analyzes the candlestick pattern and moving averages, and gives levels. For CESC, it describes a bearish flag pattern and recommends selling below 705.
CNX NIFTY - The markets opened higher in trade on Monday, tracking positive trend seen in Asian markets after upbeat US jobs report on Friday suggested US Federal Reserve may go for interest rate hikes in nearly a decade in
its December policy meet.The Nifty50-share index was quoting 7,818.40, up 36.50 points. On Tuesday The market has
Equity Research Report 14 December 2015 Ways2Capital
Equity bazaar
1. 18th Sept 2014 Equity Bazaar
Nifty
Nifty Technical View:
Yesterday, Nifty opened with a minor upward gap & tried to sustain its higher level.
Moving Average: In Hourly chart nifty has traded below its 50 & 100 EMA, which is bearish sign.
MACD: The MACD on the hourly charts has turned into quite positive divergence (12days sma trades above 26 days sma) with is a sign of distribution.
Fibonacci: On the upside, the pair is expected to face immediate resistance zone of 7986 (23.6% Fibonacci Retracement Level), breaking which the pair is expected to face 8022 (38.2% Fibonacci Retracement Level) as the immediate resistances.
RSI: As the RSI reversed from oversold region, supported by little short covering.
Conclusion: Nifty is in downward trend, so if you find any rise or up move in prices then use that as selling opportunity for the day.
Resistance: R1 7997 R2 8020 R3 8073
Pivot : PL 7967
Support : S1 7944 S2 7914 S3 7861
Our Recommendation
Buy Nifty Above 8000 Stop Loss 7960 Target 8060.
Sell Nifty Below 7950 Stop Loss 7990 Target 7890.
2. 18th Sept 2014 Equity Bazaar
Bank Nifty
Bank Nifty Technical View:
Yesterday, Bank Nifty opened with a minor upward gap & tried to sustain its higher level.
Price Pattern: Once again we can say that there is a positive correlation between Nifty & Bank Nifty. According to hourly chart, Bank Nifty gave gap up opening & it moved up in a small range throughout the day which looks like that Bank Nifty is forming a bearish flag pattern.
Moving Average: In Hourly chart Bank Nifty has traded below its 50 & 100 EMA & 50 EMA cross below 100 EMA & which is again a bearish sign.
MACD: The MACD on the hourly charts turn to in strong negative divergence (12days sma trades below 26 days sma) with negative histogram which act as selling signal.
Fibonacci: On the upside, the pair is expected to face immediate resistance zone of 7986 (23.6% Fibonacci Retracement Level), breaking which the pair is expected to face 8022 (38.2% Fibonacci Retracement Level) as the immediate resistances.
RSI: Oscillator RSI is in downward direction and is trading near 25.48 levels, which is considered as an oversold area.
Conclusion: Below charts suggest that the downward rally can continue but the bearish flags is appearing so it’s better to sell on rise.
Resistance : R1 15917 R2 15996 R3 16134
Pivot : PL 15858
Support : S1 15779 S2 15720 S3 15582
Our Recommendation
Buy BNF Above 15900 Stop Loss 15820 Target 16100
Sell BNF Below 15780 Stop Loss 15860 Target 15580
3. 18th Sept 2014 Equity Bazaar
Stock of the Day
ABB Technical View:
ABB ended the day with bullish candle & giving close at its all-time high. Though such a steep rise is definitely a matter of concern which could result in retracement but still we prefer staying with the bullish trend.
Price Pattern: In this script we have seen large real bodies of white candlesticks which clearly means buyers are demanded more & more share whatever prices increases.
Moving Average: In Hourly chart ABB has traded above its 50 & 100 EMA which is bullish sign.
MACD: The MACD on the hourly charts trading in strong positive divergence (12days sma trades above 26 days sma) with large positive histogram which act as strong buying signal.
Volume: Stock is currently consolidating around this level along with increase in volume which indicates more of buying can be done.
RSI: Relative Strength Index (RSI) moving above 70, the pair now seems to have entered into a near-term overbought territory.
Conclusion: The pair might remain in overbought conditions for an extended period and continue appreciating towards the levels of 1400 in near-term.
Resistance : R1 1260 R2 1296 R3 1386
Pivot : PL 1206
Support : S1 1170 S2 1116 S3 1026
Our Recommendation
Buy ABB Above 1236 Stop Loss 1125 Target 1400
4. 18th Sept 2014 Equity Bazaar
Derivative Analysis FIIS Data: FII’s are the net buyers on 17 September 2014 is Rs 136.08 Lakhs and Dll’s are the net sellers on 17 September 2014 is Rs 169.19 Lakhs. Option Data: 8200 CE has the highest OI with 80 lakhs and 8100 CE has the second highest OI with 60 lakhs and 8000 PE has the highest OI with 69 lakhs and 7900 PE has the second highest OI with 59 lakhs. Open Interest: The above options data shows nifty has now a strong support at 8000 and resistance at 8200 the trend change level as per option data is 8100. Intraday Option Strategy: (A) Buy Nifty 8100 calls and Sell Nifty 8000 puts if buy level is breached (B) Sell Nifty 8100 calls and Buy Nifty 8000 puts if sell level is breached
7. 18th Sept 2014 Equity Bazaar
Disclaimer
This is solely for information of clients of Choice India and does not construe to be an investment advice. It is also not intended as an offer or solicitation for the purchase and sale of any financial instruments. Any action taken by you on the basis of the information contained herein is your responsibility alone and Choice India its subsidiaries or its employees or associates will not be liable in any manner for the consequences of such action taken by you. We have exercised due diligence in checking the correctness and authenticity of the information contained in this recommendation, but Choice India or any of its subsidiaries or associates or employees shall not be in any way responsible for any loss or damage that may arise to any person from any inadvertent error in the information contained in this recommendation or any action taken on basis of this information. Technical analysis studies market psychology, price patterns and volume levels. It is used to forecast future price and market movements. Technical analysis is complementary to fundamental analysis and news sources. The recommendations issued herewith might be contrary to recommendations issued by Choice India in the company research undertaken as the recommendations stated in this report is derived purely from technical analysis. Choice India has based this document on information obtained from sources it believes to be reliable but which it has not independently verified; Choice India makes no guarantee, representation or warranty and accepts no responsibility or liability as to its accuracy or completeness. The opinions contained within the report are based upon publicly available information at the time of publication and are subject to change without notice. The information and any disclosures provided herein are in summary form and have been prepared for informational purposes. The recommendations and suggested price levels are intended purely for trading purposes. The recommendations are valid for the day of the report however trading trends and volumes might vary substantially on an intraday basis and the recommendations may be subject to change. The information and any disclosures provided herein may be considered confidential. Any use, distribution, modification, copying, forwarding or disclosure by any person is strictly prohibited. The information and any disclosures provided herein do not constitute a solicitation or offer to purchase or sell any security or other financial product or instrument. The current performance may be unaudited. Past performance does not guarantee future returns. There can be no assurance that investments will achieve any targeted rates of return, and there is no guarantee against the loss of your entire investment.
POTENTIAL CONFLICT OF INTEREST DISCLOSURE (as on date of report) Disclosure of interest statement – • Analyst interest of the stock /Instrument(s): - No. • Firm interest of the stock / Instrument (s): - No.