SlideShare a Scribd company logo
1 of 14
Download to read offline
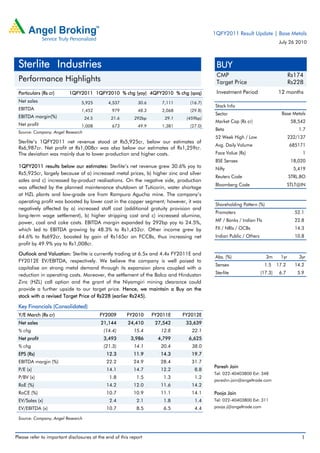
1QFY2011 Result Update | Base Metals
                                                                                                                             July 26 2010


 Sterlite Industries                                                                      BUY
                                                                                          CMP                                      Rs174
 Performance Highlights                                                                   Target Price                             Rs228


 Particulars (Rs cr)      1QFY2011 1QFY2010 % chg (yoy) 4QFY2010 % chg (qoq)              Investment Period                 12 months
 Net sales                      5,925         4,537         30.6      7,111     (16.7)
                                                                                          Stock Info
 EBITDA                         1,452           979         48.3      2,068     (29.8)
                                                                                          Sector                              Base Metals
 EBITDA margin(%)                  24.5        21.6        292bp       29.1    (459bp)
                                                                                          Market Cap (Rs cr)                        58,542
 Net profit                     1,008           673         49.9      1,381     (27.0)
                                                                                          Beta                                         1.7
 Source: Company, Angel Research
                                                                                          52 Week High / Low                       232/137
 Sterlite’s 1QFY2011 net revenue stood at Rs5,925cr, below our estimates of
                                                                                          Avg. Daily Volume                        685171
 Rs6,987cr. Net profit at Rs1,008cr was also below our estimates of Rs1,259cr.
 The deviation was mainly due to lower production and higher costs.                       Face Value (Rs)                               1
                                                                                          BSE Sensex                                18,020
 1QFY2011 results below our estimates: Sterlite’s net revenue grew 30.6% yoy to           Nifty                                      5,419
 Rs5,925cr, largely because of a) increased metal prices, b) higher zinc and silver
                                                                                          Reuters Code                             STRL.BO
 sales and c) increased by-product realisations. On the negative side, production
                                                                                          Bloomberg Code                           STLT@IN
 was affected by the planned maintenance shutdown at Tuticorin, water shortage
 at HZL plants and low-grade ore from Rampura Agucha mine. The company’s
 operating profit was boosted by lower cost in the copper segment; however, it was
                                                                                          Shareholding Pattern (%)
 negatively affected by a) increased staff cost (additional gratuity provision and
                                                                                          Promoters                                  52.1
 long-term wage settlement), b) higher stripping cost and c) increased alumina,
 power, coal and coke costs. EBITDA margin expanded by 292bp yoy to 24.5%,                MF / Banks / Indian Fls                    22.8
 which led to EBITDA growing by 48.3% to Rs1,452cr. Other income grew by                  FII / NRIs / OCBs                          14.3
 64.6% to Rs692cr, boosted by gain of Rs165cr on FCCBs, thus increasing net               Indian Public / Others                     10.8
 profit by 49.9% yoy to Rs1,008cr.
 Outlook and Valuation: Sterlite is currently trading at 6.5x and 4.4x FY2011E and
                                                                                          Abs. (%)                   3m      1yr       3yr
 FY2012E EV/EBITDA, respectively. We believe the company is well poised to
                                                                                          Sensex                    1.5     17.2     14.2
 capitalise on strong metal demand through its expansion plans coupled with a
 reduction in operating costs. Moreover, the settlement of the Balco and Hindustan        Sterlite                 (17.3)    6.7      5.9
 Zinc (HZL) call option and the grant of the Niyamgiri mining clearance could
 provide a further upside to our target price. Hence, we maintain a Buy on the
 stock with a revised Target Price of Rs228 (earlier Rs245).

 Key Financials (Consolidated)
 Y/E March (Rs cr)                        FY2009       FY2010      FY2011E    FY2012E
 Net sales                                21,144       24,410       27,542     33,639
 % chg                                     (14.4)         15.4        12.8       22.1
 Net profit                                3,493         3,986       4,799      6,625
 % chg                                     (21.3)         14.1        20.4       38.0
 EPS (Rs)                                    12.3         11.9        14.3       19.7
 EBITDA margin (%)                           22.2         24.9        28.4       31.7
                                                                                         Paresh Jain
 P/E (x)                                     14.1         14.7        12.2        8.8
                                                                                         Tel: 022-40403800 Ext: 348
 P/BV (x)                                     1.8           1.5        1.3        1.2
                                                                                         pareshn.jain@angeltrade.com
 RoE (%)                                     14.2         12.0        11.6       14.2
 RoCE (%)                                    10.7         10.9        11.1       14.1    Pooja Jain
 EV/Sales (x)                                 2.4           2.1        1.8        1.4    Tel: 022-40403800 Ext: 311
 EV/EBITDA (x)                               10.7           8.5        6.5        4.4    pooja.j@angeltrade.com

 Source: Company, Angel Research


Please refer to important disclosures at the end of this report                                                                         1
Sterlite Industries | 1QFY2011 Result Update


               Exhibit 1: 1QFY2011 performance (Consolidated)
               Y/E March (Rs cr)                 1QFY11 1QFY10 % chg        FY10       FY09 % chg
               Net Sales                          5,925   4,537     30.6   24,410   21,144       15.4
               Consumption of raw
                                                  2,679   2,116     26.6   12,169   10,634       14.4
               material
               (% of net sales)                    45.2    46.6              49.9       50.3
               Power & fuel                         558    467      19.6    1,953      2,132     (8.4)
               (% of net sales)                     9.4    10.3               8.0       10.1
               Staff costs                          284    173      63.9     854        756      12.9
               (% of net sales)                     4.8     3.8               3.5        3.6
               Other expenses                       952    802      18.6    3,363      2,918     15.2
               (% of net sales)                    16.1    17.7              13.8       13.8
               Total expenditure                  4,473   3,558     25.7   18,339   16,440       11.5
               (% of net sales)                    75.5    78.4              75.1       77.8
               EBITDA                             1,452    979      48.3    6,072      4,704     29.1
               EBITDA margin (%)                   24.5    21.6              24.9       22.2
               Interest                             141     71      97.8     342        397 (13.8)
               Depreciation                         217    174      25.0     750        701       7.0
               Other income +
                                                    737    420      75.5    1,959      2,154     (9.0)
               operating income
               Exceptional items                      0      0              (297)        55
               Profit before tax                  1,831   1,154     58.6    6,642      5,816     14.2
               (% of net sales)                    30.9    25.4              27.2       27.5
               Tax                                  368    230      59.9    1,233       855      44.2
               (% of PBT)                           6.2     5.1               5.1        4.0
               Profit after tax                   1,462    924      58.3    5,409      4,961      9.0
               Net income                         1,008    673      49.9    3,744      3,540      5.8
               (% of net sales)                    17.0    14.8              15.3       16.7
               FDEPS (Rs)                           2.8     8.0 (64.7)       11.9       12.3     (3.8)
               Source: Company, Angel Research


               Exhibit 2: 1QFY2011 - Actual vs. Angel estimates
               (Rs cr)                                            Actual    Estimates Variation (%)
               Net sales                                          5,925        6,987            (15.2)
               EBITDA                                             1,452        2,103            (31.0)
               EBITDA margins (%)                                  24.5         30.1           (560bp)
               PBT                                                1,831        2,293            (20.2)
               PAT                                                1,008        1,259            (19.9)
               Source: Company, Angel Research


July 26 2010                                                                                         2
Sterlite Industries | 1QFY2011 Result Update


               Key conference call takeaways

               Details of Vedanta Aluminium (VAL) financing: The total investment required in
               VAL is about Rs26,500cr, of which Rs13,400cr is through long-term debt and
               Rs13,100cr is via equity. Equity financing would be in the ratio of 70:30 for
               Vedanta PLC and Sterlite (which means that Sterlite’s equity contribution would be
               Rs4,000cr). However, Sterlite has infused nearly Rs6,500cr in VAL till date
               (Rs3,000cr as equity and Rs3,500cr as debt at a market interest rate). During the
               quarter, VAL produced 203ktpa of alumina and reported EBITDA of Rs140cr.

               PPA not singed for VAL: Sterlite Energy has secured coal linkages for the 2,400MW
               power plant at Jharsuguda with Coal India. Sterlite Energy has also entered into a
               long-term PPA with GridCo at Rs2.5/unit, but it is yet to finalise the PPA agreement
               with VAL. Management has indicated that the power would be sold to VAL at a
               price similar to that of Grid Co.

               Venturing into the port business: Sterlite has entered the port business to develop a
               coal berth at Vizag on a revenue-sharing basis in a joint venture (JV) with Leighton
               Contractors (26% share). The agreement has been signed with Vizag Port
               Authorities and the estimated cost of the project is Rs500cr, which is likely to be
               completed in mid-2012. The JV company has also been awarded the Paradeep
               Port project for the development of multipurpose berth, the estimated cost of which
               is Rs400cr.

               Clearance for Niyamgiri mine still awaited: Management indicated that it has
               submitted all the necessary documents required for availing forest clearance. On
               receipt of all the clearances, the company would take 3–6 months to start bauxite
               production. The mine has reserves of nearly 70mn–80mn tonnes, and the area
               holds potential for further exploration. In addition, the company is in dialogue with
               the government for allocation of new blocks.

               Balco and HZL minority stake buyout still awaited: Management indicated that
               Balco’s arbitration process is in its final stages, with the last round of arbitration in
               August 2010. However, it did not specify the time for HZL’s buyout but indicated
               that it has entered into a mediation process. Sterlite has sufficient cash on books
               (Rs24,874cr) towards these buyouts.

               Cost of production: During 1QFY2011, the cost of producing aluminium at Balco
               and VAL was Rs83,000/tonne and Rs86,000/tonne, respectively. The cash cost at
               HZL excluding royalty was Rs38,900/tonne. On account of higher stripping ratio,
               cost of production at HZL has increased by US $15/tonne


July 26 2010                                                                                          3
Sterlite Industries | 1QFY2011 Result Update


               1QFY2011 result highlights

               In 1QFY2011, Sterlite’s net revenue increased by 30.6% yoy to Rs5,925cr, largely
               because of a) increased metal prices, b) higher zinc and silver sales and
               c) increased by-product realisations. On the negative side, production was affected
               by the planned maintenance shutdown at Tuticorin, water shortage at HZL plants
               and low-grade ore from Rampura Agucha mine. During the quarter, the company
               also sold 480mn units of merchant power (287mn units in 1QFY2010) due to the
               closure of the Balco 1 plant. Average power realisation was lower at Rs4.98/unit
               (Rs5.43/unit in 1QFY2010).

               The company’s operating profit was boosted by lower cost in the copper segment;
               however, it was negatively affected by a) increased staff cost (additional gratuity
               provision and long-term wage settlement), b) higher stripping cost and
               c) increased alumina, power, coal and coke costs. EBITDA margin expanded by
               292bp yoy to 24.5%, which led to EBITDA growing by 48.3% to Rs1,452cr. Other
               income grew by 64.6% to Rs692cr, boosted by gain of Rs165cr on FCCBs, thus
               increasing net profit by 49.9% yoy to Rs1,008cr.

               Segmental performance

               Copper segment was better placed in 1QFY2011

               Copper cathode production during 1QFY2011 was flat at 77,000 tonnes due to a
               planned maintenance shutdown at Tuticorin smelter. Mined metal from the
               Australian mine was 7,000 tonnes during the quarter. Revenue for the segment
               was Rs2,096cr, up 33.5% yoy, mainly led by higher metal prices. Moreover, owing
               to an improvement in copper TC/RC margins, which increased to 13.5 per USc/lb
               (11.9 per USc/lb) along with improved copper recoveries and higher byproduct
               realisations, the copper segment’s EBIT reported 100% yoy growth. Average acid
               realisation during 1QFY2011 improved to Rs3,332/tonne as compared to
               Rs227/tonne in 1QFY2010. From 2QFY2011E, management expects acid
               realisations to be around Rs2000/tonne.

               Exhibit 3: Copper EBIT margins expanded by 214bp yoy

                          250                                                             7
                                                                                          6
                          200
                                                                                          5
                          150                                                             4
                (Rs cr)


                                                                                              (%)


                          100                                                             3
                                                                                          2
                           50
                                                                                          1
                            0                                                             0
                                1QFY10    2QFY10       3QFY10     4QFY10       1QFY11
                                          EBIT (LHS)      EBIT margins (RHS)

               Source: Company, Angel Research


July 26 2010                                                                                        4
Sterlite Industries | 1QFY2011 Result Update


               Poor performance by the aluminium business

               Balco’s aluminium production was down 12% yoy to 63,000 tonnes, whereas
               production at VAL was up by 45% at 77,000 tonnes. The aluminium segment’s
               revenue, at Rs666cr, was up 8.3% yoy. However, profitability was affected by
               a) increased alumina costs, b) higher power cost, c) additional gratuity provisions
               and d) unabsorbed losses at Balco plant 1. Consequently, the aluminium
               segment’s EBIT declined by 33.8% yoy to Rs50cr.

               Exhibit 4: Aluminium EBIT margin affected by higher costs

                     160                                                                     20

                     120                                                                     15
                (Rs cr)


                          80                                                                 10


                                                                                                  (%)
                          40                                                                 5

                           0                                                                 0
                                   1QFY10     2QFY10       3QFY10    4QFY10     1QFY11
                                              EBIT (LHS)       EBIT margins (RHS)

               Source: Company, Angel Research

               Zinc and lead segment – Higher metal prices negate lower volumes

               Despite production being lower, revenue from the zinc and lead segments grew by
               29.5% yoy to Rs1,928cr mainly on account of higher realisations and higher zinc
               sales on account of the commissioning of the 210ktpa zinc smelter at Rajpura
               Dariba during 4QFY2010, which produced 33,000 tonnes during the quarter.
               However, due to higher costs, EBIT margin was flat at 46.9% yoy.

               Exhibit 5: EBIT margins affected by higher stripping and staff costs

                          2,000                                                              70
                                                                                             60
                          1,500                                                              50
                                                                                             40
                (Rs cr)


                          1,000
                                                                                                  (%)


                                                                                             30

                           500                                                               20
                                                                                             10
                               0                                                             0
                                     1QFY10    2QFY10       3QFY10    4QFY10        1QFY11
                                              EBIT (LHS)       EBIT margins (RHS)

               Source: Company, Angel Research


July 26 2010                                                                                            5
Sterlite Industries | 1QFY2011 Result Update


               Expansion plans

               Aluminium
                      The 325ktpa aluminium smelter project at Balco is expected to be
                      commissioned in 4QFY2011.
                      Construction of the 1,200MW captive power plant is progressing well and the
                      first unit is expected to be commissioned in 3QFY2011, with the remaining
                      three units to be progressively commissioned by 2QFY2012.

               Power
                      The first 600MW unit of the 2400 MW (600MW x 4) coal-based commercial
                      power plant at Jharsuguda is expected to start commercial production in
                      September 2010. The remaining three units are expected to be progressively
                      commissioned by the end of 1QFY2012.
                      The EPC contract for the 1,980MW supercritical IPP project at Talwandi Sabo
                      has been signed and equipment has been ordered accordingly. The first unit is
                      expected to be commissioned by 4QFY2013 and the overall project
                      completion is expected by 2QFY2014.

               Zinc
                      The 100ktpa lead smelter at Rajpura Dariba is expected to be commissioned
                      by 2QFY2011E.
                      The 80MW captive power plant was commissioned in June 2010. The second
                      80MW power plant is expected to be commissioned by September 2010.
                      The Sindesar Khurd mine project is on schedule with production expected to
                      commence from 2QFY2011.


               Investment Rationale

               Robust expansion plan in metal and power: We believe the company is well poised
               to capitalise on strong metal demand as it expands its zinc and lead capacity to
               1.1mn tonnes and silver capacity to 500ktpa. Moreover, the company is also
               increasing its aluminium capacity by 325ktpa and its power capacity by 2,400MW
               (through its 100% subsidiary Sterlite Energy), benefits of which are likely to be
               witnessed in FY2012E.

               Balco and HZL minority stake buyout, clearance for Niyamgiri mine still awaited
               Sterlite has been in the process of buying the minority stake in Balco and HZL. We
               believe any positive development on this front would provide further upside to our
               target price. Moreover, it has been in the process of availing mining clearances for
               its Niyamgiri bauxite mine which in our view would lower the cost of production at
               Vedanta Aluminium, thereby leading to substantial improvement in earnings.


July 26 2010                                                                                     6
Sterlite Industries | 1QFY2011 Result Update


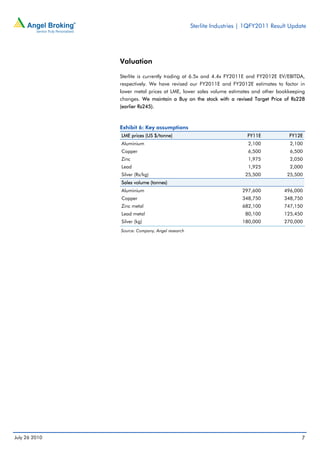
               Valuation

               Sterlite is currently trading at 6.5x and 4.4x FY2011E and FY2012E EV/EBITDA,
               respectively. We have revised our FY2011E and FY2012E estimates to factor in
               lower metal prices at LME, lower sales volume estimates and other bookkeeping
               changes. We maintain a Buy on the stock with a revised Target Price of Rs228
               (earlier Rs245).


               Exhibit 6: Key assumptions
               LME prices (US $/tonne)                                FY11E           FY12E
               Aluminium                                              2,100           2,100
               Copper                                                 6,500           6,500
               Zinc                                                   1,975           2,050
               Lead                                                   1,925           2,000
               Silver (Rs/kg)                                        25,500          25,500
               Sales volume (tonnes)
               Aluminium                                            297,600         496,000
               Copper                                               348,750         348,750
               Zinc metal                                           682,100         747,150
               Lead metal                                            80,100         125,450
               Silver (kg)                                          180,000         270,000
               Source: Company, Angel research


July 26 2010                                                                               7
Sterlite Industries | 1QFY2011 Result Update


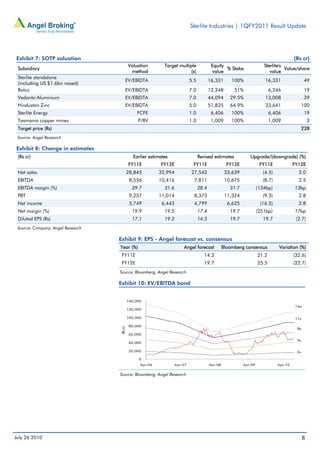
Exhibit 7: SOTP valuation                                                                                                                  (Rs cr)
                                             Valuation         Target multiple               Equity                        Sterlite's
 Subsidiary                                                                                         % Stake                           Value/share
                                              method                        (x)              value                            value
 Sterlite standalone
                                         EV/EBIDTA                             5.5          16,331       100%              16,331                 49
 (including US $1.6bn raised)
 Balco                                   EV/EBIDTA                             7.0          12,248        51%                  6,246              19
 Vedanta Aluminium                       EV/EBIDTA                             7.0          44,094      29.5%              13,008                 39
 Hindustan Zinc                          EV/EBIDTA                             5.0          51,835      64.9%              33,641                100
 Sterlite Energy                                  FCFE                         1.0           6,406       100%                  6,406              19
 Tasmania copper mines                            P/BV                         1.0           1,009       100%                  1,009                 3
 Target price (Rs)                                                                                                                               228
 Source: Angel Research

Exhibit 8: Change in estimates
 (Rs cr)                                        Earlier estimates                    Revised estimates            Upgrade/(downgrade) (%)
                                             FY11E           FY12E              FY11E                  FY12E             FY11E             FY12E
 Net sales                                   28,845         32,994             27,542                 33,639              (4.5)              2.0
 EBITDA                                       8,556         10,416               7,811                10,675              (8.7)              2.5
 EBITDA margin (%)                             29.7            31.6                  28.4               31.7            (134bp)            13bp
 PBT                                          9,237         11,014               8,375                11,324              (9.3)              2.8
 Net income                                   5,749           6,443              4,799                 6,625             (16.5)              2.8
 Net margin (%)                                19.9            19.5                  17.4               19.7            (251bp)            17bp
 Diluted EPS (Rs)                              17.1            19.2                  14.3               19.7              19.7              (2.7)
 Source: Company, Angel Research

                                   Exhibit 9: EPS - Angel forecast vs. consensus
                                   Year (%)                               Angel forecast             Bloomberg consensus           Variation (%)
                                    FY11E                                               14.3                            21.2               (32.6)
                                    FY12E                                               19.7                            25.5               (22.7)
                                   Source: Bloomberg, Angel Research

                                   Exhibit 10: EV/EBITDA band


                                             140,000
                                                                                                                                           14x
                                             120,000

                                             100,000                                                                                       11x

                                             80,000
                                   (Rs cr)


                                                                                                                                            8x
                                             60,000
                                                                                                                                            5x
                                             40,000

                                             20,000                                                                                         2x

                                                  0
                                                   Apr-06             Apr-07                Apr-08             Apr-09             Apr-10

                                   Source: Bloomberg, Angel Research


July 26 2010                                                                                                                                     8
Sterlite Industries | 1QFY2011 Result Update


                                               Exhibit 11: P/E band


                                                       450
                                                       400
                                                       350
                                                       300                                                                                            20x
                                                       250


                                                (Rs)
                                                                                                                                                      15x
                                                       200
                                                       150                                                                                            10x
                                                       100
                                                                                                                                                       5x
                                                       50
                                                         0
                                                         Apr-06                 Apr-07           Apr-08              Apr-09                Apr-10

                                                Source: Bloomberg, Angel Research

                                               Exhibit 12: P/BV band


                                                       500
                                                       450                                                                                           3.5x
                                                       400
                                                       350
                                                                                                                                                     2.5x
                                                       300
                                                (Rs)


                                                       250
                                                       200                                                                                           1.5x
                                                       150
                                                       100
                                                                                                                                                     0.5x
                                                        50
                                                         0
                                                         Apr-06                 Apr-07           Apr-08              Apr-09             Apr-10

                                                Source: Bloomberg, Angel Research


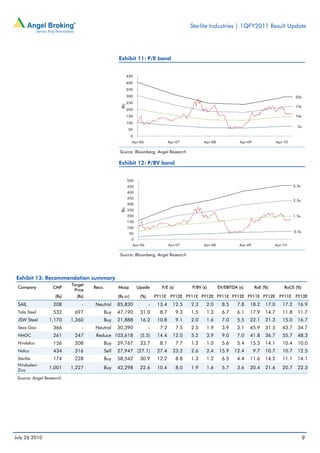
Exhibit 13: Recommendation summary
                           Target
 Company          CMP               Reco.      Mcap          Upside        P/E (x)         P/BV (x)       EV/EBITDA (x)       RoE (%)          RoCE (%)
                            Price
                    (Rs)     (Rs)              (Rs cr)        (%)       FY11E FY12E FY11E FY12E FY11E FY12E FY11E FY12E FY11E FY12E
 SAIL              208          -   Neutral    85,830               -    13.4     12.5     2.3    2.0       8.5    7.8    18.2      17.0      17.2     16.9
 Tata Steel        532      697         Buy    47,190         31.0        8.7        9.3   1.5    1.3       6.7    6.1    17.9      14.7      11.8     11.7
 JSW Steel      1,170      1,360        Buy    21,888         16.2       10.8        9.1   2.0    1.6       7.0    5.5    22.1      21.3      15.0     16.7
 Sesa Goa          366          -   Neutral    30,390               -     7.2        7.5   2.5    1.9       3.9    3.1    45.9      31.5      43.7     34.7
 NMDC              261      247      Reduce 103,618           (5.5)      14.4     12.0     5.2    3.9       9.0    7.0    41.8      36.7      55.7     48.3
 Hindalco          156      208         Buy    29,767         33.7        8.1        7.7   1.2    1.0       5.6    5.4    15.3      14.1      10.4     10.0
 Nalco             434      316         Sell   27,947 (27.1)             27.4     23.2     2.6    2.4     15.9    12.4        9.7   10.7      10.7     12.5
 Sterlite          174      228         Buy    58,542         30.9       12.2        8.8   1.3    1.2       6.5    4.4    11.6      14.2      11.1     14.1
 Hindustan
 Zinc
                1,001      1,227        Buy    42,298         22.6       10.4        8.0   1.9    1.6       5.7    3.6    20.4      21.6      20.7     22.3

 Source: Angel Research


July 26 2010                                                                                                                                                9
Sterlite Industries | 1QFY2011 Result Update


               Profit & Loss Statement (Consolidated)
               Y/E March (Rs cr)           FY2007 FY2008 FY2009         FY2010 FY2011E FY2012E
               Gross sales                 26,193    26,872 22,774      26,533    30,603   37,377
               Less: Excise duty            1,806     2,167    1,629     2,123     3,060    3,738
               Net Sales                   24,387    24,705 21,144      24,410    27,542   33,639
               Other operating income            -         -        -         -        -        -
               Total operating income      24,387    24,705 21,144      24,410    27,542   33,639
               % chg                         85.8       1.3    (14.4)     15.4      12.8     22.1
               Total expenditure           14,928    16,837 16,440      18,339    19,731   22,964
               Net raw materials           10,498    11,771 10,634      12,169    13,396   15,732
               Other Mfg costs              3,881     4,407    5,050     5,316     5,233    5,887
               Personnel                      549       659      756       854     1,102    1,346
               Other
               EBITDA                       9,459     7,868    4,704     6,072     7,811   10,675
               % chg                        156.3     (16.8)   (40.2)     29.1      28.7     36.7
               (% of net sales)              38.8      31.8     22.2      24.9      28.4     31.7
               Depreciation                   804       595      701       750     1,131    1,227
               EBIT                         8,655     7,273    4,003     5,322     6,680    9,448
               % chg                        173.6     (16.0)   (45.0)     32.9      25.5     41.4
               (% of net sales)              35.5      29.4     18.9      21.8      24.3     28.1
               Interest charges               379       319      397       342      784      814
               Other income                   682     1,566    2,154     1,959     2,479    2,691
               (% of PBT)                     7.6      18.4     37.4      28.2      29.6     23.8
               Share in profit of
                                                 -         -        -         -        -        -
               associates
               Recurring PBT                8,958     8,521    5,760     6,939     8,375   11,324
               % chg                        174.6      (4.9)   (32.4)     20.5      20.7     35.2
               Extraordinary
                                           (157.2)    (52.8)    55.3    (297.0)        -        -
               inc/(expense)
               PBT (reported)               8,800     8,468    5,816     6,642     8,375   11,324
               Tax                          2,473     2,103      855     1,233     1,842    2,491
               (% of PBT)                    28.1      24.8     14.7      18.6      22.0     22.0
               PAT (reported)               6,327     6,365    4,961     5,409     6,532    8,833
               Add: Share of earnings of
                                               (0)       (4)   (154)        59     (100)        -
               associate
               Less: Minority interest      1,904     1,962    1,267     1,724     1,633    2,208
               Extraordinary
                                                 -         -        -         -        -        -
               expense/(inc.)
               Net Income                   4,422     4,399    3,540     3,744     4,799    6,625
               Adj. Net Income              4,536     4,439    3,493     3,986     4,799    6,625
               % chg                        170.3      (2.1)   (21.3)     14.1      20.4     38.0
               (% of net sales)              18.6      18.0     16.5      16.3      17.4     19.7
               Basic EPS (Rs)                20.3      15.7     12.3      11.9      14.3     19.7
               Fully Diluted EPS (Rs)        20.3      15.7     12.3      11.9      14.3     19.7
               % chg                        (72.9)    (22.9)   (21.3)     (3.8)     20.4     38.0


July 26 2010                                                                                  10
Sterlite Industries | 1QFY2011 Result Update


               Balance Sheet (Consolidated)
               Y/E March (Rs cr)           FY2007 FY2008 FY2009 FY2010 FY2011E FY2012E
               SOURCES OF FUNDS
               Equity share capital          112     142     142     168      168      168
               Reserves & surplus           9,870 22,161 26,628 39,225      43,463   49,312
               Shareholders funds           9,982 22,303 26,770 39,393      43,631   49,480
               Share warrants                   -       -       -       -        -        -
               Minority interest            3,626   5,623   5,623   5,623    5,623    5,623
               Total loans                  4,610   5,075   7,075 10,575    13,075   13,575
               Deferred tax liability        917    1,354   1,354   1,354    1,354    1,354
               Total liabilities           19,135 34,354 40,822 56,944      63,682   70,032
               APPLICATION OF FUNDS
               Gross block                 12,641 14,564 17,064 20,564      23,564   25,564
               Less: Acc. depreciation      4,324   4,588   5,289   6,039    7,170    8,397
               Net block                    8,318   9,975 11,775 14,525     16,394   17,167
               Capital work-in-progress     1,400   2,461   3,961   5,461    6,461    7,461
               Goodwill                         -       -       -       -        -        -
               Investments                  5,222 16,294 16,294 16,294      16,294   16,294
               Current assets               9,059 10,663 13,861 25,949      30,029   35,089
               Cash                         1,113   2,454   5,883 17,375    20,967   24,974
               Loans & advances             3,484   3,314   3,314   3,314    3,314    3,314
               Other                        4,462   4,896   4,665   5,261    5,749    6,801
               Current liabilities          4,864   5,040   5,070   5,285    5,497    5,980
               Net current assets           4,196   5,623   8,792 20,664    24,533   29,110
               Mis. exp. not written off      0.0     0.0     0.0     0.0      0.0      0.0
               Total assets                19,135 34,354 40,822 56,944      63,682   70,032


July 26 2010                                                                             11
Sterlite Industries | 1QFY2011 Result Update


               Cash Flow Statement (Consolidated)
               Y/E March (Rs cr)       FY2007    FY2008 FY2009       FY2010 FY2011E FY2012E
               Profit before tax        8,800     8,468     5,816     6,642     8,375    11,324
               Depreciation               804       595       701       750     1,131     1,227
               Change in working
                                       (1,567)      (87)      261     (380)     (277)     (569)
               capital
               Less: Other income      (1,905)   (1,966)   (1,421)   (1,665)   (1,733)   (2,208)
               Direct taxes paid        2,473     2,103       855     1,233     1,842     2,491
               Cash Flow from
                                        3,660     4,907     4,501     4,113     5,653     7,283
               operations
               (Inc.)/ Dec. in fixed
                                       (1,840)   (2,984)   (4,000)   (5,000)   (4,000)   (3,000)
               assets
               (Inc.)/ Dec. in
                                       (2,727) (11,072)         0          -         -         -
               investments
               (Inc.)/ Dec. in loans
                                             -         -         -         -         -         -
               and advances
               Other income                  -         -         -         -         -         -
               Cash Flow from
                                       (4,567) (14,056)    (4,000)   (5,000)   (4,000)   (3,000)
               investing
               Issue of equity         (171.7)    8,051          -    7,680          -         -
               Inc./(Dec.) in loans     (555)       464     2,000     3,500     2,500       500
               Dividend Paid (incl.
                                          223       283       248       466       562       775
               tax)
               Others                  (1,856)   (2,257)   (1,176)   (1,665)         -         -
               Cash Flow from
                                          905    10,489     2,928    12,379     1,938     (275)
               financing
               Inc./(Dec.) in cash         (2)    1,340     3,429    11,492     3,592     4,008
               Opening cash
                                        1,115     1,113     2,454     5,883    17,375    20,967
               balances
               Closing cash balances    1,113     2,454     5,883    17,375    20,967    24,974


July 26 2010                                                                                  12
Sterlite Industries | 1QFY2011 Result Update


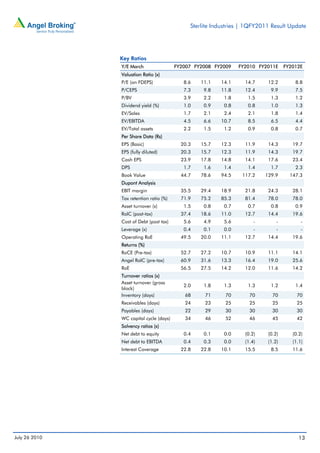
               Key Ratios
               Y/E March                 FY2007 FY2008 FY2009   FY2010 FY2011E     FY2012E
               Valuation Ratio (x)
               P/E (on FDEPS)               8.6   11.1   14.1     14.7     12.2        8.8
               P/CEPS                       7.3    9.8   11.8     12.4      9.9        7.5
               P/BV                         3.9    2.2    1.8      1.5      1.3        1.2
               Dividend yield (%)           1.0    0.9    0.8      0.8      1.0        1.3
               EV/Sales                     1.7    2.1    2.4      2.1      1.8        1.4
               EV/EBITDA                    4.5    6.6   10.7      8.5      6.5        4.4
               EV/Total assets              2.2    1.5    1.2      0.9      0.8        0.7
               Per Share Data (Rs)
               EPS (Basic)                 20.3   15.7   12.3     11.9     14.3       19.7
               EPS (fully diluted)         20.3   15.7   12.3     11.9     14.3       19.7
               Cash EPS                    23.9   17.8   14.8     14.1     17.6       23.4
               DPS                          1.7    1.6    1.4      1.4      1.7        2.3
               Book Value                  44.7   78.6   94.5    117.2    129.9      147.3
               Dupont Analysis
               EBIT margin                 35.5   29.4   18.9     21.8     24.3       28.1
               Tax retention ratio (%)     71.9   75.2   85.3     81.4     78.0       78.0
               Asset turnover (x)           1.5    0.8    0.7      0.7      0.8        0.9
               RoIC (post-tax)             37.4   18.6   11.0     12.7     14.4       19.6
               Cost of Debt (post tax)      5.6    4.9    5.6         -        -          -
               Leverage (x)                 0.4    0.1    0.0         -        -          -
               Operating RoE               49.5   20.0   11.1     12.7     14.4       19.6
               Returns (%)
               RoCE (Pre-tax)              52.7   27.2   10.7     10.9     11.1       14.1
               Angel RoIC (pre-tax)        60.9   31.6   13.3     16.4     19.0       25.6
               RoE                         56.5   27.5   14.2     12.0     11.6       14.2
               Turnover ratios (x)
               Asset turnover (gross
                                            2.0    1.8    1.3      1.3      1.2        1.4
               block)
               Inventory (days)             68     71      70       70       70         70
               Receivables (days)           24     23      25       25       25         25
               Payables (days)              22     29      30       30       30         30
               WC capital cycle (days)      34     46      52       46       45         42
               Solvency ratios (x)
               Net debt to equity           0.4    0.1    0.0     (0.2)    (0.2)      (0.2)
               Net debt to EBITDA           0.4    0.3    0.0     (1.4)    (1.2)      (1.1)
               Interest Coverage           22.8   22.8   10.1     15.5      8.5       11.6


July 26 2010                                                                            13
Sterlite Industries | 1QFY2011 Result Update


  Research Team Tel: 022 - 4040 3800               E-mail: research@angeltrade.com                   Website: www.angeltrade.com

 DISCLAIMER

 This document is solely for the personal information of the recipient, and must not be singularly used as the basis of any investment
 decision. Nothing in this document should be construed as investment or financial advice. Each recipient of this document should make
 such investigations as they deem necessary to arrive at an independent evaluation of an investment in the securities of the companies
 referred to in this document (including the merits and risks involved), and should consult their own advisors to determine the merits and
 risks of such an investment.

 Angel Broking Limited, its affiliates, directors, its proprietary trading and investment businesses may, from time to time, make
 investment decisions that are inconsistent with or contradictory to the recommendations expressed herein. The views contained in this
 document are those of the analyst, and the company may or may not subscribe to all the views expressed within.

 Reports based on technical and derivative analysis center on studying charts of a stock's price movement, outstanding positions and
 trading volume, as opposed to focusing on a company's fundamentals and, as such, may not match with a report on a company's
 fundamentals.

 The information in this document has been printed on the basis of publicly available information, internal data and other reliable
 sources believed to be true, but we do not represent that it is accurate or complete and it should not be relied on as such, as this
 document is for general guidance only. Angel Broking Limited or any of its affiliates/ group companies shall not be in any way
 responsible for any loss or damage that may arise to any person from any inadvertent error in the information contained in this report.
 Angel Broking Limited has not independently verified all the information contained within this document. Accordingly, we cannot testify,
 nor make any representation or warranty, express or implied, to the accuracy, contents or data contained within this document. While
 Angel Broking Limited endeavours to update on a reasonable basis the information discussed in this material, there may be regulatory,
 compliance, or other reasons that prevent us from doing so.
 This document is being supplied to you solely for your information, and its contents, information or data may not be reproduced,
 redistributed or passed on, directly or indirectly.

 Angel Broking Limited and its affiliates may seek to provide or have engaged in providing corporate finance, investment banking or
 other advisory services in a merger or specific transaction to the companies referred to in this report, as on the date of this report or in
 the past.

 Neither Angel Broking Limited, nor its directors, employees or affiliates shall be liable for any loss or damage that may arise from or in
 connection with the use of this information.

 Note: Please refer to the important `Stock Holding Disclosure' report on the Angel website (Research Section). Also, please
 refer to the latest update on respective stocks for the disclosure status in respect of those stocks. Angel Broking Limited and
 its affiliates may have investment positions in the stocks recommended in this report.


 Disclosure of Interest Statement                                            Sterlite Industries
 1. Analyst ownership of the stock                                                   No
 2. Angel and its Group companies ownership of the stock                             No
 3. Angel and its Group companies' Directors ownership of the stock                  No
 4. Broking relationship with company covered                                        No

 Note: We have not considered any Exposure below Rs 1 lakh for Angel, its Group companies and Directors.


 Ratings (Returns) :             Buy (> 15%)                      Accumulate (5% to 15%)                 Neutral (-5 to 5%)
                                 Reduce (-5% to 15%)              Sell (< -15%)


July 26 2010                                                                                                                              14

More Related Content

What's hot (19)

Tata Steel
Tata SteelTata Steel
Tata Steel
 
L&T - Result Update RU2QFY2011
L&T - Result Update RU2QFY2011L&T - Result Update RU2QFY2011
L&T - Result Update RU2QFY2011
 
Nalco
Nalco Nalco
Nalco
 
Larsen & Tourbo
Larsen & TourboLarsen & Tourbo
Larsen & Tourbo
 
Sesa Goa - Result Update
Sesa Goa  - Result Update Sesa Goa  - Result Update
Sesa Goa - Result Update
 
Punj Lloyd
Punj LloydPunj Lloyd
Punj Lloyd
 
Gujarat Gas
Gujarat GasGujarat Gas
Gujarat Gas
 
Hzl 2 qfy2011 result update - 201010
Hzl   2 qfy2011 result update - 201010Hzl   2 qfy2011 result update - 201010
Hzl 2 qfy2011 result update - 201010
 
DLF
DLFDLF
DLF
 
NTPC
NTPCNTPC
NTPC
 
India Cement
India CementIndia Cement
India Cement
 
Orchid
Orchid Orchid
Orchid
 
Cairn India
Cairn IndiaCairn India
Cairn India
 
Petronet lng ru4 qfy2010-290410
Petronet lng ru4 qfy2010-290410Petronet lng ru4 qfy2010-290410
Petronet lng ru4 qfy2010-290410
 
Bosch
BoschBosch
Bosch
 
Gipcl
Gipcl Gipcl
Gipcl
 
Bharat Forge
Bharat ForgeBharat Forge
Bharat Forge
 
Tata Motors
Tata Motors Tata Motors
Tata Motors
 
Cesc
Cesc Cesc
Cesc
 

Similar to Sterlite Industries (20)

Monnet Ispat and Energy
Monnet Ispat and Energy  Monnet Ispat and Energy
Monnet Ispat and Energy
 
Sterlite Result Update
Sterlite Result UpdateSterlite Result Update
Sterlite Result Update
 
Sarda Energy
Sarda EnergySarda Energy
Sarda Energy
 
Godawari Power
Godawari PowerGodawari Power
Godawari Power
 
Areva TD
Areva TDAreva TD
Areva TD
 
ABG Shipyard
ABG Shipyard ABG Shipyard
ABG Shipyard
 
Graphite India
Graphite IndiaGraphite India
Graphite India
 
BHEL -Result Update
BHEL -Result UpdateBHEL -Result Update
BHEL -Result Update
 
Hindalco
Hindalco Hindalco
Hindalco
 
SAIL
SAILSAIL
SAIL
 
Prakash Indutries
Prakash Indutries Prakash Indutries
Prakash Indutries
 
Hindalco Novelis
Hindalco Novelis Hindalco Novelis
Hindalco Novelis
 
Sesa goa 2QFY2011 Result Update
Sesa goa   2QFY2011 Result UpdateSesa goa   2QFY2011 Result Update
Sesa goa 2QFY2011 Result Update
 
RIL - result Update
RIL - result UpdateRIL - result Update
RIL - result Update
 
GSPL
GSPLGSPL
GSPL
 
GSPL
GSPLGSPL
GSPL
 
Bajaj Electricals
Bajaj ElectricalsBajaj Electricals
Bajaj Electricals
 
Sintex Industries
Sintex IndustriesSintex Industries
Sintex Industries
 
HZL Q4 2010 Result Update
HZL Q4 2010 Result UpdateHZL Q4 2010 Result Update
HZL Q4 2010 Result Update
 
BGR Energy
BGR EnergyBGR Energy
BGR Energy
 

More from Angel Broking

Market outlook 110612
Market outlook 110612Market outlook 110612
Market outlook 110612Angel Broking
 
Axis%20 bank ru1qfy2012-220711
Axis%20 bank ru1qfy2012-220711Axis%20 bank ru1qfy2012-220711
Axis%20 bank ru1qfy2012-220711Angel Broking
 
Electrosteel castings
Electrosteel castingsElectrosteel castings
Electrosteel castingsAngel Broking
 
Derivative report 19th July 2011
Derivative report 19th July 2011Derivative report 19th July 2011
Derivative report 19th July 2011Angel Broking
 
Market outlook 19th July 2011
Market outlook 19th July 2011Market outlook 19th July 2011
Market outlook 19th July 2011Angel Broking
 
Weekly Report 18th July 2011
Weekly Report 18th July 2011Weekly Report 18th July 2011
Weekly Report 18th July 2011Angel Broking
 
Derivative Report 18th July 2011
Derivative Report 18th July 2011Derivative Report 18th July 2011
Derivative Report 18th July 2011Angel Broking
 
Technical Report 18th July 2011
Technical Report 18th July 2011Technical Report 18th July 2011
Technical Report 18th July 2011Angel Broking
 
Market Outlook 18th July 2011
Market Outlook 18th July 2011Market Outlook 18th July 2011
Market Outlook 18th July 2011Angel Broking
 
Bajaj auto Result Updated
Bajaj auto Result UpdatedBajaj auto Result Updated
Bajaj auto Result UpdatedAngel Broking
 
Tata consultancy services
Tata consultancy services Tata consultancy services
Tata consultancy services Angel Broking
 
Derivatives Report 15th July 2011
Derivatives Report 15th July 2011Derivatives Report 15th July 2011
Derivatives Report 15th July 2011Angel Broking
 
Technical Report 15th July 2011
Technical Report 15th July 2011Technical Report 15th July 2011
Technical Report 15th July 2011Angel Broking
 
Infosys Result Updated
Infosys Result UpdatedInfosys Result Updated
Infosys Result UpdatedAngel Broking
 
Derivative Report 13th July 2011
Derivative Report 13th July 2011Derivative Report 13th July 2011
Derivative Report 13th July 2011Angel Broking
 

More from Angel Broking (20)

Market outlook 110612
Market outlook 110612Market outlook 110612
Market outlook 110612
 
Axis%20 bank ru1qfy2012-220711
Axis%20 bank ru1qfy2012-220711Axis%20 bank ru1qfy2012-220711
Axis%20 bank ru1qfy2012-220711
 
Electrosteel castings
Electrosteel castingsElectrosteel castings
Electrosteel castings
 
Persistent systems
Persistent systemsPersistent systems
Persistent systems
 
Ht media
Ht mediaHt media
Ht media
 
Derivative report 19th July 2011
Derivative report 19th July 2011Derivative report 19th July 2011
Derivative report 19th July 2011
 
Market outlook 19th July 2011
Market outlook 19th July 2011Market outlook 19th July 2011
Market outlook 19th July 2011
 
Telecom sector
Telecom sectorTelecom sector
Telecom sector
 
Weekly Report 18th July 2011
Weekly Report 18th July 2011Weekly Report 18th July 2011
Weekly Report 18th July 2011
 
Derivative Report 18th July 2011
Derivative Report 18th July 2011Derivative Report 18th July 2011
Derivative Report 18th July 2011
 
Technical Report 18th July 2011
Technical Report 18th July 2011Technical Report 18th July 2011
Technical Report 18th July 2011
 
Market Outlook 18th July 2011
Market Outlook 18th July 2011Market Outlook 18th July 2011
Market Outlook 18th July 2011
 
South Indian Bank
 South Indian Bank South Indian Bank
South Indian Bank
 
Bajaj auto Result Updated
Bajaj auto Result UpdatedBajaj auto Result Updated
Bajaj auto Result Updated
 
Tata consultancy services
Tata consultancy services Tata consultancy services
Tata consultancy services
 
Fc4 e63c4d01
Fc4 e63c4d01Fc4 e63c4d01
Fc4 e63c4d01
 
Derivatives Report 15th July 2011
Derivatives Report 15th July 2011Derivatives Report 15th July 2011
Derivatives Report 15th July 2011
 
Technical Report 15th July 2011
Technical Report 15th July 2011Technical Report 15th July 2011
Technical Report 15th July 2011
 
Infosys Result Updated
Infosys Result UpdatedInfosys Result Updated
Infosys Result Updated
 
Derivative Report 13th July 2011
Derivative Report 13th July 2011Derivative Report 13th July 2011
Derivative Report 13th July 2011
 

Recently uploaded

najoomi asli amil baba kala jadu expert rawalpindi bangladesh uk usa
najoomi asli amil baba kala jadu expert rawalpindi bangladesh uk usanajoomi asli amil baba kala jadu expert rawalpindi bangladesh uk usa
najoomi asli amil baba kala jadu expert rawalpindi bangladesh uk usabatoole333
 
Bank of Tomorrow White Paper For Reading
Bank of Tomorrow White Paper For ReadingBank of Tomorrow White Paper For Reading
Bank of Tomorrow White Paper For ReadingNghiaPham100
 
No 1 Top Love marriage specialist baba ji amil baba kala ilam powerful vashik...
No 1 Top Love marriage specialist baba ji amil baba kala ilam powerful vashik...No 1 Top Love marriage specialist baba ji amil baba kala ilam powerful vashik...
No 1 Top Love marriage specialist baba ji amil baba kala ilam powerful vashik...batoole333
 
Significant AI Trends for the Financial Industry in 2024 and How to Utilize Them
Significant AI Trends for the Financial Industry in 2024 and How to Utilize ThemSignificant AI Trends for the Financial Industry in 2024 and How to Utilize Them
Significant AI Trends for the Financial Industry in 2024 and How to Utilize Them360factors
 
Q1 2024 Conference Call Presentation vF.pdf
Q1 2024 Conference Call Presentation vF.pdfQ1 2024 Conference Call Presentation vF.pdf
Q1 2024 Conference Call Presentation vF.pdfAdnet Communications
 
Certified Kala Jadu, Black magic specialist in Rawalpindi and Bangali Amil ba...
Certified Kala Jadu, Black magic specialist in Rawalpindi and Bangali Amil ba...Certified Kala Jadu, Black magic specialist in Rawalpindi and Bangali Amil ba...
Certified Kala Jadu, Black magic specialist in Rawalpindi and Bangali Amil ba...batoole333
 
GIFT City Overview India's Gateway to Global Finance
GIFT City Overview  India's Gateway to Global FinanceGIFT City Overview  India's Gateway to Global Finance
GIFT City Overview India's Gateway to Global FinanceGaurav Kanudawala
 
20240514-Calibre-Q1-2024-Conference-Call-Presentation.pdf
20240514-Calibre-Q1-2024-Conference-Call-Presentation.pdf20240514-Calibre-Q1-2024-Conference-Call-Presentation.pdf
20240514-Calibre-Q1-2024-Conference-Call-Presentation.pdfAdnet Communications
 
Current scenario of Energy Retail utilities market in UK
Current scenario of Energy Retail utilities market in UKCurrent scenario of Energy Retail utilities market in UK
Current scenario of Energy Retail utilities market in UKParas Gupta
 
Sealdah $ Cheap Call Girls In Kolkata ₹7.5k Pick Up & Drop With Cash Payment ...
Sealdah $ Cheap Call Girls In Kolkata ₹7.5k Pick Up & Drop With Cash Payment ...Sealdah $ Cheap Call Girls In Kolkata ₹7.5k Pick Up & Drop With Cash Payment ...
Sealdah $ Cheap Call Girls In Kolkata ₹7.5k Pick Up & Drop With Cash Payment ...soniyagrag336
 
Famous Kala Jadu, Black magic expert in Faisalabad and Kala ilam specialist i...
Famous Kala Jadu, Black magic expert in Faisalabad and Kala ilam specialist i...Famous Kala Jadu, Black magic expert in Faisalabad and Kala ilam specialist i...
Famous Kala Jadu, Black magic expert in Faisalabad and Kala ilam specialist i...batoole333
 
Famous Kala Jadu, Black magic expert in Oman Or Kala ilam expert in Kuwait
Famous Kala Jadu, Black magic expert in Oman Or Kala ilam expert in KuwaitFamous Kala Jadu, Black magic expert in Oman Or Kala ilam expert in Kuwait
Famous Kala Jadu, Black magic expert in Oman Or Kala ilam expert in Kuwaitbatoole333
 
Certified Kala Jadu, Black magic specialist in Rawalpindi and Bangali Amil ba...
Certified Kala Jadu, Black magic specialist in Rawalpindi and Bangali Amil ba...Certified Kala Jadu, Black magic specialist in Rawalpindi and Bangali Amil ba...
Certified Kala Jadu, Black magic specialist in Rawalpindi and Bangali Amil ba...batoole333
 
Collecting banker, Capacity of collecting Banker, conditions under section 13...
Collecting banker, Capacity of collecting Banker, conditions under section 13...Collecting banker, Capacity of collecting Banker, conditions under section 13...
Collecting banker, Capacity of collecting Banker, conditions under section 13...RaniT11
 
najoomi asli amil baba kala jadu expert rawalpindi bangladesh uk usa
najoomi asli amil baba kala jadu expert rawalpindi bangladesh uk usanajoomi asli amil baba kala jadu expert rawalpindi bangladesh uk usa
najoomi asli amil baba kala jadu expert rawalpindi bangladesh uk usamazhshah570
 
劳伦森大学毕业证
劳伦森大学毕业证劳伦森大学毕业证
劳伦森大学毕业证yyawb
 
cost-volume-profit analysis.ppt(managerial accounting).pptx
cost-volume-profit analysis.ppt(managerial accounting).pptxcost-volume-profit analysis.ppt(managerial accounting).pptx
cost-volume-profit analysis.ppt(managerial accounting).pptxazadalisthp2020i
 
Black magic specialist in Saudi Arabia (Kala jadu expert in UK) Bangali Amil ...
Black magic specialist in Saudi Arabia (Kala jadu expert in UK) Bangali Amil ...Black magic specialist in Saudi Arabia (Kala jadu expert in UK) Bangali Amil ...
Black magic specialist in Saudi Arabia (Kala jadu expert in UK) Bangali Amil ...batoole333
 
Lion One Corporate Presentation May 2024
Lion One Corporate Presentation May 2024Lion One Corporate Presentation May 2024
Lion One Corporate Presentation May 2024Adnet Communications
 

Recently uploaded (20)

najoomi asli amil baba kala jadu expert rawalpindi bangladesh uk usa
najoomi asli amil baba kala jadu expert rawalpindi bangladesh uk usanajoomi asli amil baba kala jadu expert rawalpindi bangladesh uk usa
najoomi asli amil baba kala jadu expert rawalpindi bangladesh uk usa
 
Bank of Tomorrow White Paper For Reading
Bank of Tomorrow White Paper For ReadingBank of Tomorrow White Paper For Reading
Bank of Tomorrow White Paper For Reading
 
No 1 Top Love marriage specialist baba ji amil baba kala ilam powerful vashik...
No 1 Top Love marriage specialist baba ji amil baba kala ilam powerful vashik...No 1 Top Love marriage specialist baba ji amil baba kala ilam powerful vashik...
No 1 Top Love marriage specialist baba ji amil baba kala ilam powerful vashik...
 
Significant AI Trends for the Financial Industry in 2024 and How to Utilize Them
Significant AI Trends for the Financial Industry in 2024 and How to Utilize ThemSignificant AI Trends for the Financial Industry in 2024 and How to Utilize Them
Significant AI Trends for the Financial Industry in 2024 and How to Utilize Them
 
Q1 2024 Conference Call Presentation vF.pdf
Q1 2024 Conference Call Presentation vF.pdfQ1 2024 Conference Call Presentation vF.pdf
Q1 2024 Conference Call Presentation vF.pdf
 
Certified Kala Jadu, Black magic specialist in Rawalpindi and Bangali Amil ba...
Certified Kala Jadu, Black magic specialist in Rawalpindi and Bangali Amil ba...Certified Kala Jadu, Black magic specialist in Rawalpindi and Bangali Amil ba...
Certified Kala Jadu, Black magic specialist in Rawalpindi and Bangali Amil ba...
 
GIFT City Overview India's Gateway to Global Finance
GIFT City Overview  India's Gateway to Global FinanceGIFT City Overview  India's Gateway to Global Finance
GIFT City Overview India's Gateway to Global Finance
 
Abortion pills in Dammam Saudi Arabia | +966572737505 |Get Cytotec
Abortion pills in Dammam Saudi Arabia | +966572737505 |Get CytotecAbortion pills in Dammam Saudi Arabia | +966572737505 |Get Cytotec
Abortion pills in Dammam Saudi Arabia | +966572737505 |Get Cytotec
 
20240514-Calibre-Q1-2024-Conference-Call-Presentation.pdf
20240514-Calibre-Q1-2024-Conference-Call-Presentation.pdf20240514-Calibre-Q1-2024-Conference-Call-Presentation.pdf
20240514-Calibre-Q1-2024-Conference-Call-Presentation.pdf
 
Current scenario of Energy Retail utilities market in UK
Current scenario of Energy Retail utilities market in UKCurrent scenario of Energy Retail utilities market in UK
Current scenario of Energy Retail utilities market in UK
 
Sealdah $ Cheap Call Girls In Kolkata ₹7.5k Pick Up & Drop With Cash Payment ...
Sealdah $ Cheap Call Girls In Kolkata ₹7.5k Pick Up & Drop With Cash Payment ...Sealdah $ Cheap Call Girls In Kolkata ₹7.5k Pick Up & Drop With Cash Payment ...
Sealdah $ Cheap Call Girls In Kolkata ₹7.5k Pick Up & Drop With Cash Payment ...
 
Famous Kala Jadu, Black magic expert in Faisalabad and Kala ilam specialist i...
Famous Kala Jadu, Black magic expert in Faisalabad and Kala ilam specialist i...Famous Kala Jadu, Black magic expert in Faisalabad and Kala ilam specialist i...
Famous Kala Jadu, Black magic expert in Faisalabad and Kala ilam specialist i...
 
Famous Kala Jadu, Black magic expert in Oman Or Kala ilam expert in Kuwait
Famous Kala Jadu, Black magic expert in Oman Or Kala ilam expert in KuwaitFamous Kala Jadu, Black magic expert in Oman Or Kala ilam expert in Kuwait
Famous Kala Jadu, Black magic expert in Oman Or Kala ilam expert in Kuwait
 
Certified Kala Jadu, Black magic specialist in Rawalpindi and Bangali Amil ba...
Certified Kala Jadu, Black magic specialist in Rawalpindi and Bangali Amil ba...Certified Kala Jadu, Black magic specialist in Rawalpindi and Bangali Amil ba...
Certified Kala Jadu, Black magic specialist in Rawalpindi and Bangali Amil ba...
 
Collecting banker, Capacity of collecting Banker, conditions under section 13...
Collecting banker, Capacity of collecting Banker, conditions under section 13...Collecting banker, Capacity of collecting Banker, conditions under section 13...
Collecting banker, Capacity of collecting Banker, conditions under section 13...
 
najoomi asli amil baba kala jadu expert rawalpindi bangladesh uk usa
najoomi asli amil baba kala jadu expert rawalpindi bangladesh uk usanajoomi asli amil baba kala jadu expert rawalpindi bangladesh uk usa
najoomi asli amil baba kala jadu expert rawalpindi bangladesh uk usa
 
劳伦森大学毕业证
劳伦森大学毕业证劳伦森大学毕业证
劳伦森大学毕业证
 
cost-volume-profit analysis.ppt(managerial accounting).pptx
cost-volume-profit analysis.ppt(managerial accounting).pptxcost-volume-profit analysis.ppt(managerial accounting).pptx
cost-volume-profit analysis.ppt(managerial accounting).pptx
 
Black magic specialist in Saudi Arabia (Kala jadu expert in UK) Bangali Amil ...
Black magic specialist in Saudi Arabia (Kala jadu expert in UK) Bangali Amil ...Black magic specialist in Saudi Arabia (Kala jadu expert in UK) Bangali Amil ...
Black magic specialist in Saudi Arabia (Kala jadu expert in UK) Bangali Amil ...
 
Lion One Corporate Presentation May 2024
Lion One Corporate Presentation May 2024Lion One Corporate Presentation May 2024
Lion One Corporate Presentation May 2024
 

Sterlite Industries

  • 1. 1QFY2011 Result Update | Base Metals July 26 2010 Sterlite Industries BUY CMP Rs174 Performance Highlights Target Price Rs228   Particulars (Rs cr) 1QFY2011 1QFY2010 % chg (yoy) 4QFY2010 % chg (qoq) Investment Period 12 months Net sales 5,925 4,537 30.6 7,111 (16.7) Stock Info EBITDA 1,452 979 48.3 2,068 (29.8) Sector Base Metals EBITDA margin(%) 24.5 21.6 292bp 29.1 (459bp) Market Cap (Rs cr) 58,542 Net profit 1,008 673 49.9 1,381 (27.0) Beta 1.7 Source: Company, Angel Research 52 Week High / Low 232/137 Sterlite’s 1QFY2011 net revenue stood at Rs5,925cr, below our estimates of Avg. Daily Volume 685171 Rs6,987cr. Net profit at Rs1,008cr was also below our estimates of Rs1,259cr. The deviation was mainly due to lower production and higher costs. Face Value (Rs) 1 BSE Sensex 18,020 1QFY2011 results below our estimates: Sterlite’s net revenue grew 30.6% yoy to Nifty 5,419 Rs5,925cr, largely because of a) increased metal prices, b) higher zinc and silver Reuters Code STRL.BO sales and c) increased by-product realisations. On the negative side, production Bloomberg Code STLT@IN was affected by the planned maintenance shutdown at Tuticorin, water shortage at HZL plants and low-grade ore from Rampura Agucha mine. The company’s operating profit was boosted by lower cost in the copper segment; however, it was Shareholding Pattern (%) negatively affected by a) increased staff cost (additional gratuity provision and Promoters 52.1 long-term wage settlement), b) higher stripping cost and c) increased alumina, power, coal and coke costs. EBITDA margin expanded by 292bp yoy to 24.5%, MF / Banks / Indian Fls 22.8 which led to EBITDA growing by 48.3% to Rs1,452cr. Other income grew by FII / NRIs / OCBs 14.3 64.6% to Rs692cr, boosted by gain of Rs165cr on FCCBs, thus increasing net Indian Public / Others 10.8 profit by 49.9% yoy to Rs1,008cr. Outlook and Valuation: Sterlite is currently trading at 6.5x and 4.4x FY2011E and Abs. (%) 3m 1yr 3yr FY2012E EV/EBITDA, respectively. We believe the company is well poised to Sensex 1.5 17.2 14.2 capitalise on strong metal demand through its expansion plans coupled with a reduction in operating costs. Moreover, the settlement of the Balco and Hindustan Sterlite (17.3) 6.7 5.9 Zinc (HZL) call option and the grant of the Niyamgiri mining clearance could provide a further upside to our target price. Hence, we maintain a Buy on the stock with a revised Target Price of Rs228 (earlier Rs245). Key Financials (Consolidated) Y/E March (Rs cr) FY2009 FY2010 FY2011E FY2012E Net sales 21,144 24,410 27,542 33,639 % chg (14.4) 15.4 12.8 22.1 Net profit 3,493 3,986 4,799 6,625 % chg (21.3) 14.1 20.4 38.0 EPS (Rs) 12.3 11.9 14.3 19.7 EBITDA margin (%) 22.2 24.9 28.4 31.7 Paresh Jain P/E (x) 14.1 14.7 12.2 8.8 Tel: 022-40403800 Ext: 348 P/BV (x) 1.8 1.5 1.3 1.2 pareshn.jain@angeltrade.com RoE (%) 14.2 12.0 11.6 14.2 RoCE (%) 10.7 10.9 11.1 14.1 Pooja Jain EV/Sales (x) 2.4 2.1 1.8 1.4 Tel: 022-40403800 Ext: 311 EV/EBITDA (x) 10.7 8.5 6.5 4.4 pooja.j@angeltrade.com Source: Company, Angel Research Please refer to important disclosures at the end of this report 1
  • 2. Sterlite Industries | 1QFY2011 Result Update Exhibit 1: 1QFY2011 performance (Consolidated) Y/E March (Rs cr) 1QFY11 1QFY10 % chg FY10 FY09 % chg Net Sales 5,925 4,537 30.6 24,410 21,144 15.4 Consumption of raw 2,679 2,116 26.6 12,169 10,634 14.4 material (% of net sales) 45.2 46.6 49.9 50.3 Power & fuel 558 467 19.6 1,953 2,132 (8.4) (% of net sales) 9.4 10.3 8.0 10.1 Staff costs 284 173 63.9 854 756 12.9 (% of net sales) 4.8 3.8 3.5 3.6 Other expenses 952 802 18.6 3,363 2,918 15.2 (% of net sales) 16.1 17.7 13.8 13.8 Total expenditure 4,473 3,558 25.7 18,339 16,440 11.5 (% of net sales) 75.5 78.4 75.1 77.8 EBITDA 1,452 979 48.3 6,072 4,704 29.1 EBITDA margin (%) 24.5 21.6 24.9 22.2 Interest 141 71 97.8 342 397 (13.8) Depreciation 217 174 25.0 750 701 7.0 Other income + 737 420 75.5 1,959 2,154 (9.0) operating income Exceptional items 0 0 (297) 55 Profit before tax 1,831 1,154 58.6 6,642 5,816 14.2 (% of net sales) 30.9 25.4 27.2 27.5 Tax 368 230 59.9 1,233 855 44.2 (% of PBT) 6.2 5.1 5.1 4.0 Profit after tax 1,462 924 58.3 5,409 4,961 9.0 Net income 1,008 673 49.9 3,744 3,540 5.8 (% of net sales) 17.0 14.8 15.3 16.7 FDEPS (Rs) 2.8 8.0 (64.7) 11.9 12.3 (3.8) Source: Company, Angel Research Exhibit 2: 1QFY2011 - Actual vs. Angel estimates (Rs cr) Actual Estimates Variation (%) Net sales 5,925 6,987 (15.2) EBITDA 1,452 2,103 (31.0) EBITDA margins (%) 24.5 30.1 (560bp) PBT 1,831 2,293 (20.2) PAT 1,008 1,259 (19.9) Source: Company, Angel Research July 26 2010 2
  • 3. Sterlite Industries | 1QFY2011 Result Update Key conference call takeaways Details of Vedanta Aluminium (VAL) financing: The total investment required in VAL is about Rs26,500cr, of which Rs13,400cr is through long-term debt and Rs13,100cr is via equity. Equity financing would be in the ratio of 70:30 for Vedanta PLC and Sterlite (which means that Sterlite’s equity contribution would be Rs4,000cr). However, Sterlite has infused nearly Rs6,500cr in VAL till date (Rs3,000cr as equity and Rs3,500cr as debt at a market interest rate). During the quarter, VAL produced 203ktpa of alumina and reported EBITDA of Rs140cr. PPA not singed for VAL: Sterlite Energy has secured coal linkages for the 2,400MW power plant at Jharsuguda with Coal India. Sterlite Energy has also entered into a long-term PPA with GridCo at Rs2.5/unit, but it is yet to finalise the PPA agreement with VAL. Management has indicated that the power would be sold to VAL at a price similar to that of Grid Co. Venturing into the port business: Sterlite has entered the port business to develop a coal berth at Vizag on a revenue-sharing basis in a joint venture (JV) with Leighton Contractors (26% share). The agreement has been signed with Vizag Port Authorities and the estimated cost of the project is Rs500cr, which is likely to be completed in mid-2012. The JV company has also been awarded the Paradeep Port project for the development of multipurpose berth, the estimated cost of which is Rs400cr. Clearance for Niyamgiri mine still awaited: Management indicated that it has submitted all the necessary documents required for availing forest clearance. On receipt of all the clearances, the company would take 3–6 months to start bauxite production. The mine has reserves of nearly 70mn–80mn tonnes, and the area holds potential for further exploration. In addition, the company is in dialogue with the government for allocation of new blocks. Balco and HZL minority stake buyout still awaited: Management indicated that Balco’s arbitration process is in its final stages, with the last round of arbitration in August 2010. However, it did not specify the time for HZL’s buyout but indicated that it has entered into a mediation process. Sterlite has sufficient cash on books (Rs24,874cr) towards these buyouts. Cost of production: During 1QFY2011, the cost of producing aluminium at Balco and VAL was Rs83,000/tonne and Rs86,000/tonne, respectively. The cash cost at HZL excluding royalty was Rs38,900/tonne. On account of higher stripping ratio, cost of production at HZL has increased by US $15/tonne July 26 2010 3
  • 4. Sterlite Industries | 1QFY2011 Result Update 1QFY2011 result highlights In 1QFY2011, Sterlite’s net revenue increased by 30.6% yoy to Rs5,925cr, largely because of a) increased metal prices, b) higher zinc and silver sales and c) increased by-product realisations. On the negative side, production was affected by the planned maintenance shutdown at Tuticorin, water shortage at HZL plants and low-grade ore from Rampura Agucha mine. During the quarter, the company also sold 480mn units of merchant power (287mn units in 1QFY2010) due to the closure of the Balco 1 plant. Average power realisation was lower at Rs4.98/unit (Rs5.43/unit in 1QFY2010). The company’s operating profit was boosted by lower cost in the copper segment; however, it was negatively affected by a) increased staff cost (additional gratuity provision and long-term wage settlement), b) higher stripping cost and c) increased alumina, power, coal and coke costs. EBITDA margin expanded by 292bp yoy to 24.5%, which led to EBITDA growing by 48.3% to Rs1,452cr. Other income grew by 64.6% to Rs692cr, boosted by gain of Rs165cr on FCCBs, thus increasing net profit by 49.9% yoy to Rs1,008cr. Segmental performance Copper segment was better placed in 1QFY2011 Copper cathode production during 1QFY2011 was flat at 77,000 tonnes due to a planned maintenance shutdown at Tuticorin smelter. Mined metal from the Australian mine was 7,000 tonnes during the quarter. Revenue for the segment was Rs2,096cr, up 33.5% yoy, mainly led by higher metal prices. Moreover, owing to an improvement in copper TC/RC margins, which increased to 13.5 per USc/lb (11.9 per USc/lb) along with improved copper recoveries and higher byproduct realisations, the copper segment’s EBIT reported 100% yoy growth. Average acid realisation during 1QFY2011 improved to Rs3,332/tonne as compared to Rs227/tonne in 1QFY2010. From 2QFY2011E, management expects acid realisations to be around Rs2000/tonne. Exhibit 3: Copper EBIT margins expanded by 214bp yoy 250 7 6 200 5 150 4 (Rs cr) (%) 100 3 2 50 1 0 0 1QFY10 2QFY10 3QFY10 4QFY10 1QFY11 EBIT (LHS) EBIT margins (RHS) Source: Company, Angel Research July 26 2010 4
  • 5. Sterlite Industries | 1QFY2011 Result Update Poor performance by the aluminium business Balco’s aluminium production was down 12% yoy to 63,000 tonnes, whereas production at VAL was up by 45% at 77,000 tonnes. The aluminium segment’s revenue, at Rs666cr, was up 8.3% yoy. However, profitability was affected by a) increased alumina costs, b) higher power cost, c) additional gratuity provisions and d) unabsorbed losses at Balco plant 1. Consequently, the aluminium segment’s EBIT declined by 33.8% yoy to Rs50cr. Exhibit 4: Aluminium EBIT margin affected by higher costs 160 20 120 15 (Rs cr) 80 10 (%) 40 5 0 0 1QFY10 2QFY10 3QFY10 4QFY10 1QFY11 EBIT (LHS) EBIT margins (RHS) Source: Company, Angel Research Zinc and lead segment – Higher metal prices negate lower volumes Despite production being lower, revenue from the zinc and lead segments grew by 29.5% yoy to Rs1,928cr mainly on account of higher realisations and higher zinc sales on account of the commissioning of the 210ktpa zinc smelter at Rajpura Dariba during 4QFY2010, which produced 33,000 tonnes during the quarter. However, due to higher costs, EBIT margin was flat at 46.9% yoy. Exhibit 5: EBIT margins affected by higher stripping and staff costs 2,000 70 60 1,500 50 40 (Rs cr) 1,000 (%) 30 500 20 10 0 0 1QFY10 2QFY10 3QFY10 4QFY10 1QFY11 EBIT (LHS) EBIT margins (RHS) Source: Company, Angel Research July 26 2010 5
  • 6. Sterlite Industries | 1QFY2011 Result Update Expansion plans Aluminium The 325ktpa aluminium smelter project at Balco is expected to be commissioned in 4QFY2011. Construction of the 1,200MW captive power plant is progressing well and the first unit is expected to be commissioned in 3QFY2011, with the remaining three units to be progressively commissioned by 2QFY2012. Power The first 600MW unit of the 2400 MW (600MW x 4) coal-based commercial power plant at Jharsuguda is expected to start commercial production in September 2010. The remaining three units are expected to be progressively commissioned by the end of 1QFY2012. The EPC contract for the 1,980MW supercritical IPP project at Talwandi Sabo has been signed and equipment has been ordered accordingly. The first unit is expected to be commissioned by 4QFY2013 and the overall project completion is expected by 2QFY2014. Zinc The 100ktpa lead smelter at Rajpura Dariba is expected to be commissioned by 2QFY2011E. The 80MW captive power plant was commissioned in June 2010. The second 80MW power plant is expected to be commissioned by September 2010. The Sindesar Khurd mine project is on schedule with production expected to commence from 2QFY2011. Investment Rationale Robust expansion plan in metal and power: We believe the company is well poised to capitalise on strong metal demand as it expands its zinc and lead capacity to 1.1mn tonnes and silver capacity to 500ktpa. Moreover, the company is also increasing its aluminium capacity by 325ktpa and its power capacity by 2,400MW (through its 100% subsidiary Sterlite Energy), benefits of which are likely to be witnessed in FY2012E. Balco and HZL minority stake buyout, clearance for Niyamgiri mine still awaited Sterlite has been in the process of buying the minority stake in Balco and HZL. We believe any positive development on this front would provide further upside to our target price. Moreover, it has been in the process of availing mining clearances for its Niyamgiri bauxite mine which in our view would lower the cost of production at Vedanta Aluminium, thereby leading to substantial improvement in earnings. July 26 2010 6
  • 7. Sterlite Industries | 1QFY2011 Result Update Valuation Sterlite is currently trading at 6.5x and 4.4x FY2011E and FY2012E EV/EBITDA, respectively. We have revised our FY2011E and FY2012E estimates to factor in lower metal prices at LME, lower sales volume estimates and other bookkeeping changes. We maintain a Buy on the stock with a revised Target Price of Rs228 (earlier Rs245). Exhibit 6: Key assumptions LME prices (US $/tonne) FY11E FY12E Aluminium 2,100 2,100 Copper 6,500 6,500 Zinc 1,975 2,050 Lead 1,925 2,000 Silver (Rs/kg) 25,500 25,500 Sales volume (tonnes) Aluminium 297,600 496,000 Copper 348,750 348,750 Zinc metal 682,100 747,150 Lead metal 80,100 125,450 Silver (kg) 180,000 270,000 Source: Company, Angel research July 26 2010 7
  • 8. Sterlite Industries | 1QFY2011 Result Update Exhibit 7: SOTP valuation (Rs cr) Valuation Target multiple Equity Sterlite's Subsidiary % Stake Value/share method (x) value value Sterlite standalone EV/EBIDTA 5.5 16,331 100% 16,331 49 (including US $1.6bn raised) Balco EV/EBIDTA 7.0 12,248 51% 6,246 19 Vedanta Aluminium EV/EBIDTA 7.0 44,094 29.5% 13,008 39 Hindustan Zinc EV/EBIDTA 5.0 51,835 64.9% 33,641 100 Sterlite Energy FCFE 1.0 6,406 100% 6,406 19 Tasmania copper mines P/BV 1.0 1,009 100% 1,009 3 Target price (Rs) 228 Source: Angel Research Exhibit 8: Change in estimates (Rs cr) Earlier estimates Revised estimates Upgrade/(downgrade) (%) FY11E FY12E FY11E FY12E FY11E FY12E Net sales 28,845 32,994 27,542 33,639 (4.5) 2.0 EBITDA 8,556 10,416 7,811 10,675 (8.7) 2.5 EBITDA margin (%) 29.7 31.6 28.4 31.7 (134bp) 13bp PBT 9,237 11,014 8,375 11,324 (9.3) 2.8 Net income 5,749 6,443 4,799 6,625 (16.5) 2.8 Net margin (%) 19.9 19.5 17.4 19.7 (251bp) 17bp Diluted EPS (Rs) 17.1 19.2 14.3 19.7 19.7 (2.7) Source: Company, Angel Research Exhibit 9: EPS - Angel forecast vs. consensus Year (%) Angel forecast Bloomberg consensus Variation (%) FY11E 14.3 21.2 (32.6) FY12E 19.7 25.5 (22.7) Source: Bloomberg, Angel Research Exhibit 10: EV/EBITDA band 140,000 14x 120,000 100,000 11x 80,000 (Rs cr) 8x 60,000 5x 40,000 20,000 2x 0 Apr-06 Apr-07 Apr-08 Apr-09 Apr-10 Source: Bloomberg, Angel Research July 26 2010 8
  • 9. Sterlite Industries | 1QFY2011 Result Update Exhibit 11: P/E band 450 400 350 300 20x 250 (Rs) 15x 200 150 10x 100 5x 50 0 Apr-06 Apr-07 Apr-08 Apr-09 Apr-10 Source: Bloomberg, Angel Research Exhibit 12: P/BV band 500 450 3.5x 400 350 2.5x 300 (Rs) 250 200 1.5x 150 100 0.5x 50 0 Apr-06 Apr-07 Apr-08 Apr-09 Apr-10 Source: Bloomberg, Angel Research Exhibit 13: Recommendation summary Target Company CMP Reco. Mcap Upside P/E (x) P/BV (x) EV/EBITDA (x) RoE (%) RoCE (%) Price (Rs) (Rs) (Rs cr) (%) FY11E FY12E FY11E FY12E FY11E FY12E FY11E FY12E FY11E FY12E SAIL 208 - Neutral 85,830 - 13.4 12.5 2.3 2.0 8.5 7.8 18.2 17.0 17.2 16.9 Tata Steel 532 697 Buy 47,190 31.0 8.7 9.3 1.5 1.3 6.7 6.1 17.9 14.7 11.8 11.7 JSW Steel 1,170 1,360 Buy 21,888 16.2 10.8 9.1 2.0 1.6 7.0 5.5 22.1 21.3 15.0 16.7 Sesa Goa 366 - Neutral 30,390 - 7.2 7.5 2.5 1.9 3.9 3.1 45.9 31.5 43.7 34.7 NMDC 261 247 Reduce 103,618 (5.5) 14.4 12.0 5.2 3.9 9.0 7.0 41.8 36.7 55.7 48.3 Hindalco 156 208 Buy 29,767 33.7 8.1 7.7 1.2 1.0 5.6 5.4 15.3 14.1 10.4 10.0 Nalco 434 316 Sell 27,947 (27.1) 27.4 23.2 2.6 2.4 15.9 12.4 9.7 10.7 10.7 12.5 Sterlite 174 228 Buy 58,542 30.9 12.2 8.8 1.3 1.2 6.5 4.4 11.6 14.2 11.1 14.1 Hindustan Zinc 1,001 1,227 Buy 42,298 22.6 10.4 8.0 1.9 1.6 5.7 3.6 20.4 21.6 20.7 22.3 Source: Angel Research July 26 2010 9
  • 10. Sterlite Industries | 1QFY2011 Result Update Profit & Loss Statement (Consolidated) Y/E March (Rs cr) FY2007 FY2008 FY2009 FY2010 FY2011E FY2012E Gross sales 26,193 26,872 22,774 26,533 30,603 37,377 Less: Excise duty 1,806 2,167 1,629 2,123 3,060 3,738 Net Sales 24,387 24,705 21,144 24,410 27,542 33,639 Other operating income - - - - - - Total operating income 24,387 24,705 21,144 24,410 27,542 33,639 % chg 85.8 1.3 (14.4) 15.4 12.8 22.1 Total expenditure 14,928 16,837 16,440 18,339 19,731 22,964 Net raw materials 10,498 11,771 10,634 12,169 13,396 15,732 Other Mfg costs 3,881 4,407 5,050 5,316 5,233 5,887 Personnel 549 659 756 854 1,102 1,346 Other EBITDA 9,459 7,868 4,704 6,072 7,811 10,675 % chg 156.3 (16.8) (40.2) 29.1 28.7 36.7 (% of net sales) 38.8 31.8 22.2 24.9 28.4 31.7 Depreciation 804 595 701 750 1,131 1,227 EBIT 8,655 7,273 4,003 5,322 6,680 9,448 % chg 173.6 (16.0) (45.0) 32.9 25.5 41.4 (% of net sales) 35.5 29.4 18.9 21.8 24.3 28.1 Interest charges 379 319 397 342 784 814 Other income 682 1,566 2,154 1,959 2,479 2,691 (% of PBT) 7.6 18.4 37.4 28.2 29.6 23.8 Share in profit of - - - - - - associates Recurring PBT 8,958 8,521 5,760 6,939 8,375 11,324 % chg 174.6 (4.9) (32.4) 20.5 20.7 35.2 Extraordinary (157.2) (52.8) 55.3 (297.0) - - inc/(expense) PBT (reported) 8,800 8,468 5,816 6,642 8,375 11,324 Tax 2,473 2,103 855 1,233 1,842 2,491 (% of PBT) 28.1 24.8 14.7 18.6 22.0 22.0 PAT (reported) 6,327 6,365 4,961 5,409 6,532 8,833 Add: Share of earnings of (0) (4) (154) 59 (100) - associate Less: Minority interest 1,904 1,962 1,267 1,724 1,633 2,208 Extraordinary - - - - - - expense/(inc.) Net Income 4,422 4,399 3,540 3,744 4,799 6,625 Adj. Net Income 4,536 4,439 3,493 3,986 4,799 6,625 % chg 170.3 (2.1) (21.3) 14.1 20.4 38.0 (% of net sales) 18.6 18.0 16.5 16.3 17.4 19.7 Basic EPS (Rs) 20.3 15.7 12.3 11.9 14.3 19.7 Fully Diluted EPS (Rs) 20.3 15.7 12.3 11.9 14.3 19.7 % chg (72.9) (22.9) (21.3) (3.8) 20.4 38.0 July 26 2010 10
  • 11. Sterlite Industries | 1QFY2011 Result Update Balance Sheet (Consolidated) Y/E March (Rs cr) FY2007 FY2008 FY2009 FY2010 FY2011E FY2012E SOURCES OF FUNDS Equity share capital 112 142 142 168 168 168 Reserves & surplus 9,870 22,161 26,628 39,225 43,463 49,312 Shareholders funds 9,982 22,303 26,770 39,393 43,631 49,480 Share warrants - - - - - - Minority interest 3,626 5,623 5,623 5,623 5,623 5,623 Total loans 4,610 5,075 7,075 10,575 13,075 13,575 Deferred tax liability 917 1,354 1,354 1,354 1,354 1,354 Total liabilities 19,135 34,354 40,822 56,944 63,682 70,032 APPLICATION OF FUNDS Gross block 12,641 14,564 17,064 20,564 23,564 25,564 Less: Acc. depreciation 4,324 4,588 5,289 6,039 7,170 8,397 Net block 8,318 9,975 11,775 14,525 16,394 17,167 Capital work-in-progress 1,400 2,461 3,961 5,461 6,461 7,461 Goodwill - - - - - - Investments 5,222 16,294 16,294 16,294 16,294 16,294 Current assets 9,059 10,663 13,861 25,949 30,029 35,089 Cash 1,113 2,454 5,883 17,375 20,967 24,974 Loans & advances 3,484 3,314 3,314 3,314 3,314 3,314 Other 4,462 4,896 4,665 5,261 5,749 6,801 Current liabilities 4,864 5,040 5,070 5,285 5,497 5,980 Net current assets 4,196 5,623 8,792 20,664 24,533 29,110 Mis. exp. not written off 0.0 0.0 0.0 0.0 0.0 0.0 Total assets 19,135 34,354 40,822 56,944 63,682 70,032 July 26 2010 11
  • 12. Sterlite Industries | 1QFY2011 Result Update Cash Flow Statement (Consolidated) Y/E March (Rs cr) FY2007 FY2008 FY2009 FY2010 FY2011E FY2012E Profit before tax 8,800 8,468 5,816 6,642 8,375 11,324 Depreciation 804 595 701 750 1,131 1,227 Change in working (1,567) (87) 261 (380) (277) (569) capital Less: Other income (1,905) (1,966) (1,421) (1,665) (1,733) (2,208) Direct taxes paid 2,473 2,103 855 1,233 1,842 2,491 Cash Flow from 3,660 4,907 4,501 4,113 5,653 7,283 operations (Inc.)/ Dec. in fixed (1,840) (2,984) (4,000) (5,000) (4,000) (3,000) assets (Inc.)/ Dec. in (2,727) (11,072) 0 - - - investments (Inc.)/ Dec. in loans - - - - - - and advances Other income - - - - - - Cash Flow from (4,567) (14,056) (4,000) (5,000) (4,000) (3,000) investing Issue of equity (171.7) 8,051 - 7,680 - - Inc./(Dec.) in loans (555) 464 2,000 3,500 2,500 500 Dividend Paid (incl. 223 283 248 466 562 775 tax) Others (1,856) (2,257) (1,176) (1,665) - - Cash Flow from 905 10,489 2,928 12,379 1,938 (275) financing Inc./(Dec.) in cash (2) 1,340 3,429 11,492 3,592 4,008 Opening cash 1,115 1,113 2,454 5,883 17,375 20,967 balances Closing cash balances 1,113 2,454 5,883 17,375 20,967 24,974 July 26 2010 12
  • 13. Sterlite Industries | 1QFY2011 Result Update Key Ratios Y/E March FY2007 FY2008 FY2009 FY2010 FY2011E FY2012E Valuation Ratio (x) P/E (on FDEPS) 8.6 11.1 14.1 14.7 12.2 8.8 P/CEPS 7.3 9.8 11.8 12.4 9.9 7.5 P/BV 3.9 2.2 1.8 1.5 1.3 1.2 Dividend yield (%) 1.0 0.9 0.8 0.8 1.0 1.3 EV/Sales 1.7 2.1 2.4 2.1 1.8 1.4 EV/EBITDA 4.5 6.6 10.7 8.5 6.5 4.4 EV/Total assets 2.2 1.5 1.2 0.9 0.8 0.7 Per Share Data (Rs) EPS (Basic) 20.3 15.7 12.3 11.9 14.3 19.7 EPS (fully diluted) 20.3 15.7 12.3 11.9 14.3 19.7 Cash EPS 23.9 17.8 14.8 14.1 17.6 23.4 DPS 1.7 1.6 1.4 1.4 1.7 2.3 Book Value 44.7 78.6 94.5 117.2 129.9 147.3 Dupont Analysis EBIT margin 35.5 29.4 18.9 21.8 24.3 28.1 Tax retention ratio (%) 71.9 75.2 85.3 81.4 78.0 78.0 Asset turnover (x) 1.5 0.8 0.7 0.7 0.8 0.9 RoIC (post-tax) 37.4 18.6 11.0 12.7 14.4 19.6 Cost of Debt (post tax) 5.6 4.9 5.6 - - - Leverage (x) 0.4 0.1 0.0 - - - Operating RoE 49.5 20.0 11.1 12.7 14.4 19.6 Returns (%) RoCE (Pre-tax) 52.7 27.2 10.7 10.9 11.1 14.1 Angel RoIC (pre-tax) 60.9 31.6 13.3 16.4 19.0 25.6 RoE 56.5 27.5 14.2 12.0 11.6 14.2 Turnover ratios (x) Asset turnover (gross 2.0 1.8 1.3 1.3 1.2 1.4 block) Inventory (days) 68 71 70 70 70 70 Receivables (days) 24 23 25 25 25 25 Payables (days) 22 29 30 30 30 30 WC capital cycle (days) 34 46 52 46 45 42 Solvency ratios (x) Net debt to equity 0.4 0.1 0.0 (0.2) (0.2) (0.2) Net debt to EBITDA 0.4 0.3 0.0 (1.4) (1.2) (1.1) Interest Coverage 22.8 22.8 10.1 15.5 8.5 11.6 July 26 2010 13
  • 14. Sterlite Industries | 1QFY2011 Result Update Research Team Tel: 022 - 4040 3800 E-mail: research@angeltrade.com Website: www.angeltrade.com DISCLAIMER This document is solely for the personal information of the recipient, and must not be singularly used as the basis of any investment decision. Nothing in this document should be construed as investment or financial advice. Each recipient of this document should make such investigations as they deem necessary to arrive at an independent evaluation of an investment in the securities of the companies referred to in this document (including the merits and risks involved), and should consult their own advisors to determine the merits and risks of such an investment. Angel Broking Limited, its affiliates, directors, its proprietary trading and investment businesses may, from time to time, make investment decisions that are inconsistent with or contradictory to the recommendations expressed herein. The views contained in this document are those of the analyst, and the company may or may not subscribe to all the views expressed within. Reports based on technical and derivative analysis center on studying charts of a stock's price movement, outstanding positions and trading volume, as opposed to focusing on a company's fundamentals and, as such, may not match with a report on a company's fundamentals. The information in this document has been printed on the basis of publicly available information, internal data and other reliable sources believed to be true, but we do not represent that it is accurate or complete and it should not be relied on as such, as this document is for general guidance only. Angel Broking Limited or any of its affiliates/ group companies shall not be in any way responsible for any loss or damage that may arise to any person from any inadvertent error in the information contained in this report. Angel Broking Limited has not independently verified all the information contained within this document. Accordingly, we cannot testify, nor make any representation or warranty, express or implied, to the accuracy, contents or data contained within this document. While Angel Broking Limited endeavours to update on a reasonable basis the information discussed in this material, there may be regulatory, compliance, or other reasons that prevent us from doing so. This document is being supplied to you solely for your information, and its contents, information or data may not be reproduced, redistributed or passed on, directly or indirectly. Angel Broking Limited and its affiliates may seek to provide or have engaged in providing corporate finance, investment banking or other advisory services in a merger or specific transaction to the companies referred to in this report, as on the date of this report or in the past. Neither Angel Broking Limited, nor its directors, employees or affiliates shall be liable for any loss or damage that may arise from or in connection with the use of this information. Note: Please refer to the important `Stock Holding Disclosure' report on the Angel website (Research Section). Also, please refer to the latest update on respective stocks for the disclosure status in respect of those stocks. Angel Broking Limited and its affiliates may have investment positions in the stocks recommended in this report. Disclosure of Interest Statement Sterlite Industries 1. Analyst ownership of the stock No 2. Angel and its Group companies ownership of the stock No 3. Angel and its Group companies' Directors ownership of the stock No 4. Broking relationship with company covered No Note: We have not considered any Exposure below Rs 1 lakh for Angel, its Group companies and Directors. Ratings (Returns) : Buy (> 15%) Accumulate (5% to 15%) Neutral (-5 to 5%) Reduce (-5% to 15%) Sell (< -15%) July 26 2010 14