Download to read offline
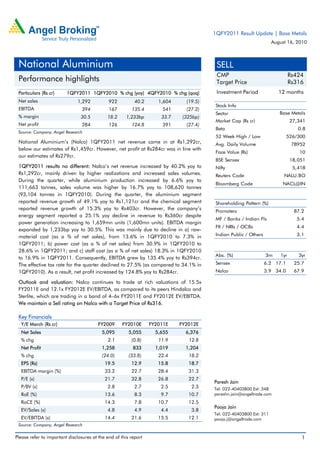


National Aluminium's (Nalco) net revenue in 1QFY2011 increased 40.2% year-over-year to Rs. 1,292 crore, driven by higher realizations and sales volumes. Net profit increased 124.8% to Rs. 284 crore. EBITDA margin expanded significantly to 30.5% due to declines in raw material, power, and staff costs. While aluminum and chemical segments saw revenue growth, the energy segment's revenue declined 25.1% despite higher power generation. The company continues to face challenges around coal supply and has limited growth visibility beyond current expansion plans.


