1. 4QFY2010 Result Update I Real Estate
May 17, 2010
DLF NEUTRAL
CMP Rs287
Performance Highlights Target Price -
DLF reported 4QFY2010 results that were marginally below our expectations, Investment Period -
on account of higher interest and tax expenses. The DAL/Caraf merger and
purchase of Compulsorily Convertible Preference shares (CCPS), which were Stock Info
earlier issued by DAL to SC Asia (to the tune of Rs3,085cr), are set to increase
Sector Real Estate
the net debt level to 0.65-0.75x in 1QFY2011 from the current level of 0.53x.
The monetising from non-core assets was Rs1,800cr (much below initial Market Cap (Rs cr) 48,707
guidance) in FY2010, of which Rs566cr was reported in 4Q. The
Beta 1.8
management has given strong sales volume guidance of 15-18mn sq ft in
FY2011E. We believe that the stock’s performance hinges on recovery in the 52 WK High / Low 491/259
commercial segment, non-core assets sales and successful new launches,
which can hive off the high debt level. We recommend a Neutral on the stock. Avg. Daily Volume 3207926
Face Value (Rs) 2
Strong growth, albeit on low base: Revenues for 4QFY2010 grew by 77.7%
yoy to Rs1,994cr, driven by an improvement in volumes and pricing in the BSE Sensex 16,836
residential segment, albeit on a low base; however, they declined by 1.6% Nifty 5,060
qoq. Operating margins came in at 50.1%, higher by 851bp qoq and
3,637bp yoy, on account of revenue recognition from the Shivaji Road project Reuters Code DLFL.BO
in Delhi, where margins were in the mid-40s. Interest costs grew by 93.6% yoy
Bloomberg Code DLFU@IN
to Rs315cr, as a result of increased leverage due to the DLF-DAL integration.
The tax rate stood at 31.8% in 4QFY2010 (against 0% in 4QFY2009 and Shareholding Pattern (%)
26.6% in 3QFY2010). Consequently, the reported PAT came in at Rs426cr, up
by 168% yoy but down by 8.9% qoq. Promoters 78.6
MF/Banks/Indian FIs 2.3
Outlook and Valuation: We estimate DLF to sell 16.4mn sq ft in FY2011E, of FII/NRIs/OCBs 14.9
which 13mn sq ft is from the residential segment. In our view, there is a
limited upside to our launch estimates, considering the steep price rise in Indian Public 4.2
recent months. We have assumed a 5% reduction in commercial and retail Abs. (%) 3m 1yr 3yr
prices, but a 5% rise in residential prices, from current level, in FY2011E. DLF
has underperformed the Sensex over the last six months, on concerns of a Sensex 2.5 38.3 22.0
weak operating cash flow and increasing gearing levels. The stock is trading
at a 4% discount to our 1-year forward NAV of Rs298. Hence, we recommend DLF (6.1) 11.2 (49.7)*
a Neutral on the stock.
*Since listing on July 5, 2007
Key Financials (Consolidated)
Y/E March (Rs cr) FY2009 FY2010E FY2011E FY2012E
Net Sales 10,035 7,421 9,668 14,413
% chg (30.5) (26.1) 30.3 49.1
Net Profit 4,470 1,730 2,338 4,049
% chg (42.8) (61.3) 35.1 73.2
EBITDA Margin (%) 55.8 47.2 46.6 50.4
FDEPS (Rs) 26.2 10.2 13.8 23.9
P/E (x) 10.9 28.2 20.8 12.0
P/BV (x) 2.0 1.6 1.5 1.3
RoE (%) 19.9 6.2 7.2 11.5
RoCE (%) 14.6 6.7 7.4 11.7
Param Desai
EV/Sales (x) 6.4 9.4 7.1 4.8
Tel: 022 – 4040 3800 Ext: 310
EV/EBITDA (x) 11.4 19.8 15.2 9.4
E-mail: paramv.desai@angeltrade.com
Source: Company, Angel Research
1
Please refer to important disclosures at the end of this report Sebi Registration No: INB 010996539
2. DLF 4QFY2010 Result Update
Exhibit 1: 4QFY2010 Performance (Consolidated)
(Rs cr) 3QFY10 4QFY09 4QFY10 %yoy %qoq
Revenues 2,026 1,122 1,994 77.7 (1.6)
Total expenditure 1,183 968 994 2.8 (15.9)
EBIDTA 843 155 1,000 546.9 18.6
EBIDTA margin (%) 41.6 13.8 50.1 3,637bp 851bp
Depreciation 80 52 95 83.4 18.4
Interest 257 163 315 93.6 22.5
Other income 126 229 152 (33.8) 20.4
PBT 633 170 742 337.9 17.4
Tax 168 (0) 236 40.3
Tax rate (%) 26.6 (0.1) 31.8
Share of ass / Minority Int/ EO 4 (11) (80)
Adj PAT 464 170 506 198.3 9.1
PAT margin (%) 22.9 15.1 25.4 1026bp 247bp
Reported PAT 468 159 426 168.1 (8.9)
Reported EPS (Rs) 2.8 0.9 2.5
Source: Company, Angel Research
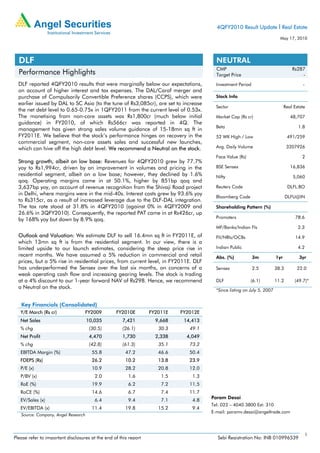
Deleveraging holds the key for the stock’s performance
The DAL/Caraf merger and purchase of Compulsorily Convertible Preference shares
(CCPS), which were earlier issued by DAL to SC Asia (to the tune of Rs3,085cr), are
set to increase the net debt level to 0.65-0.75x from the current level of 0.53x. This
will result in gross debt of ~Rs24,000cr by the end of 1QFY2011E. DLF repaid
Rs5,600cr debt in FY2010, against the mandatory debt payable of Rs3,550cr. Debt
repayments due in FY2011E are Rs26bn. DLF is targeting to reduce its net
debt/equity to 0.4-0.5x by the end of FY2011E. The reduction in the gearing level
will depend on hiving off non-core assets, successfully new launches, like the
Mumbai NTC mill, and a recovery in the commercial leasing segment.
Exhibit 2: Integration with DAL/Caraf led to higher Debt
17,000 0.58 0.60
0.48 0.53
15,000
0.48 0.49 0.50
13,000
(Rs cr)
(x)
11,000 0.40
9,000
0.30
7,000
5,000 0.20
4QFY09 1QFY10 2QFY10 3QFY10 4QFY10
Net Debt Net Debt: Equity
Source: Company, Angel Research
May 17, 2010 2
3. DLF 4QFY2010 Result Update
Update on Non-core assets
The monetising from non-core assets was Rs1800cr (much below the initial guidance
of Rs5,500cr in FY2010), of which Rs566cr was reported in 4Q. The management
has decided to retain its wind business, as it is getting 15% post-tax returns on these
assets. In FY2011E, the management has earmarked Rs2,700cr from the sale of
non-core assets, largely from Dwarka (Rs800cr) and TIDCO (Rs900cr).
Expects commercial demand to pick up over the next 12 months
DLF’s non-residential segment accounts for 55% of our GNAV. After the sharp
decline in the past few quarters, capital values have started to strengthen and have
registered marginal appreciation across most micro markets in the NCR. Industry
participants have indicated that the surge in leasing enquiries has come on the back
of a renewed interest from corporates. Recovery in the Commercial and Retail
Segments generally lag a recovery in the economy. Accordingly, we believe that
demand in office space will start picking up from 2HFY2011E onwards. Cushman
and Wakefield estimates pan-India cumulative demand for office space during
CY2009-13E to be 196mn sq ft. We expect a net employee addition of 15% in the
IT/ITES sector over FY2010-12E.
Rental visibility to improve after the merger of DLF-DAL/Caraf
DLF reported ~Rs750cr of rental income in FY2010. After the merger of DLF and
DAL/Caraf, the company has 19mn sq ft of rent-yielding assets, which will generate
Rs1,500-1,600cr of rental income in FY2011E. The company expects to list DAL by
the end of FY2011E, which can be value accretive for DLF shareholders at the lower
cap rate. However, this will depend on a recovery in the commercial leasing
segment.
Execution gradually picking up
DLF has 56 mn sq ft of projects under execution as of 4QFY2010 (compared to
51mn sq ft as of 3QFY2010), as it added 5.4mn sq ft comprising of homes and
commercial complexes in Capital Greens (2mn sq ft), SIEL (0.5mn sq ft) and 2.8mn
sq ft in Bangalore.
Exhibit 3: Projects under construction
60
56
55
51
49
50
(mn sqft)
45
42
40
36
35
30
25
4QFY09 1QFY10 2QFY10 3QFY10 4QFY10
Source: Company, Angel Research
May 17, 2010 3
4. DLF 4QFY2010 Result Update
Outlook and Valuation
DLF has a challenging task in FY2011E to bring down its gearing levels, for getting
fast approvals in order to have successful new launches and for monetizing its non-
core assets at a reasonable value. We estimate DLF to sell 16.4mn sq ft in FY2011E,
of which 13mn sq ft is from the residential segment. In our view, there is a limited
upside to our launch estimates, considering the steep price rise in recent months. We
have assumed a 5% reduction in commercial and retail prices, but a 5% rise in
residential prices, from the current level, in FY2011E. DLF has underperformed the
Sensex over the last six months, on concerns of a weak operating cash flow and
increasing gearing levels. The stock is trading at a 4% discount to our 1-year
forward NAV of 298. Hence, we recommend a Neutral on the stock.
Exhibit 4: Sales assumptions
25.0
22.6
21.8
20.0
16.4
15.0
(mn sqft)
12.4 12.5
10.0
5.0
0.0
FY08 FY09 FY10 FY11E FY12E
Source: Company, Angel Research
May 17, 2010 4
8. DLF 4QFY2010 Result Update
Research Team Tel: 022-4040 3800 E-mail: research@angeltrade.com Website: www.angeltrade.com
DISCLAIMER
This document is solely for the personal information of the recipient, and must not be singularly used as the basis of any investment decision. Nothing in this
document should be construed as investment or financial advice. Each recipient of this document should make such investigations as they deem necessary to
arrive at an independent evaluation of an investment in the securities of the companies referred to in this document (including the merits and risks involved),
and should consult their own advisors to determine the merits and risks of such an investment.
Angel Securities Limited, its affiliates, directors, its proprietary trading and investment businesses may, from time to time, make investment decisions that are
inconsistent with or contradictory to the recommendations expressed herein. The views contained in this document are those of the analyst, and the company
may or may not subscribe to all the views expressed within.
Reports based on technical and derivative analysis center on studying charts of a stock's price movement, outstanding positions and trading volume, as
opposed to focusing on a company's fundamentals and, as such, may not match with a report on a company's fundamentals.
The information in this document has been printed on the basis of publicly available information, internal data and other reliable sources believed to be true,
and are for general guidance only. Angel Securities Limited has not independently verified all the information contained within this document. Accordingly,
we cannot testify, nor make any representation or warranty, express or implied, to the accuracy, contents or data contained within this document. While Angel
Securities Limited endeavours to update on a reasonable basis the information discussed in this material, there may be regulatory, compliance, or other
reasons that prevent us from doing so.
This document is being supplied to you solely for your information, and its contents, information or data may not be reproduced, redistributed or passed on,
directly or indirectly.
Angel Securities Limited and its affiliates may seek to provide or have engaged in providing corporate finance, investment banking or other advisory services
in a merger or specific transaction to the companies referred to in this report, as on the date of this report or in the past.
Neither Angel Securities Limited nor its directors, employees and affiliates shall be liable for any loss or damage that may arise from or in connection with the
use of this information.
Note: Please refer to the important `Stock Holding Disclosure' report on the Angel website (Research Section).
Disclosure of Interest Statement DLF
1. Analyst ownership of the stock No
2. Angel and its Group companies ownership of the stock Yes
3. Angel and its Group companies’ Directors ownership of the stock No
4. Broking relationship with company covered No
Note: We have not considered any Exposure below Rs 1 lakh for Angel and its Group companies.
Address: Acme Plaza, ‘A’ Wing, 3rd Floor, M.V. Road, Opp. Sangam Cinema, Andheri (E), Mumbai - 400 059.
Tel : (022) 3952 4568 / 4040 3800
Angel Broking Ltd: BSE Sebi Regn No : INB 010996539 / CDSL Regn No: IN - DP - CDSL - 234 - 2004 / PMS Regn Code: PM/INP000001546 Angel Securities Ltd:BSE: INB010994639/INF010994639 NSE:
INB230994635/INF230994635 Membership numbers: BSE 028/NSE:09946
Angel Capital & Debt Market Ltd: INB 231279838 / NSE FNO: INF 231279838 / NSE Member code -12798 Angel Commodities Broking (P) Ltd: MCX Member ID: 12685 / FMC Regn No: MCX / TCM /
CORP / 0037 NCDEX : Member ID 00220 / FMC Regn No: NCDEX / TCM / CORP / 0302
May 17, 2010 8