Download as PDF, PPTX
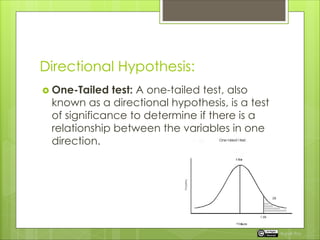
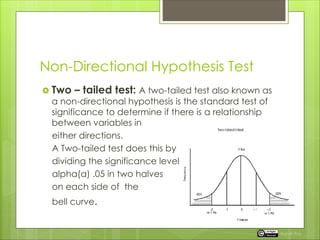
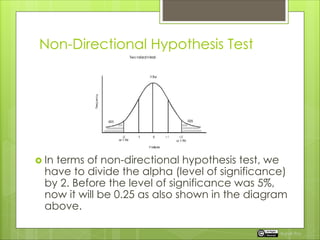
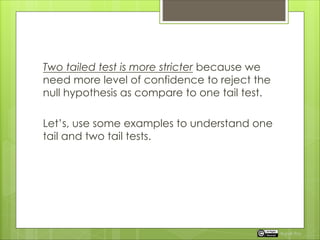
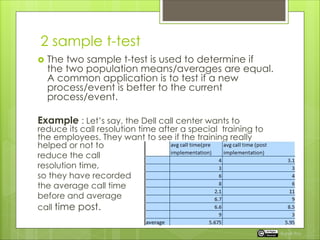
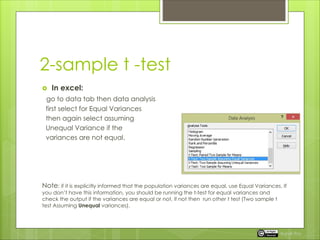
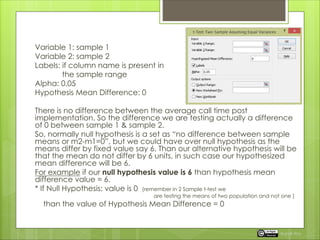
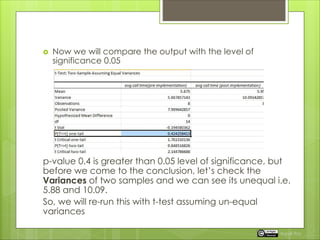
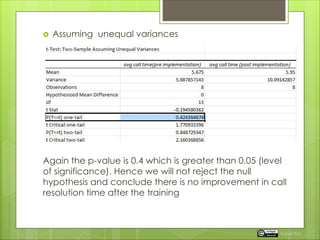
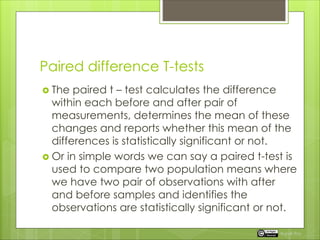
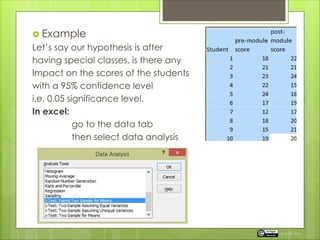
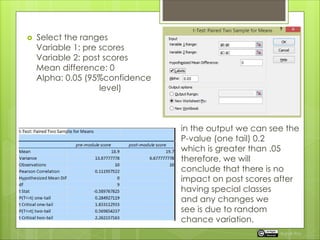
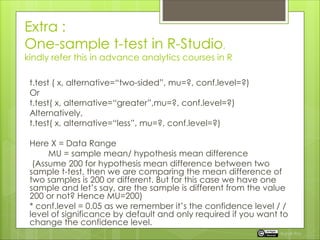
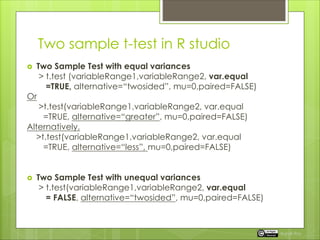
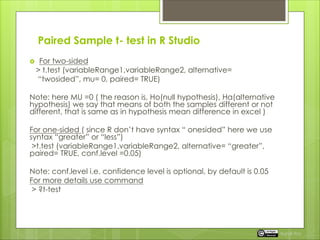
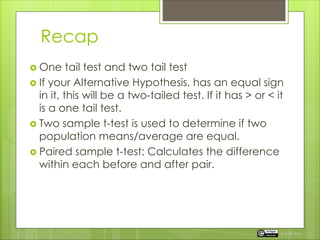


The document explains hypothesis testing, distinguishing between one-tailed (directional) and two-tailed (non-directional) tests, and illustrates their application through examples. It also covers the two-sample t-test and paired t-test for comparing means, explaining how to conduct these tests using Excel and R. Lastly, it highlights the importance of understanding the null and alternative hypotheses and briefly mentions statistical methods like ANOVA for comparing multiple samples.


![[DSC Europe 25] Josip Saban - Career building for data professionals.pptx](https://cdn.slidesharecdn.com/ss_thumbnails/zroflcttkm1vmli0txea-josip-saban-career-building-for-data-professionals-260123083019-587cdb8c-thumbnail.jpg?width=640&height=640&fit=bounds)


![[DSC Europe 25] Ekaterina Bubenko - Behind the Curtain: How Data Roles Collab...](https://cdn.slidesharecdn.com/ss_thumbnails/anmv6x8dstqbbzchoklr-ekaterina-bubenko-behind-the-curtain-how-data-roles-collaborate-in-the-ai-era-a-260123083019-4b252ec7-thumbnail.jpg?width=640&height=640&fit=bounds)


