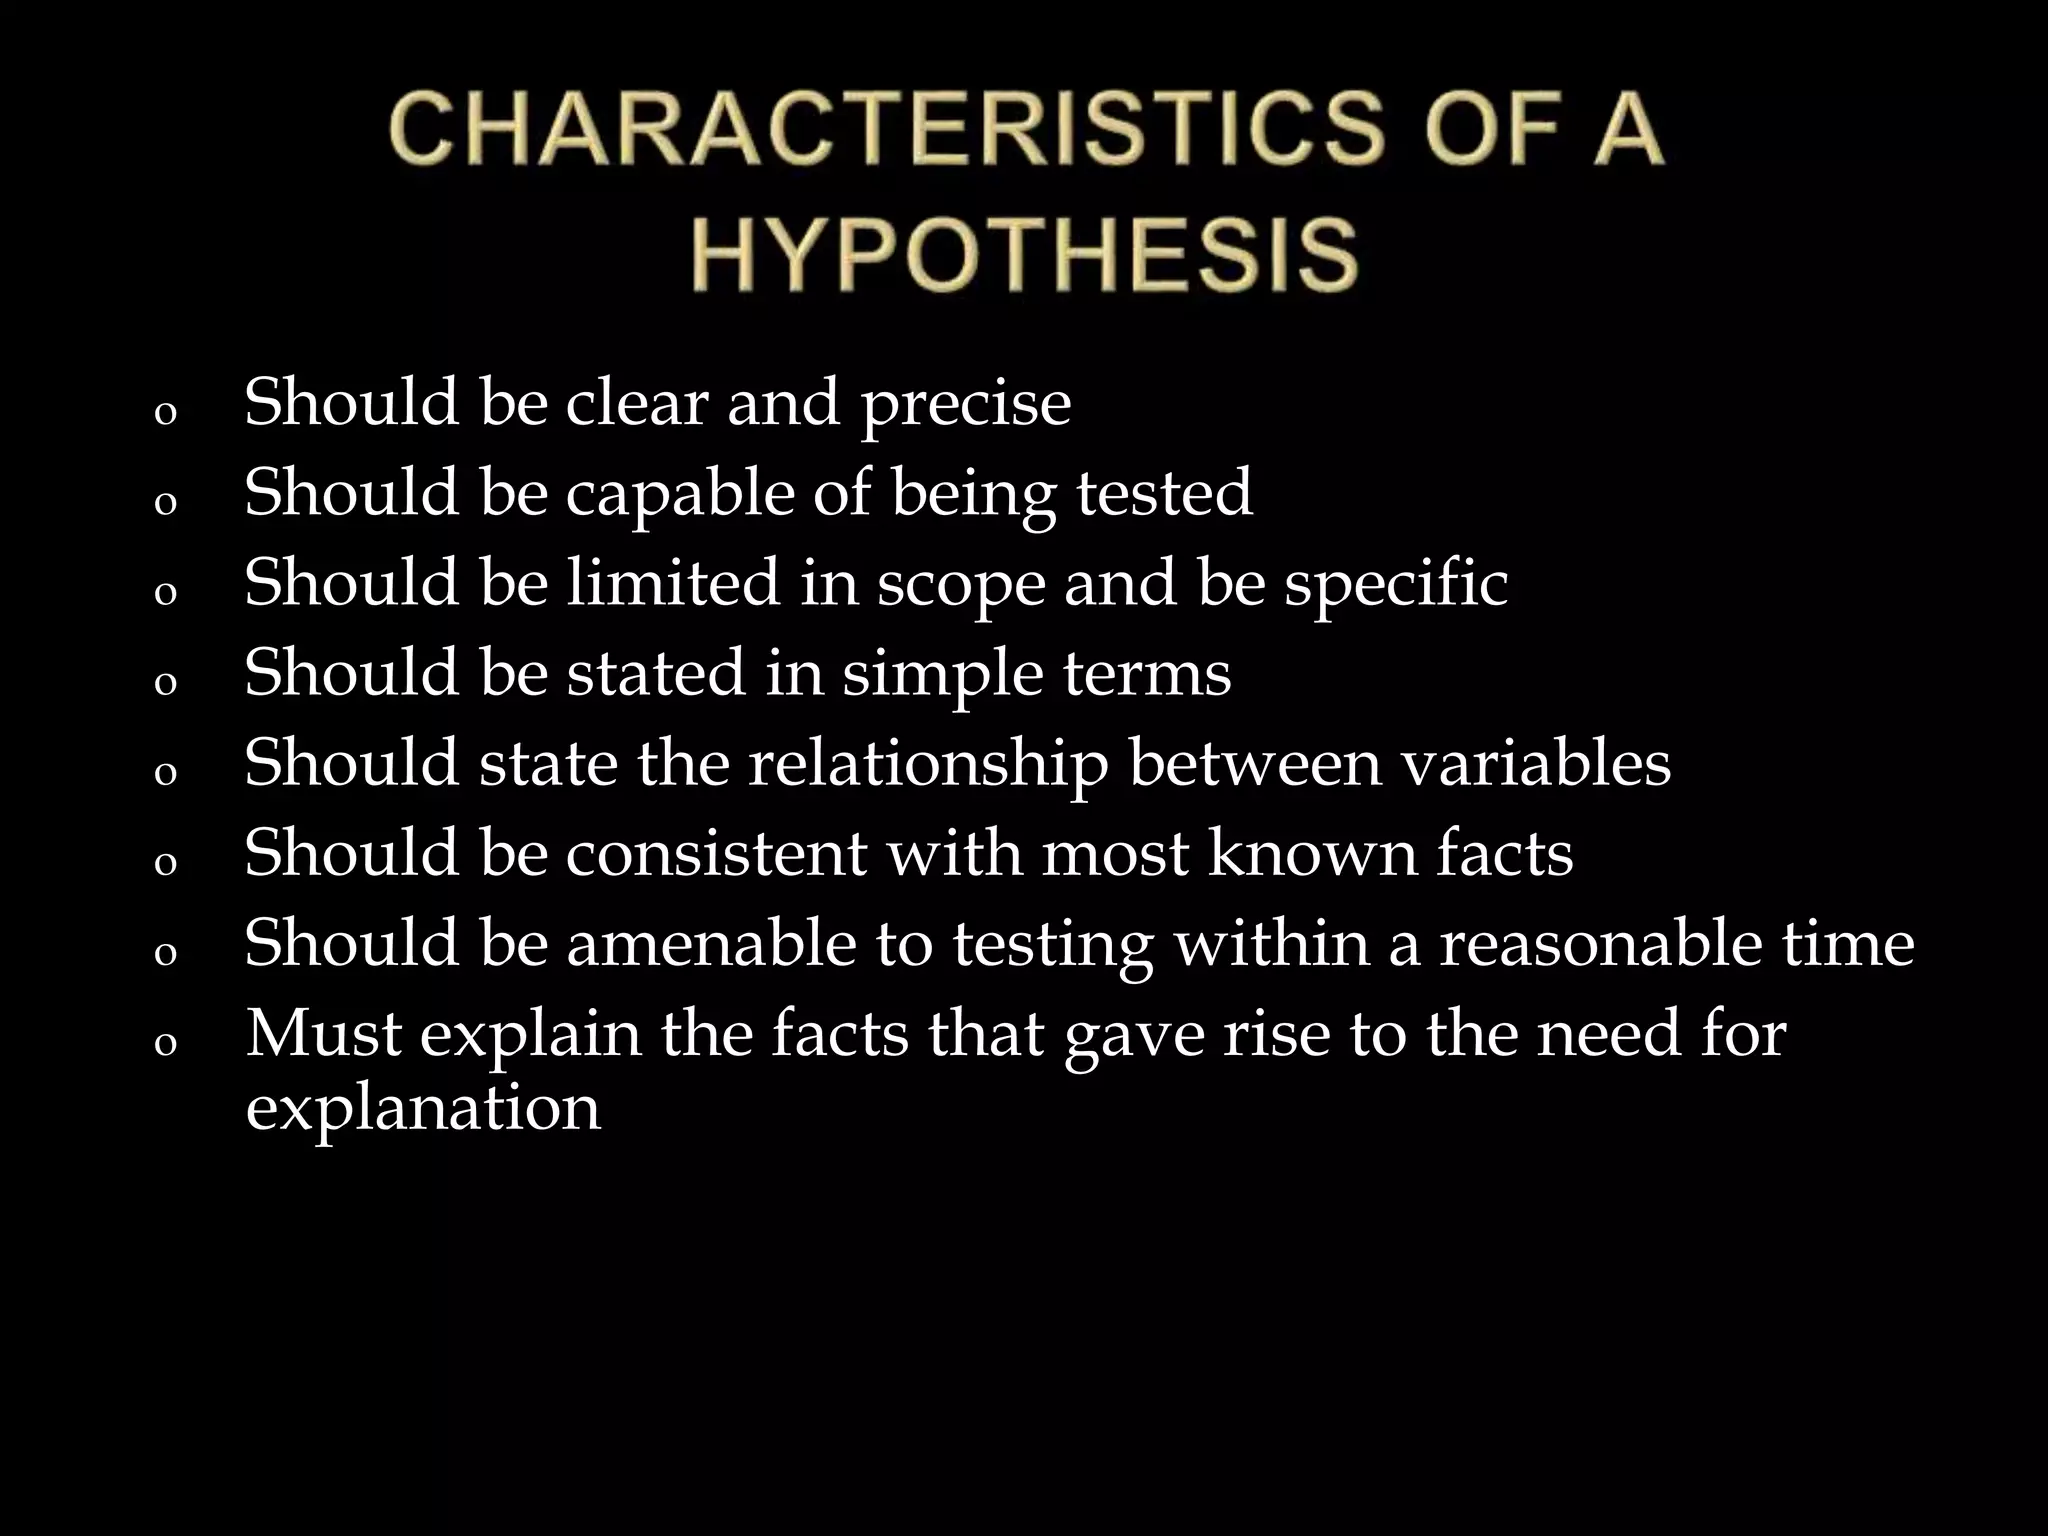
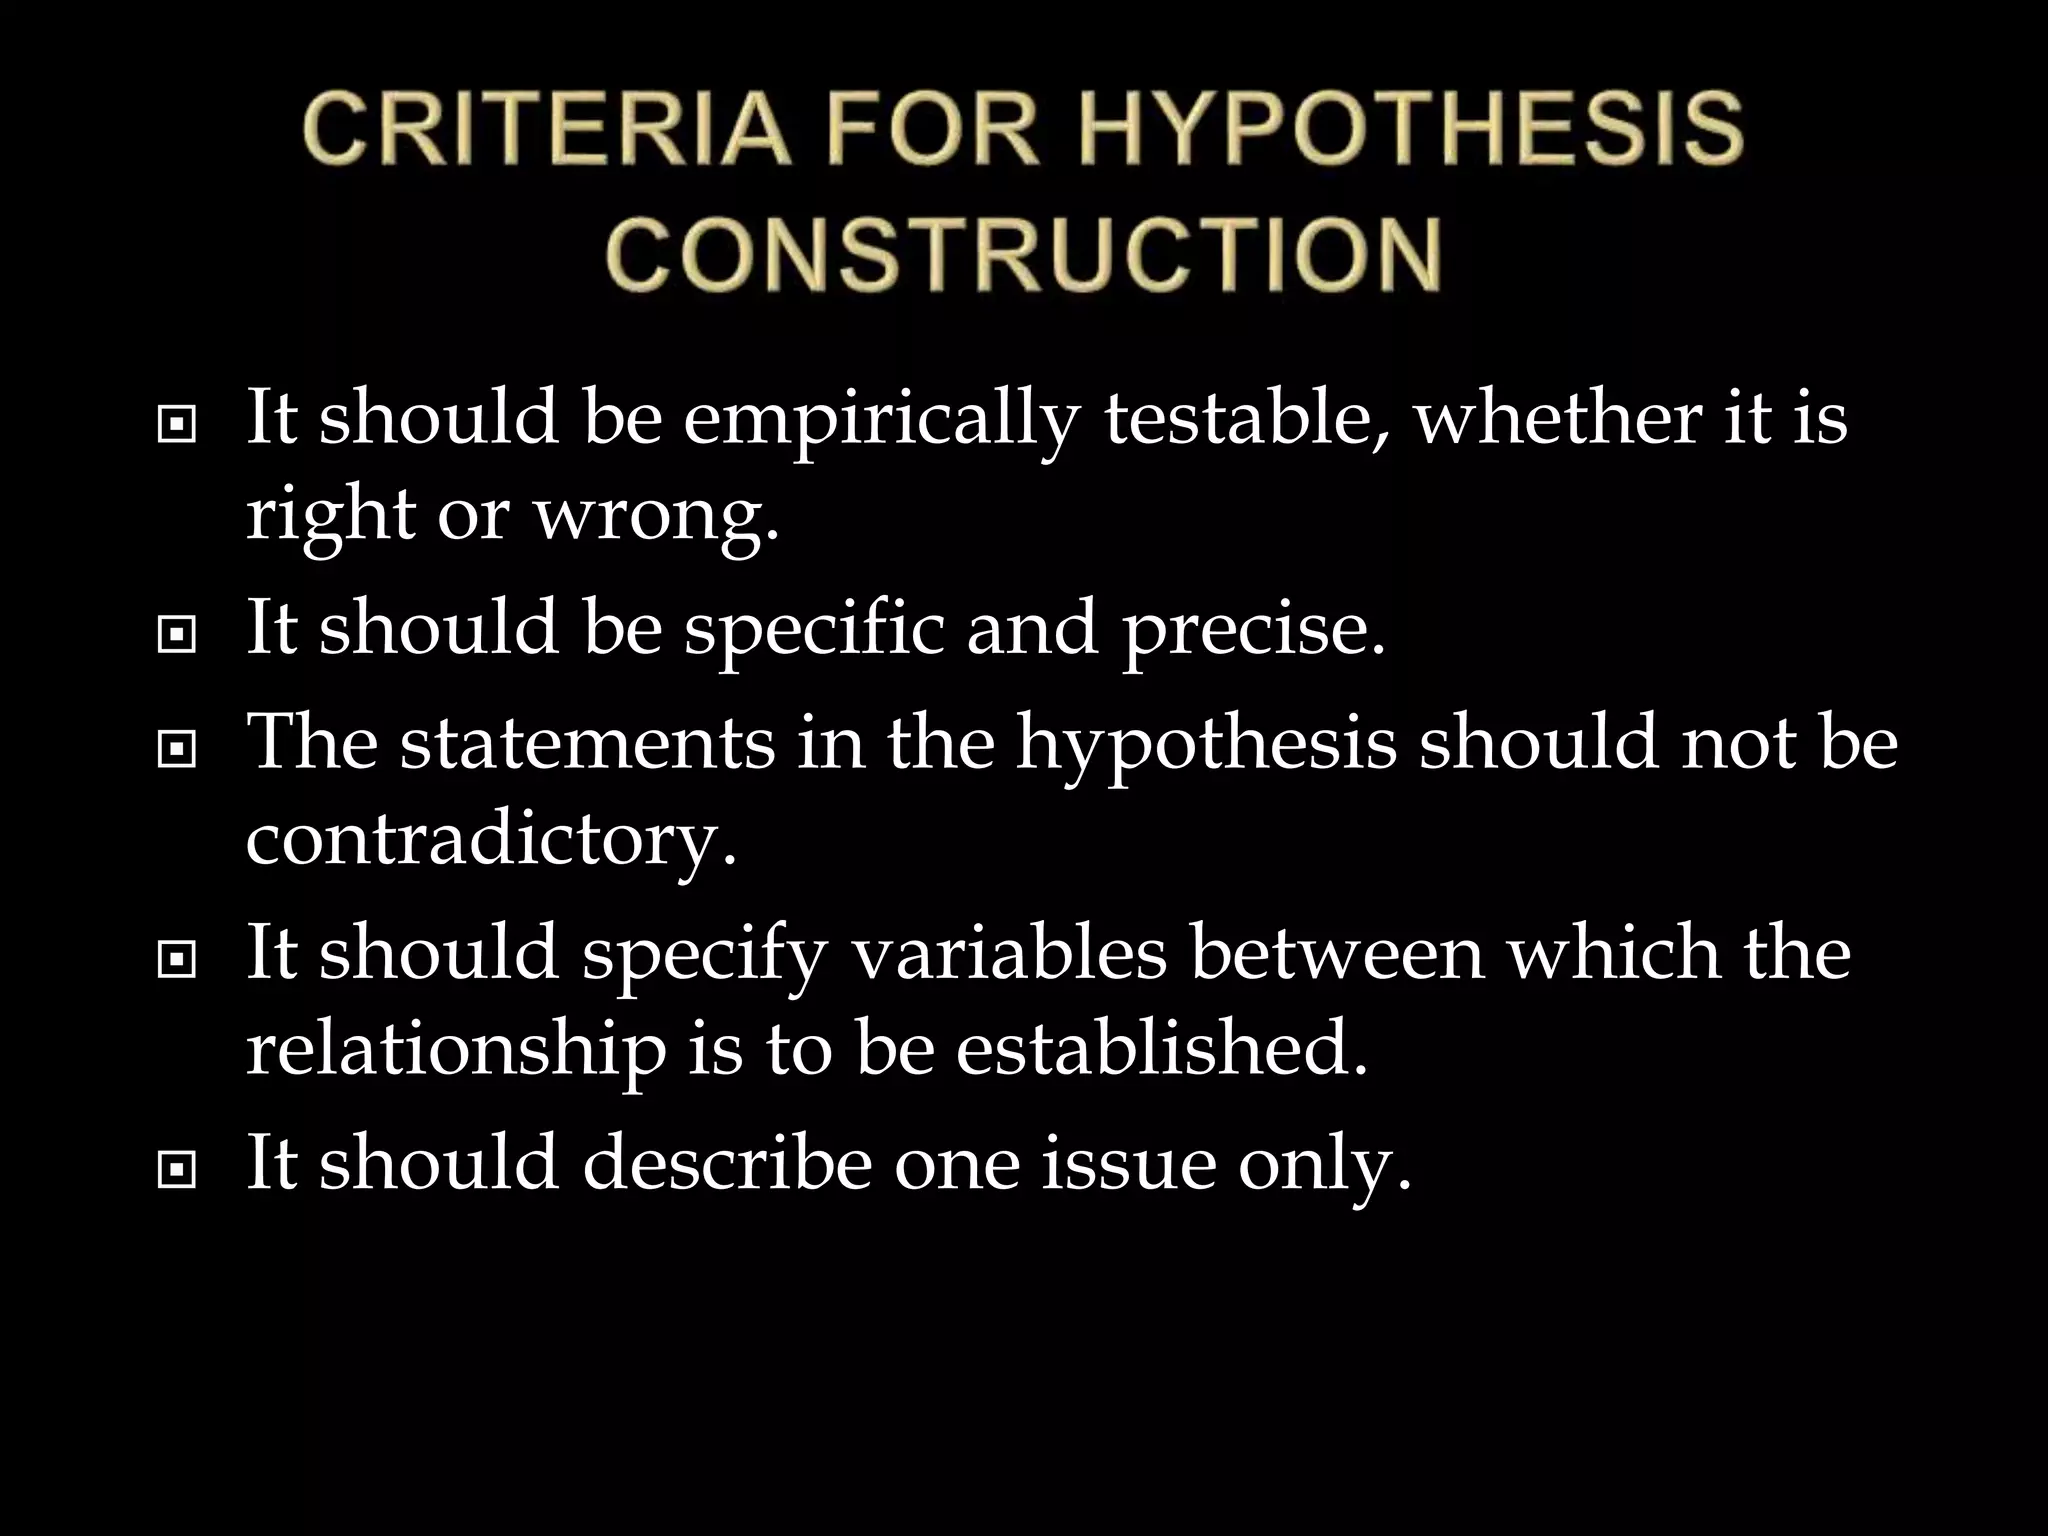
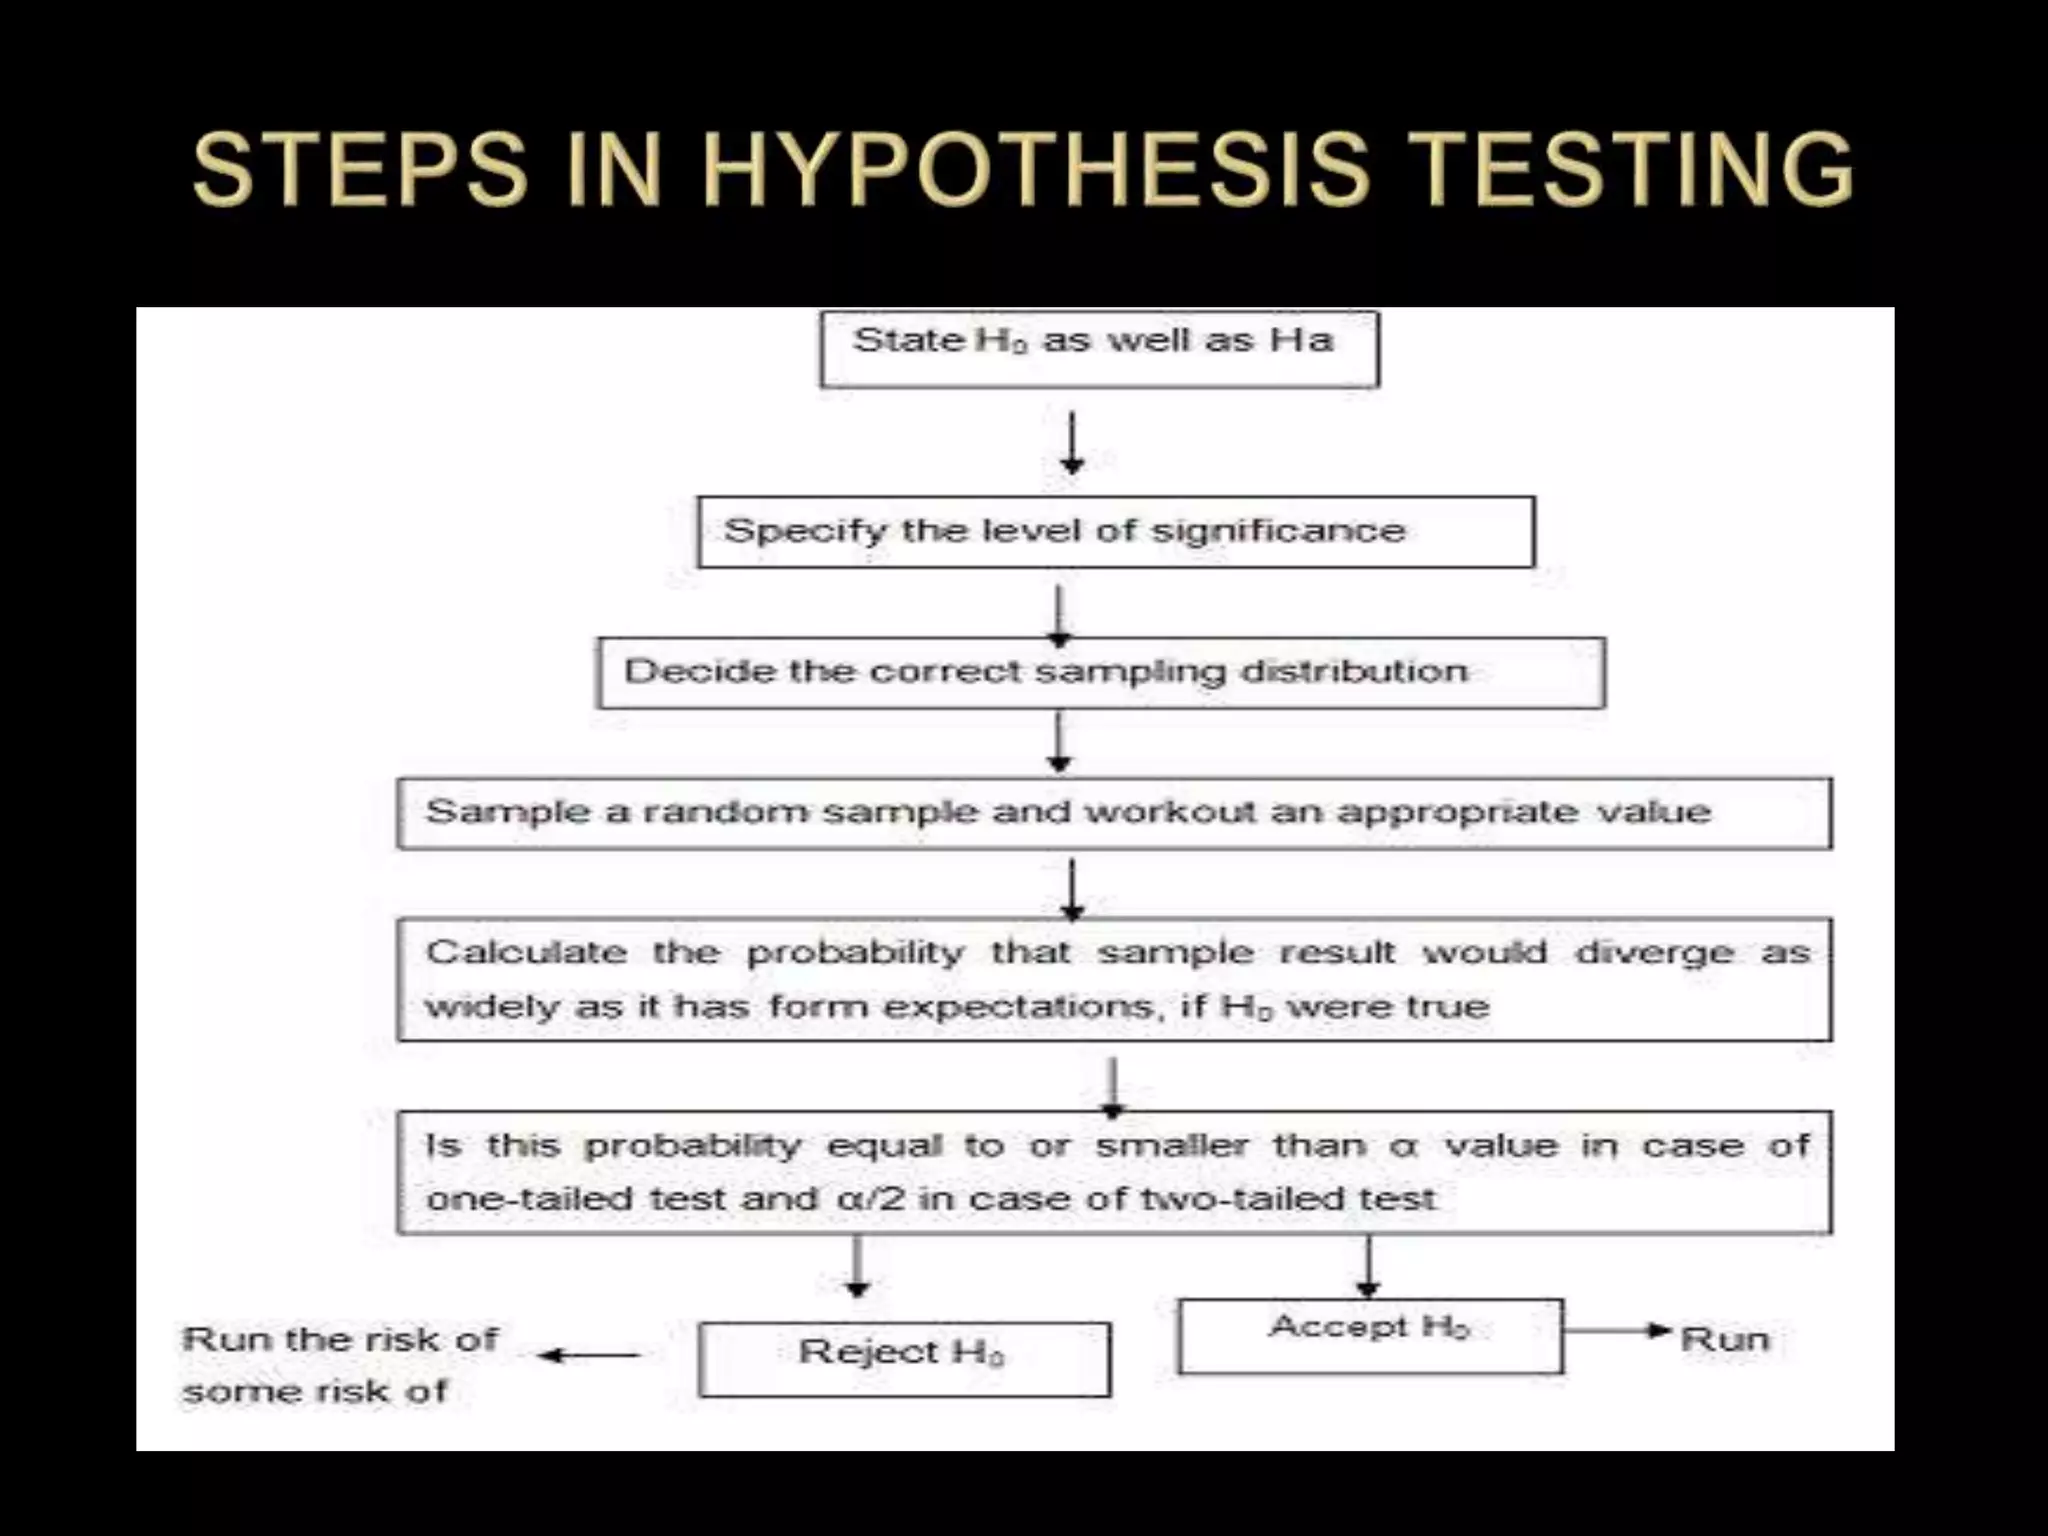
Bidyadhar (04)
Manoj (13)
Rashmi (14)
Sunil (15)
Yash (16)
Asha (19)
 INTRODUCTION
 CHARACTERISTICS OF A HYPOTHESIS
 CRITERIA FOR HYPOTHESIS CONSTRUCTION
 STEPS IN HYPOTHESIS TESTING
 SOURCES OF HYPOTHESIS
 APPROCHES TO HYPOTHESIS TESTING
 THE LOGIC OF HYPOTHESIS TESTING
 TYPES OF ERRORS IN HYPOTHESIS
“Don’t confuse “hypothesis” and “theory”. The
former is a possible explanation; the latter, the
correct one. The establishment of theory is the very
purpose of science.”
- Martin H. Fischer
 A Hypothesis is :-
 a mere assumption to be proved or disproved
 the statement or an assumption about relationships
between variables
 a tentative explanation for certain behaviors,
phenomenon or events that have occurred or will occur
 a predictive statement capable of being tested by scientific
methods, that relates an independent variable to some
dependent variable
 Hypothesis is a principal instrument in
research and for researcher its a formal question
that he intends to resolve
 Most research is carried out with the deliberate
intention of testing hypothesis
 Decision makers need to test hypothesis to take
decisions regarding alternate courses of action
 Hypothesis-testing, thus, enables us to make
probability statements about population
parameters
 In sum, hypothesis is a proposition which can
be put to test to determine its validity
 Students who receive counseling will show
greater increase in creativity than students not
receiving counseling; or Car A is performing as
well as Car B
 Bankers assumed high-income earners are
more profitable than low-income earners.
 Old clients were more likely to diminish CD
balances by large amounts compared to
younger clients.
This was nonintrusive because conventional
wisdom suggested that older clients have a
larger portfolio of assets and seek less risky
investments
o Should be clear and precise
o Should be capable of being tested
o Should be limited in scope and be specific
o Should be stated in simple terms
o Should state the relationship between variables
o Should be consistent with most known facts
o Should be amenable to testing within a reasonable time
o Must explain the facts that gave rise to the need for
explanation
 It should be empirically testable, whether it is
right or wrong.
 It should be specific and precise.
 The statements in the hypothesis should not be
contradictory.
 It should specify variables between which the
relationship is to be established.
 It should describe one issue only.
 Theory
 Main source
 Observation
 Through observing the environment
 Analogies
 Intuition & personal experience
 Classical statistics
 Represents an objectives view of probability in which the
decision making rests totally on an analysis of available
sampling data
 A hypothesis established, it is rejected or accepted, based
on the sample data collected
 Bayesian statistics
 Its extension of classical approach
 But goes beyond to consider all other available
information
 This additional information consist of subjective
probability estimates states in terms of degrees of belief
 Subjective estimates are based on general experience
rather than on specific collected data
 In classical tests of significance, two kinds of
hypothesis are used
 Null hypothesis
 Alternative hypothesis
 Two-tailed test
 One-tailed test
 Null hypothesis (H0) represents the hypothesis we are
trying to reject and is the one which we wish to disprove
 Example:
1) Suppose a coin is suspected of being biased in favor
of heads. The coin is flipped 100 times & the outcome is
52 heads. It would not to be correct to jump to the
conclusion that the coin is biased simply because more
than the expected number of 50 heads resulted. The
reason is that 52 heads is consistent with the
hypothesis that the coin is fair. On the other hand,
flipping 85/90 heads in 100 flips would seem to
contradict the hypothesis of a fair coin. In this case
there would be a strong case for a biased coin.
 
0
0
:
0 


 Std
New
Std
New
H 



 Given the test scores of two random samples of
men and women, does one group differ from the
other? A possible null hypothesis is that the mean
male score is the same as the mean female score:
H0: μ1 = μ2where:
H0 = the null hypothesis
μ1 = the mean of population 1, and
μ2 = the mean of population 2.
A stronger null hypothesis is that the two samples
are drawn from the same population, such that the
variance and shape of the distributions are also
equal.
0
: 
 Std
New
A
H 

• Alternative Hypothesis (Ha or H1) is usually
the one which we wish to prove and the
alternative hypothesis represents all other
possibilities.
• Further, alternative hypothesis it has two
types are:
•Two-tailed test
•One-tailed test
 It is non-directional test which considers two possibilities
 If you are using a significance level of 0.05, a two-tailed test
allots half of your alpha to testing the statistical significance
in one direction and half of your alpha to testing statistical
significance in the other direction.
 This means that .025 is in each tail of the distribution of your
test statistic.
 When using a two-tailed test, regardless of the direction of
the relationship you hypothesize, you are testing for the
possibility of the relationship in both directions.
 Example, we may wish to compare the mean of a sample to
a given value x using a t-test. Our null hypothesis is that the
mean is equal to x. A two-tailed test will test both if the
mean is significantly greater than x and if the mean
significantly less than x. The mean is considered
significantly different from x if the test statistic is in the top
2.5% or bottom 2.5% of its probability distribution, resulting
in a p-value less than 0.05.
 It is unidirectional test
 If you are using a significance level of .05, a one-tailed test allots all of
your alpha to testing the statistical significance in the one direction of
interest.
 This means that .05 is in one tail of the distribution of your test statistic.
 When using a one-tailed test, you are testing for the possibility of the
relationship in one direction and completely disregarding the possibility
of a relationship in the other direction.
 Let's return to our example comparing the mean of a sample to a given
value x using a t-test.
 Our null hypothesis is that the mean is equal to x. A one-tailed test will
test either if the mean is significantly greater than x or if the mean is
significantly less than x, but not both. Then, depending on the chosen tail,
the mean is significantly greater than or less than x if the test statistic is in
the top 5% of its probability distribution or bottom 5% of its probability
distribution, resulting in a p-value less than 0.05. The one-tailed test
provides more power to detect an effect in one direction by not testing the
effect in the other direction. A discussion of when this is an appropriate
option follows.
Types of errors Types of errors
Types of decision H0true H0 false
Reject Type I error(a) Correct decision(1-b)
Accept Correct decision(1-a) Type II error(b)
 Type I Error – we may reject the null
hypothesis when it is true;
 That is, Type I error means rejection of the
hypothesis which should have been accepted
 The value is called level of significance and
probability of rejecting the true
 Example: the innocent person is unjustly
convicted
 Type II Error – we may accept the null
hypothesis when in fact the null hypothesis is
not true
 Type II error means accepting the hypothesis
which should have been rejected
 Example: the result is an unjust acquittal, with
the guilty person may go free
0hypothesis testing.pdf

0hypothesis testing.pdf

  • 1.
    Bidyadhar (04) Manoj (13) Rashmi(14) Sunil (15) Yash (16) Asha (19)
  • 2.
     INTRODUCTION  CHARACTERISTICSOF A HYPOTHESIS  CRITERIA FOR HYPOTHESIS CONSTRUCTION  STEPS IN HYPOTHESIS TESTING  SOURCES OF HYPOTHESIS  APPROCHES TO HYPOTHESIS TESTING  THE LOGIC OF HYPOTHESIS TESTING  TYPES OF ERRORS IN HYPOTHESIS
  • 3.
    “Don’t confuse “hypothesis”and “theory”. The former is a possible explanation; the latter, the correct one. The establishment of theory is the very purpose of science.” - Martin H. Fischer  A Hypothesis is :-  a mere assumption to be proved or disproved  the statement or an assumption about relationships between variables  a tentative explanation for certain behaviors, phenomenon or events that have occurred or will occur  a predictive statement capable of being tested by scientific methods, that relates an independent variable to some dependent variable
  • 4.
     Hypothesis isa principal instrument in research and for researcher its a formal question that he intends to resolve  Most research is carried out with the deliberate intention of testing hypothesis  Decision makers need to test hypothesis to take decisions regarding alternate courses of action  Hypothesis-testing, thus, enables us to make probability statements about population parameters  In sum, hypothesis is a proposition which can be put to test to determine its validity
  • 5.
     Students whoreceive counseling will show greater increase in creativity than students not receiving counseling; or Car A is performing as well as Car B  Bankers assumed high-income earners are more profitable than low-income earners.  Old clients were more likely to diminish CD balances by large amounts compared to younger clients. This was nonintrusive because conventional wisdom suggested that older clients have a larger portfolio of assets and seek less risky investments
  • 6.
    o Should beclear and precise o Should be capable of being tested o Should be limited in scope and be specific o Should be stated in simple terms o Should state the relationship between variables o Should be consistent with most known facts o Should be amenable to testing within a reasonable time o Must explain the facts that gave rise to the need for explanation
  • 7.
     It shouldbe empirically testable, whether it is right or wrong.  It should be specific and precise.  The statements in the hypothesis should not be contradictory.  It should specify variables between which the relationship is to be established.  It should describe one issue only.
  • 9.
     Theory  Mainsource  Observation  Through observing the environment  Analogies  Intuition & personal experience
  • 10.
     Classical statistics Represents an objectives view of probability in which the decision making rests totally on an analysis of available sampling data  A hypothesis established, it is rejected or accepted, based on the sample data collected  Bayesian statistics  Its extension of classical approach  But goes beyond to consider all other available information  This additional information consist of subjective probability estimates states in terms of degrees of belief  Subjective estimates are based on general experience rather than on specific collected data
  • 11.
     In classicaltests of significance, two kinds of hypothesis are used  Null hypothesis  Alternative hypothesis  Two-tailed test  One-tailed test
  • 12.
     Null hypothesis(H0) represents the hypothesis we are trying to reject and is the one which we wish to disprove  Example: 1) Suppose a coin is suspected of being biased in favor of heads. The coin is flipped 100 times & the outcome is 52 heads. It would not to be correct to jump to the conclusion that the coin is biased simply because more than the expected number of 50 heads resulted. The reason is that 52 heads is consistent with the hypothesis that the coin is fair. On the other hand, flipping 85/90 heads in 100 flips would seem to contradict the hypothesis of a fair coin. In this case there would be a strong case for a biased coin.   0 0 : 0     Std New Std New H    
  • 13.
     Given thetest scores of two random samples of men and women, does one group differ from the other? A possible null hypothesis is that the mean male score is the same as the mean female score: H0: μ1 = μ2where: H0 = the null hypothesis μ1 = the mean of population 1, and μ2 = the mean of population 2. A stronger null hypothesis is that the two samples are drawn from the same population, such that the variance and shape of the distributions are also equal.
  • 14.
    0 :   Std New A H  • Alternative Hypothesis (Ha or H1) is usually the one which we wish to prove and the alternative hypothesis represents all other possibilities. • Further, alternative hypothesis it has two types are: •Two-tailed test •One-tailed test
  • 15.
     It isnon-directional test which considers two possibilities  If you are using a significance level of 0.05, a two-tailed test allots half of your alpha to testing the statistical significance in one direction and half of your alpha to testing statistical significance in the other direction.  This means that .025 is in each tail of the distribution of your test statistic.  When using a two-tailed test, regardless of the direction of the relationship you hypothesize, you are testing for the possibility of the relationship in both directions.  Example, we may wish to compare the mean of a sample to a given value x using a t-test. Our null hypothesis is that the mean is equal to x. A two-tailed test will test both if the mean is significantly greater than x and if the mean significantly less than x. The mean is considered significantly different from x if the test statistic is in the top 2.5% or bottom 2.5% of its probability distribution, resulting in a p-value less than 0.05.
  • 17.
     It isunidirectional test  If you are using a significance level of .05, a one-tailed test allots all of your alpha to testing the statistical significance in the one direction of interest.  This means that .05 is in one tail of the distribution of your test statistic.  When using a one-tailed test, you are testing for the possibility of the relationship in one direction and completely disregarding the possibility of a relationship in the other direction.  Let's return to our example comparing the mean of a sample to a given value x using a t-test.  Our null hypothesis is that the mean is equal to x. A one-tailed test will test either if the mean is significantly greater than x or if the mean is significantly less than x, but not both. Then, depending on the chosen tail, the mean is significantly greater than or less than x if the test statistic is in the top 5% of its probability distribution or bottom 5% of its probability distribution, resulting in a p-value less than 0.05. The one-tailed test provides more power to detect an effect in one direction by not testing the effect in the other direction. A discussion of when this is an appropriate option follows.
  • 19.
    Types of errorsTypes of errors Types of decision H0true H0 false Reject Type I error(a) Correct decision(1-b) Accept Correct decision(1-a) Type II error(b)
  • 20.
     Type IError – we may reject the null hypothesis when it is true;  That is, Type I error means rejection of the hypothesis which should have been accepted  The value is called level of significance and probability of rejecting the true  Example: the innocent person is unjustly convicted
  • 21.
     Type IIError – we may accept the null hypothesis when in fact the null hypothesis is not true  Type II error means accepting the hypothesis which should have been rejected  Example: the result is an unjust acquittal, with the guilty person may go free