Downloaded 5,435 times
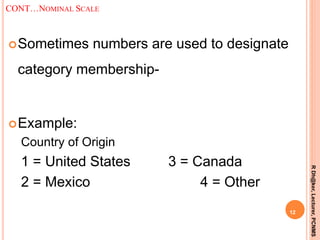
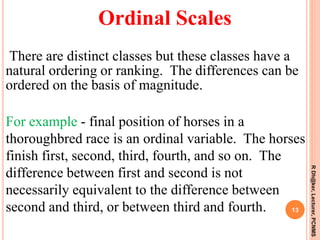
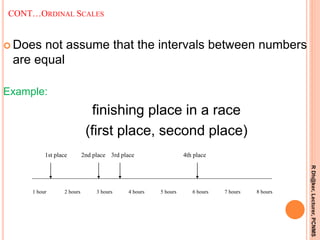

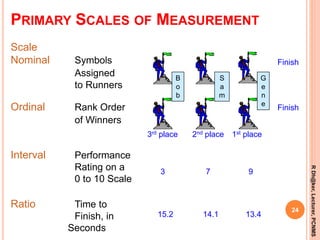
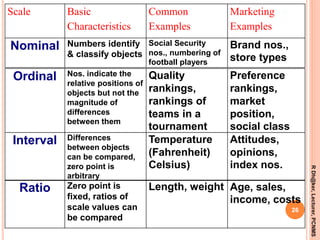
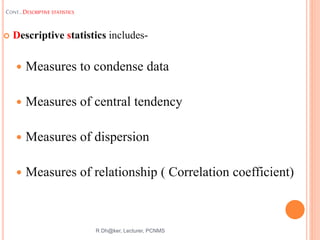
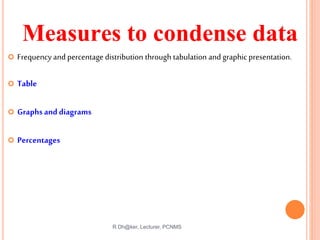
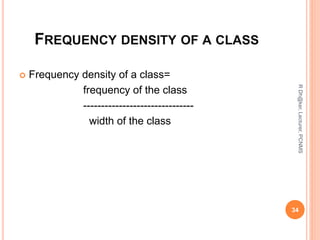
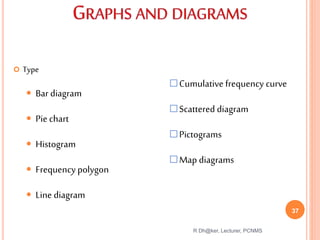
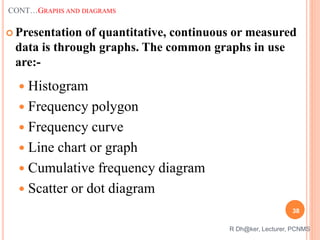
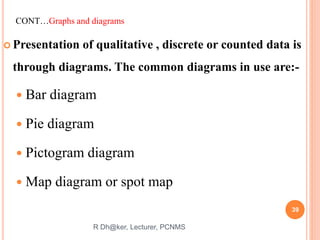
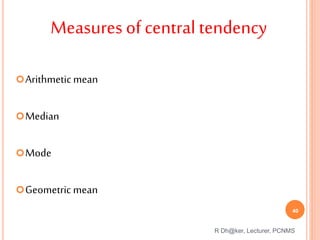
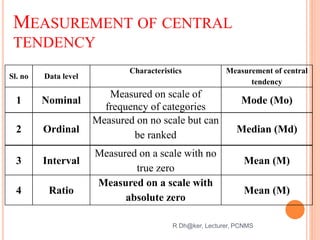


This document provides an introduction to statistics and biostatistics. It discusses key concepts including: - The definitions and origins of statistics and biostatistics. Biostatistics applies statistical methods to biological and medical data. - The four main scales of measurement: nominal, ordinal, interval, and ratio scales. Nominal scales classify data into categories while ratio scales allow for comparisons of magnitudes and ratios. - Descriptive statistics which organize and summarize data through methods like frequency distributions, measures of central tendency, and graphs. Frequency distributions condense data into tables and charts. Measures of central tendency include the mean, median, and mode.