Downloaded 300 times
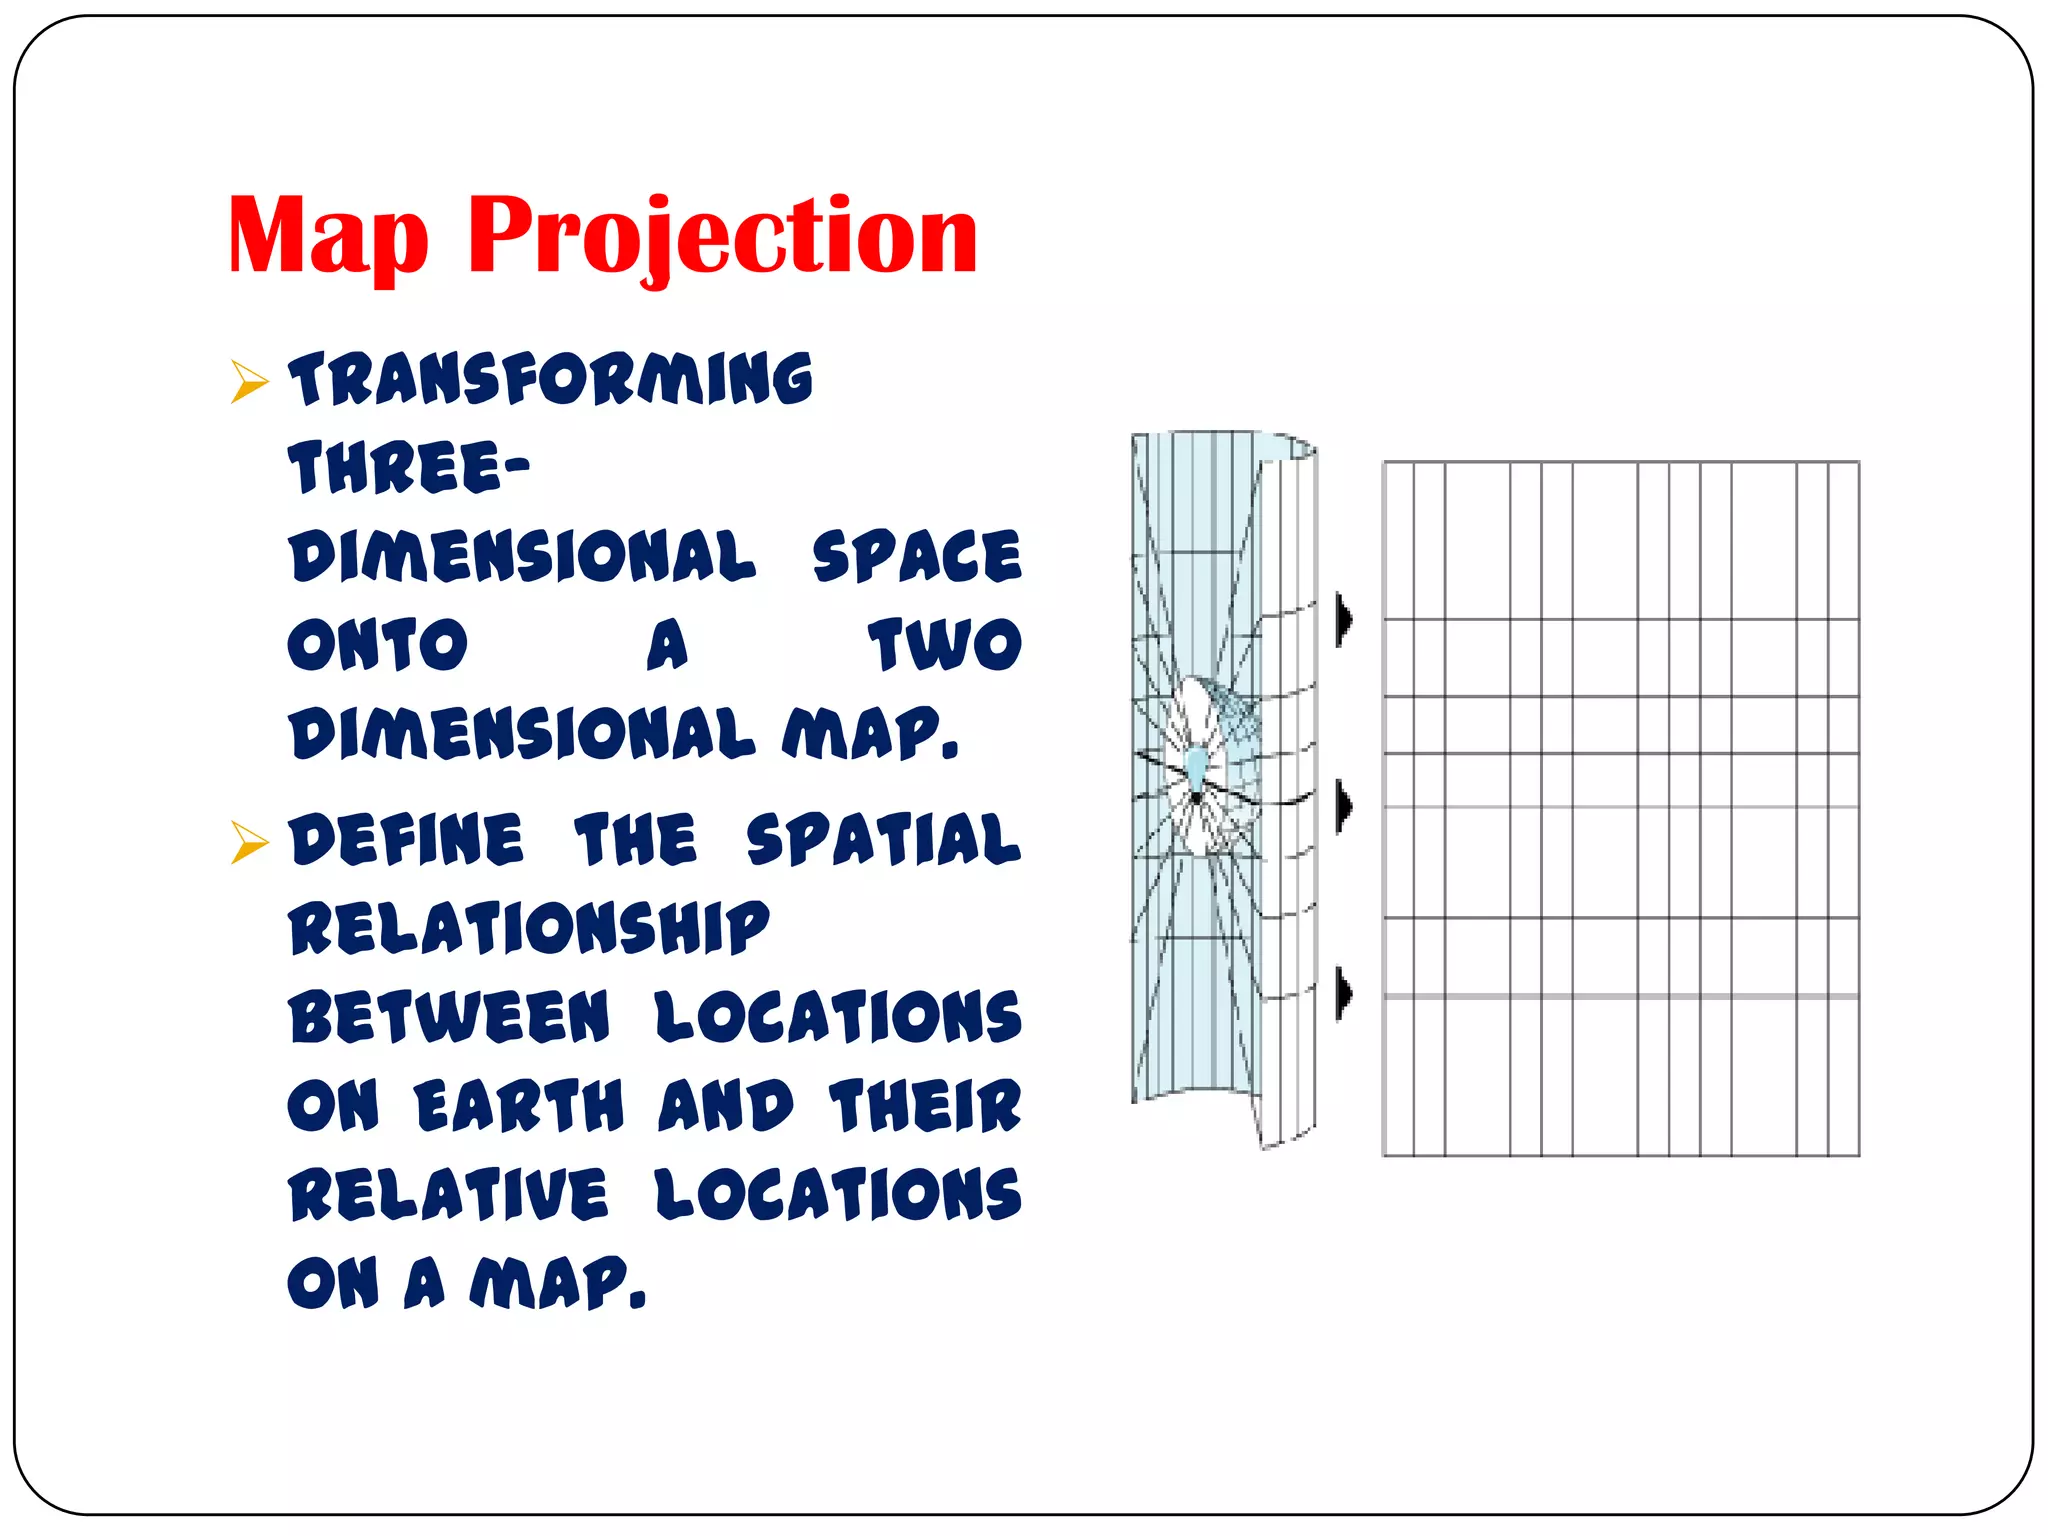
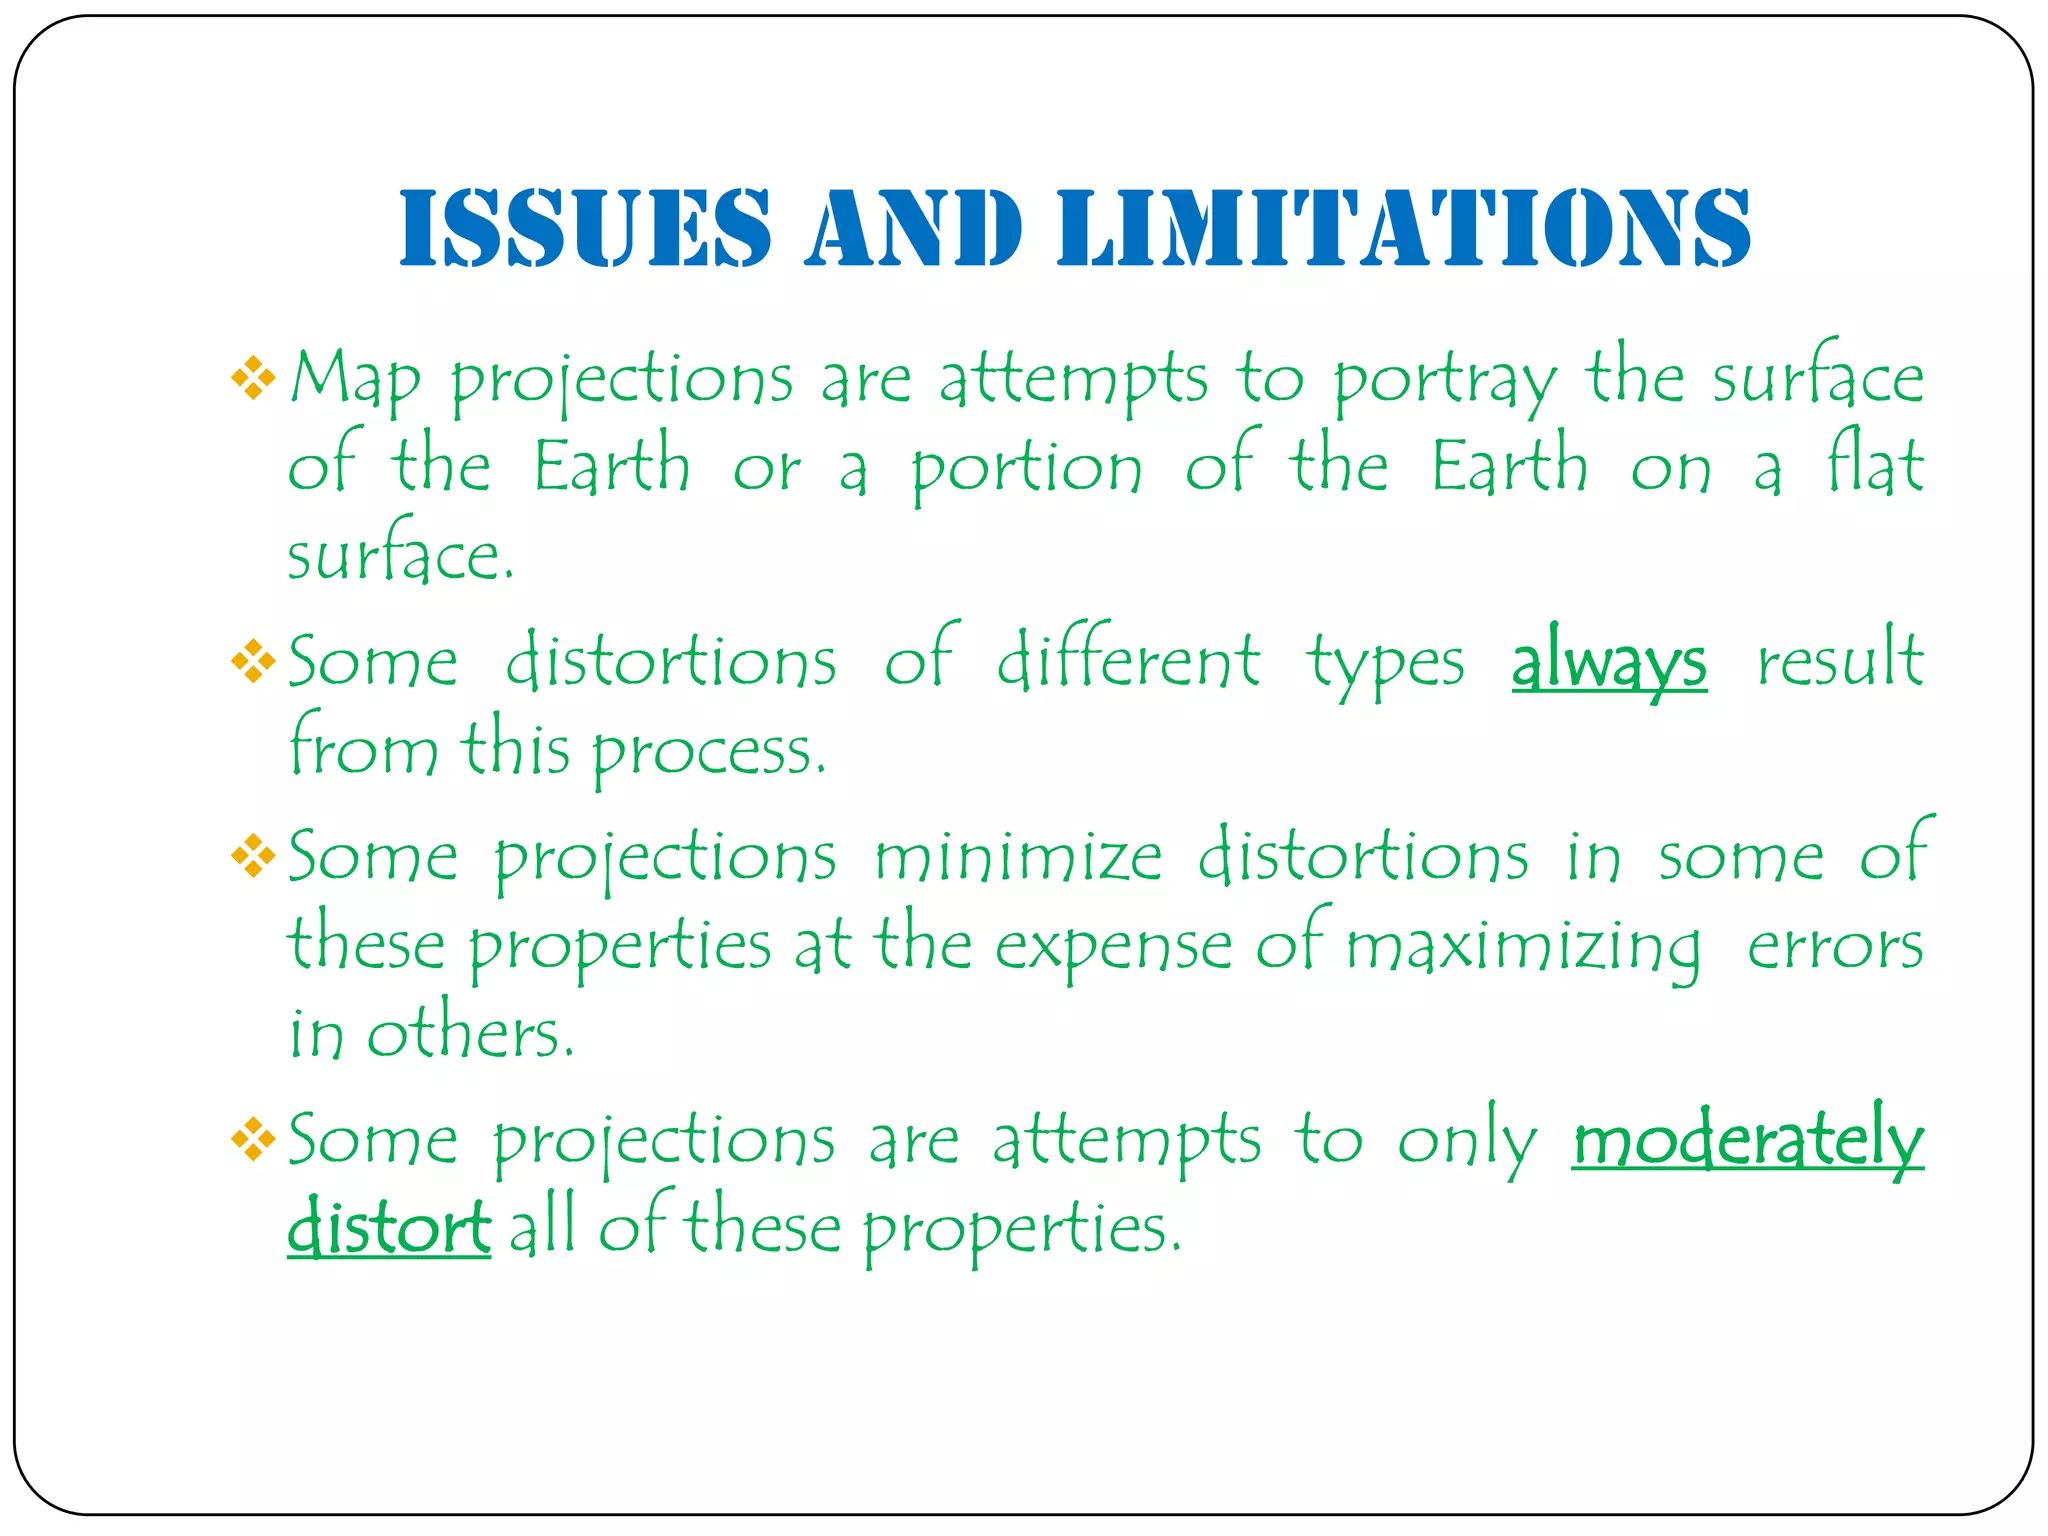
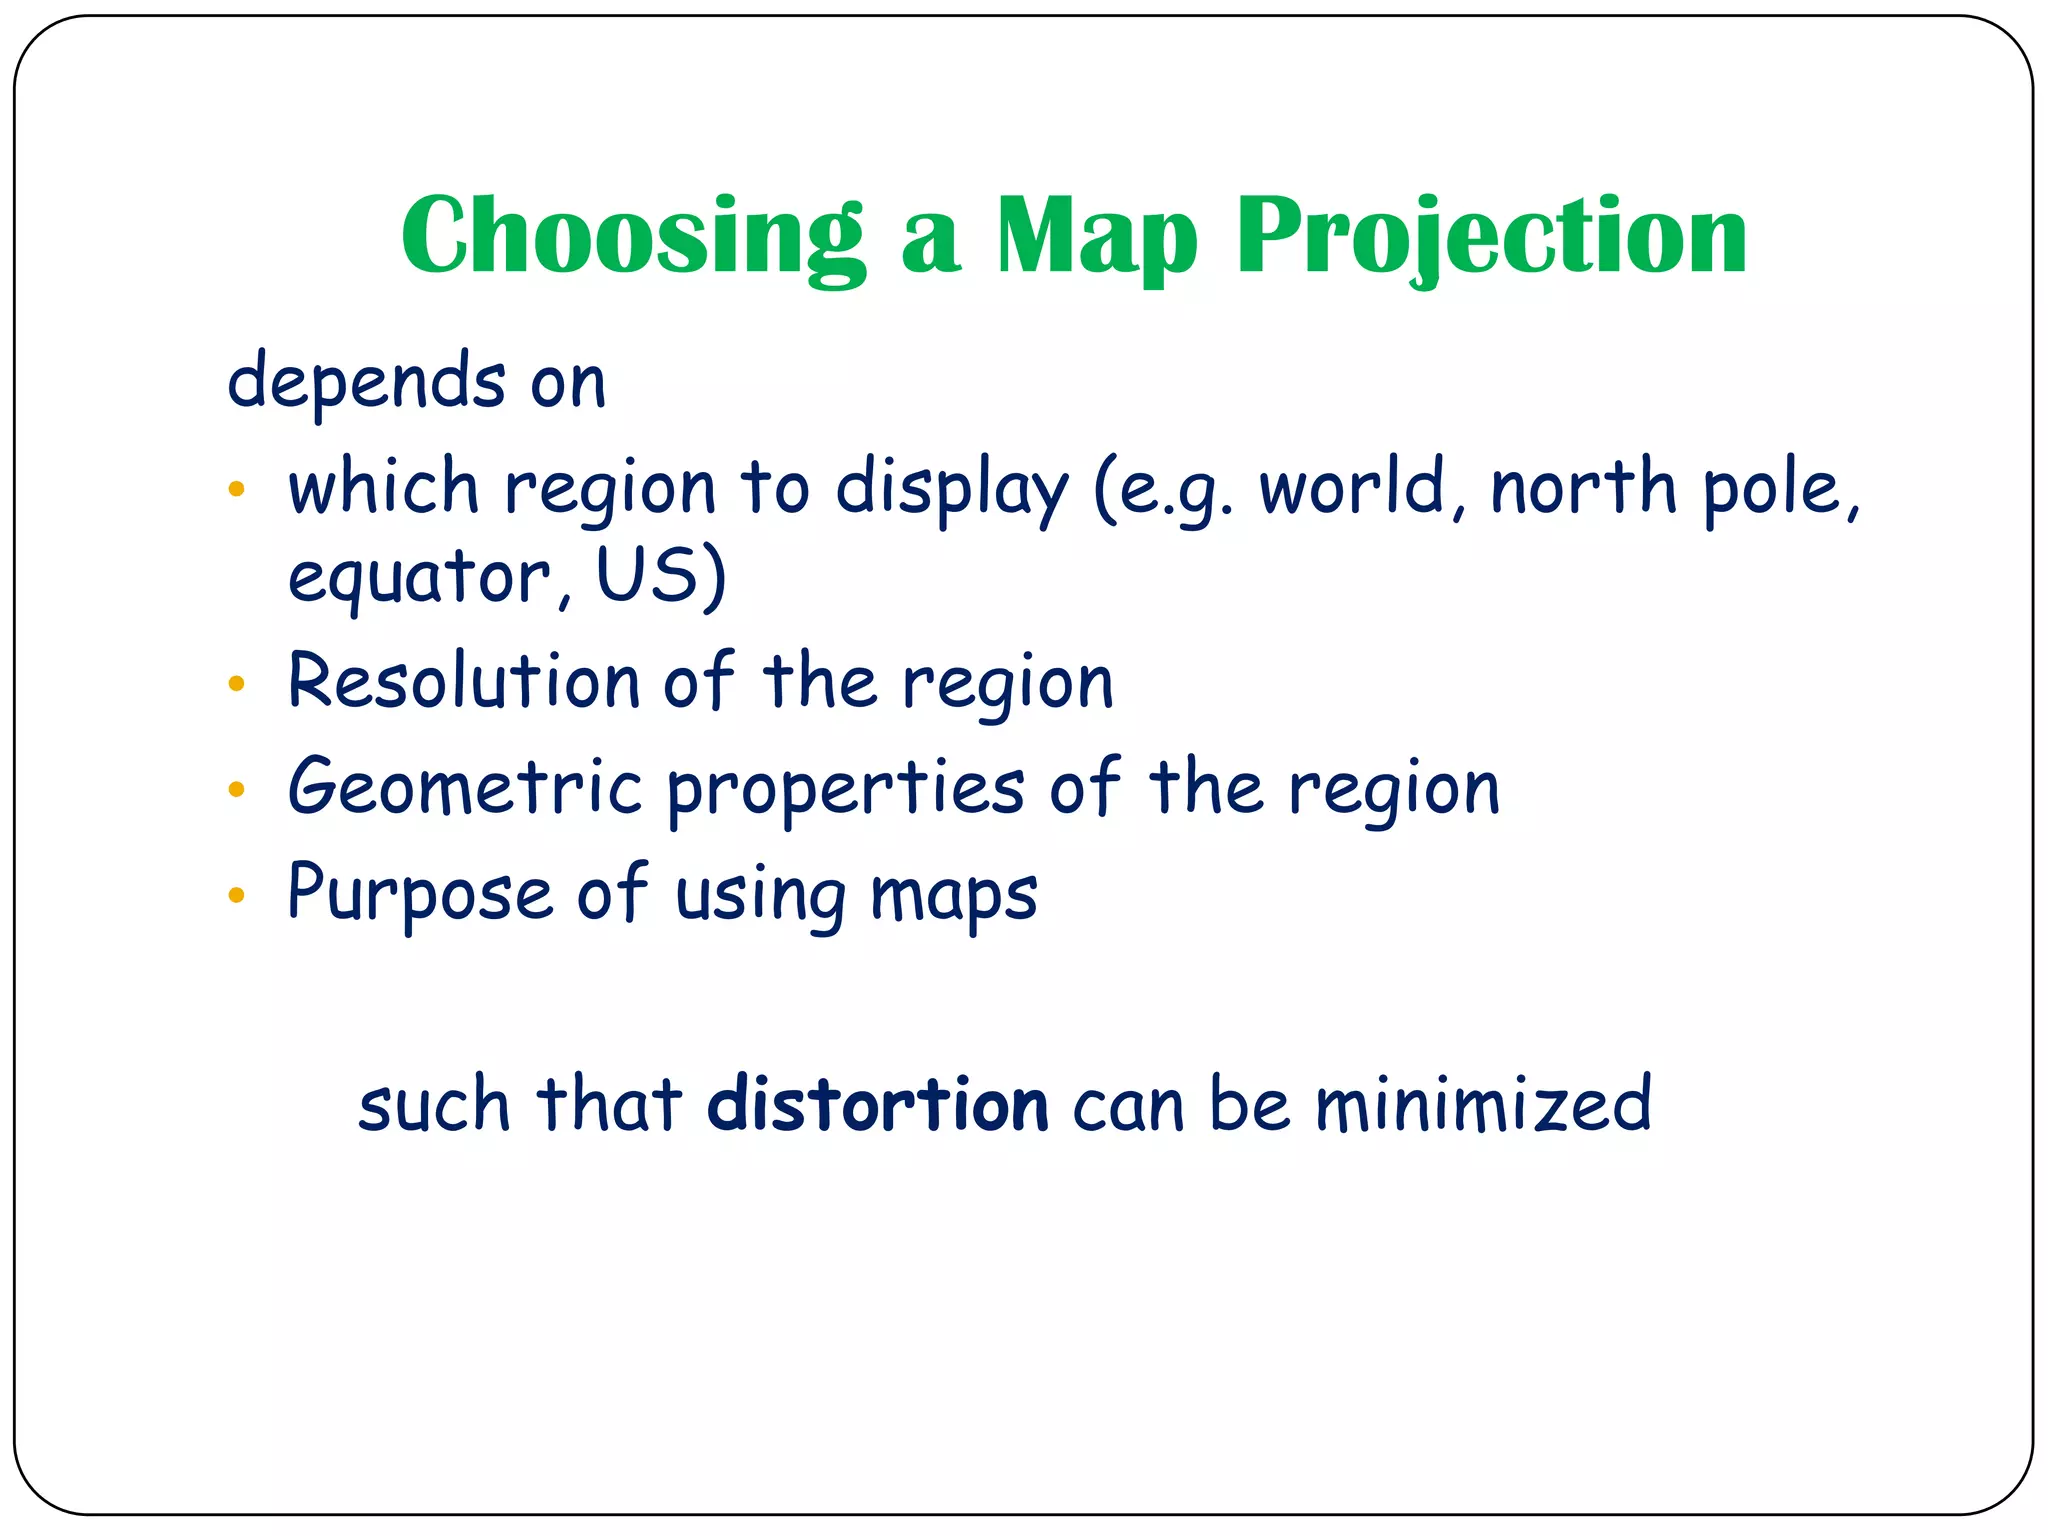
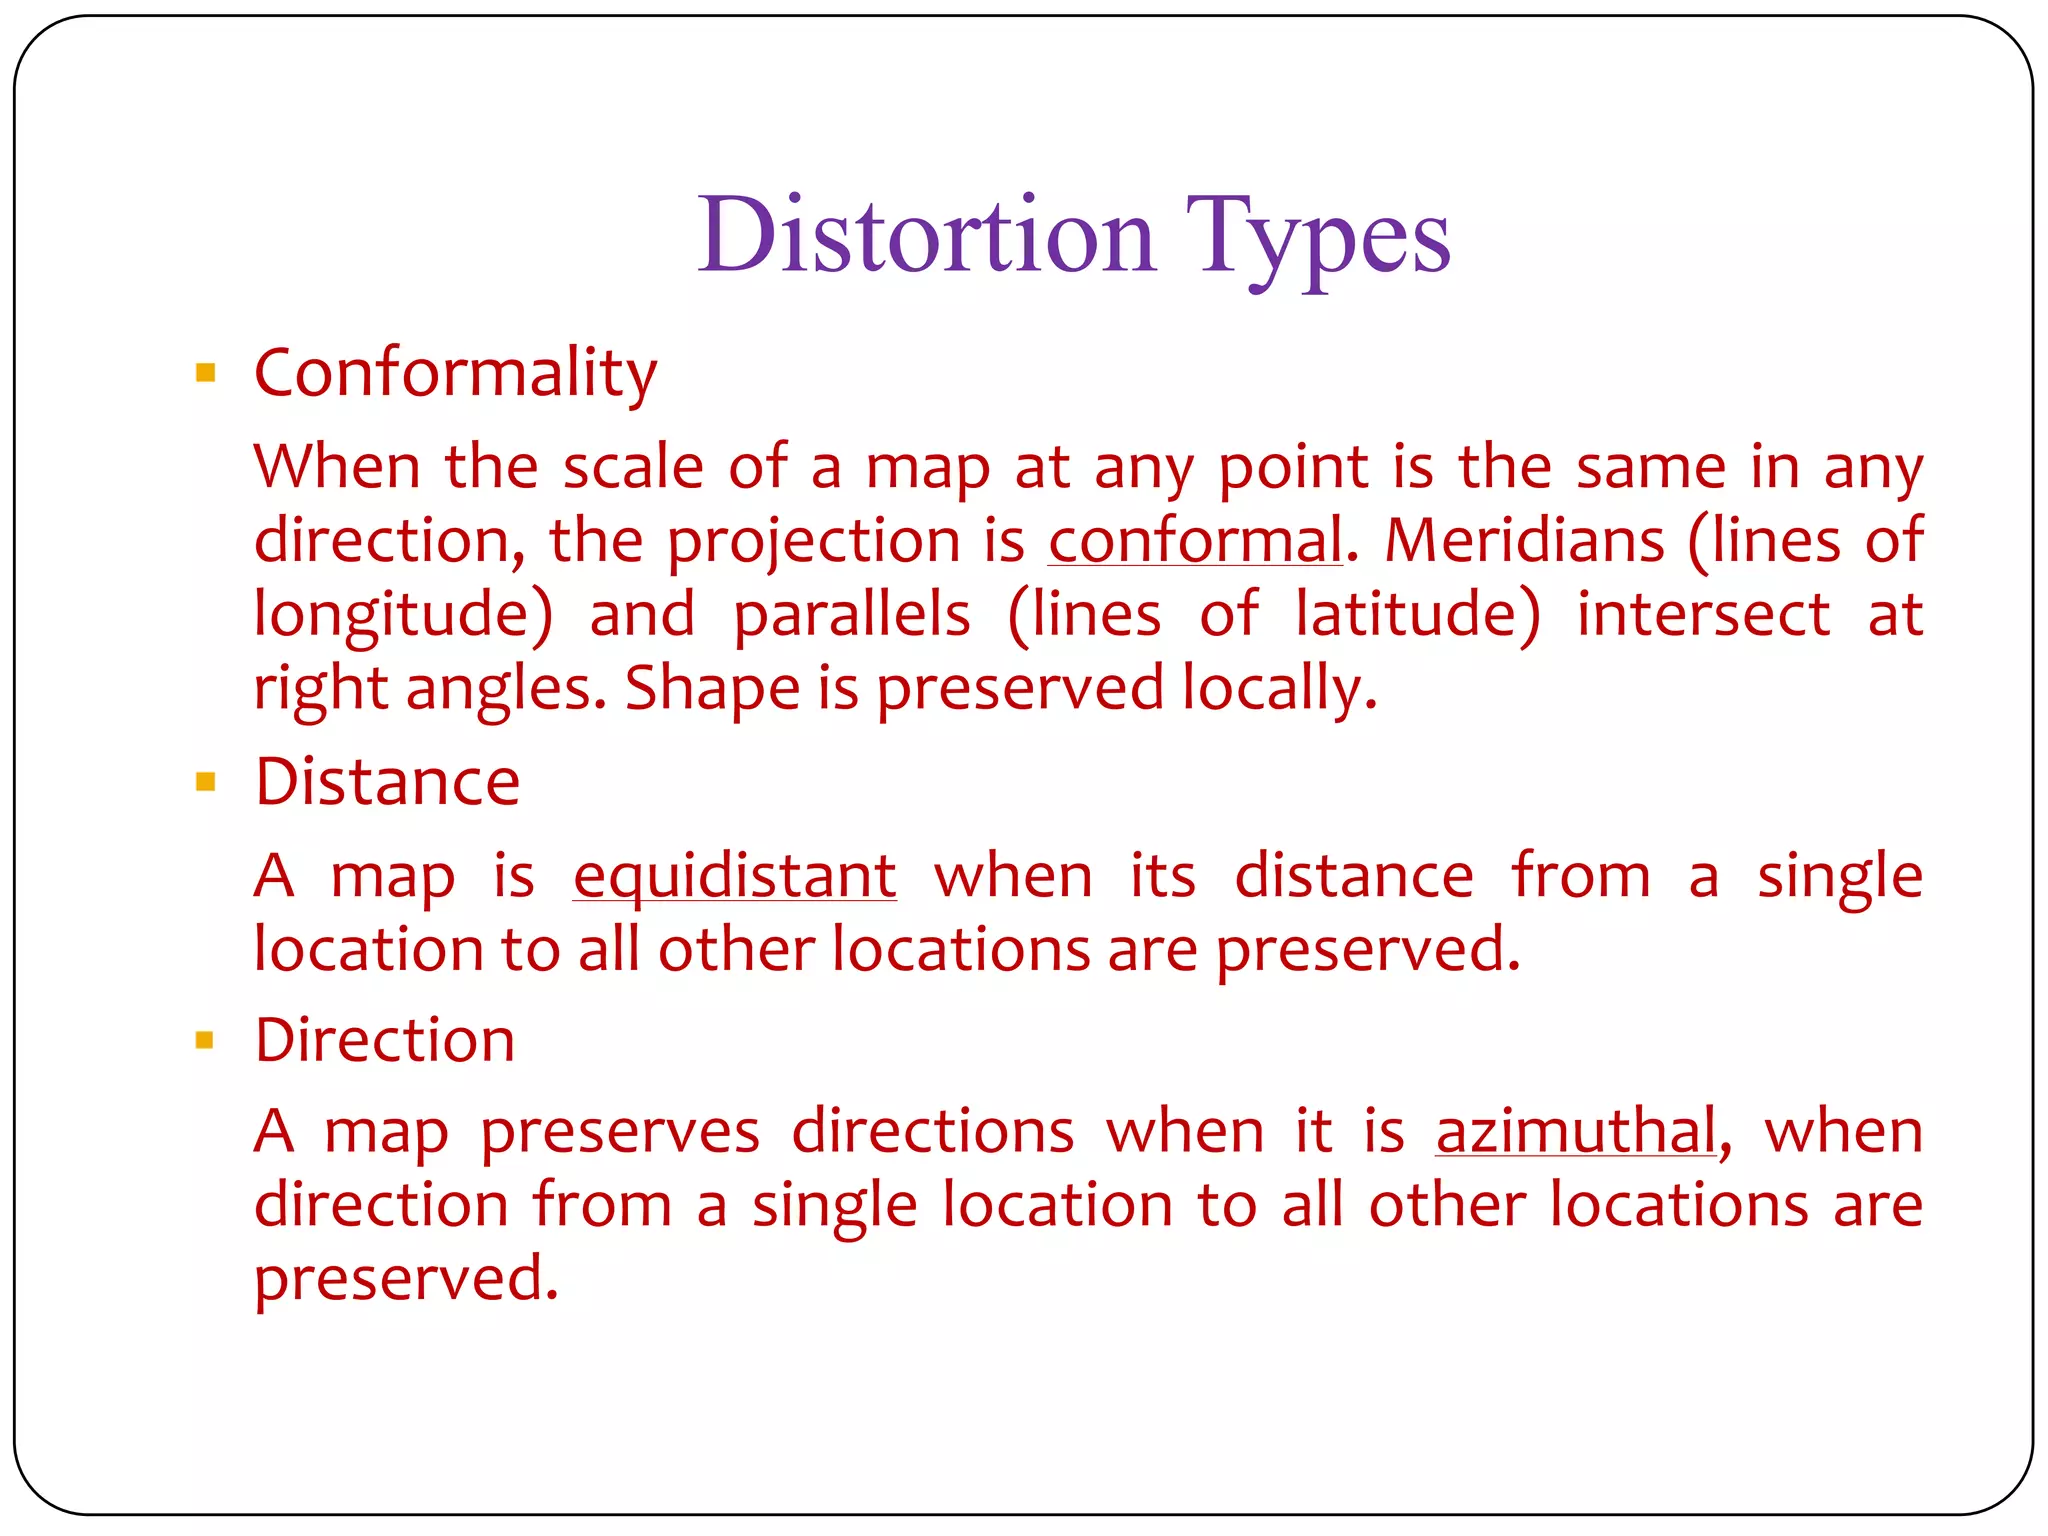
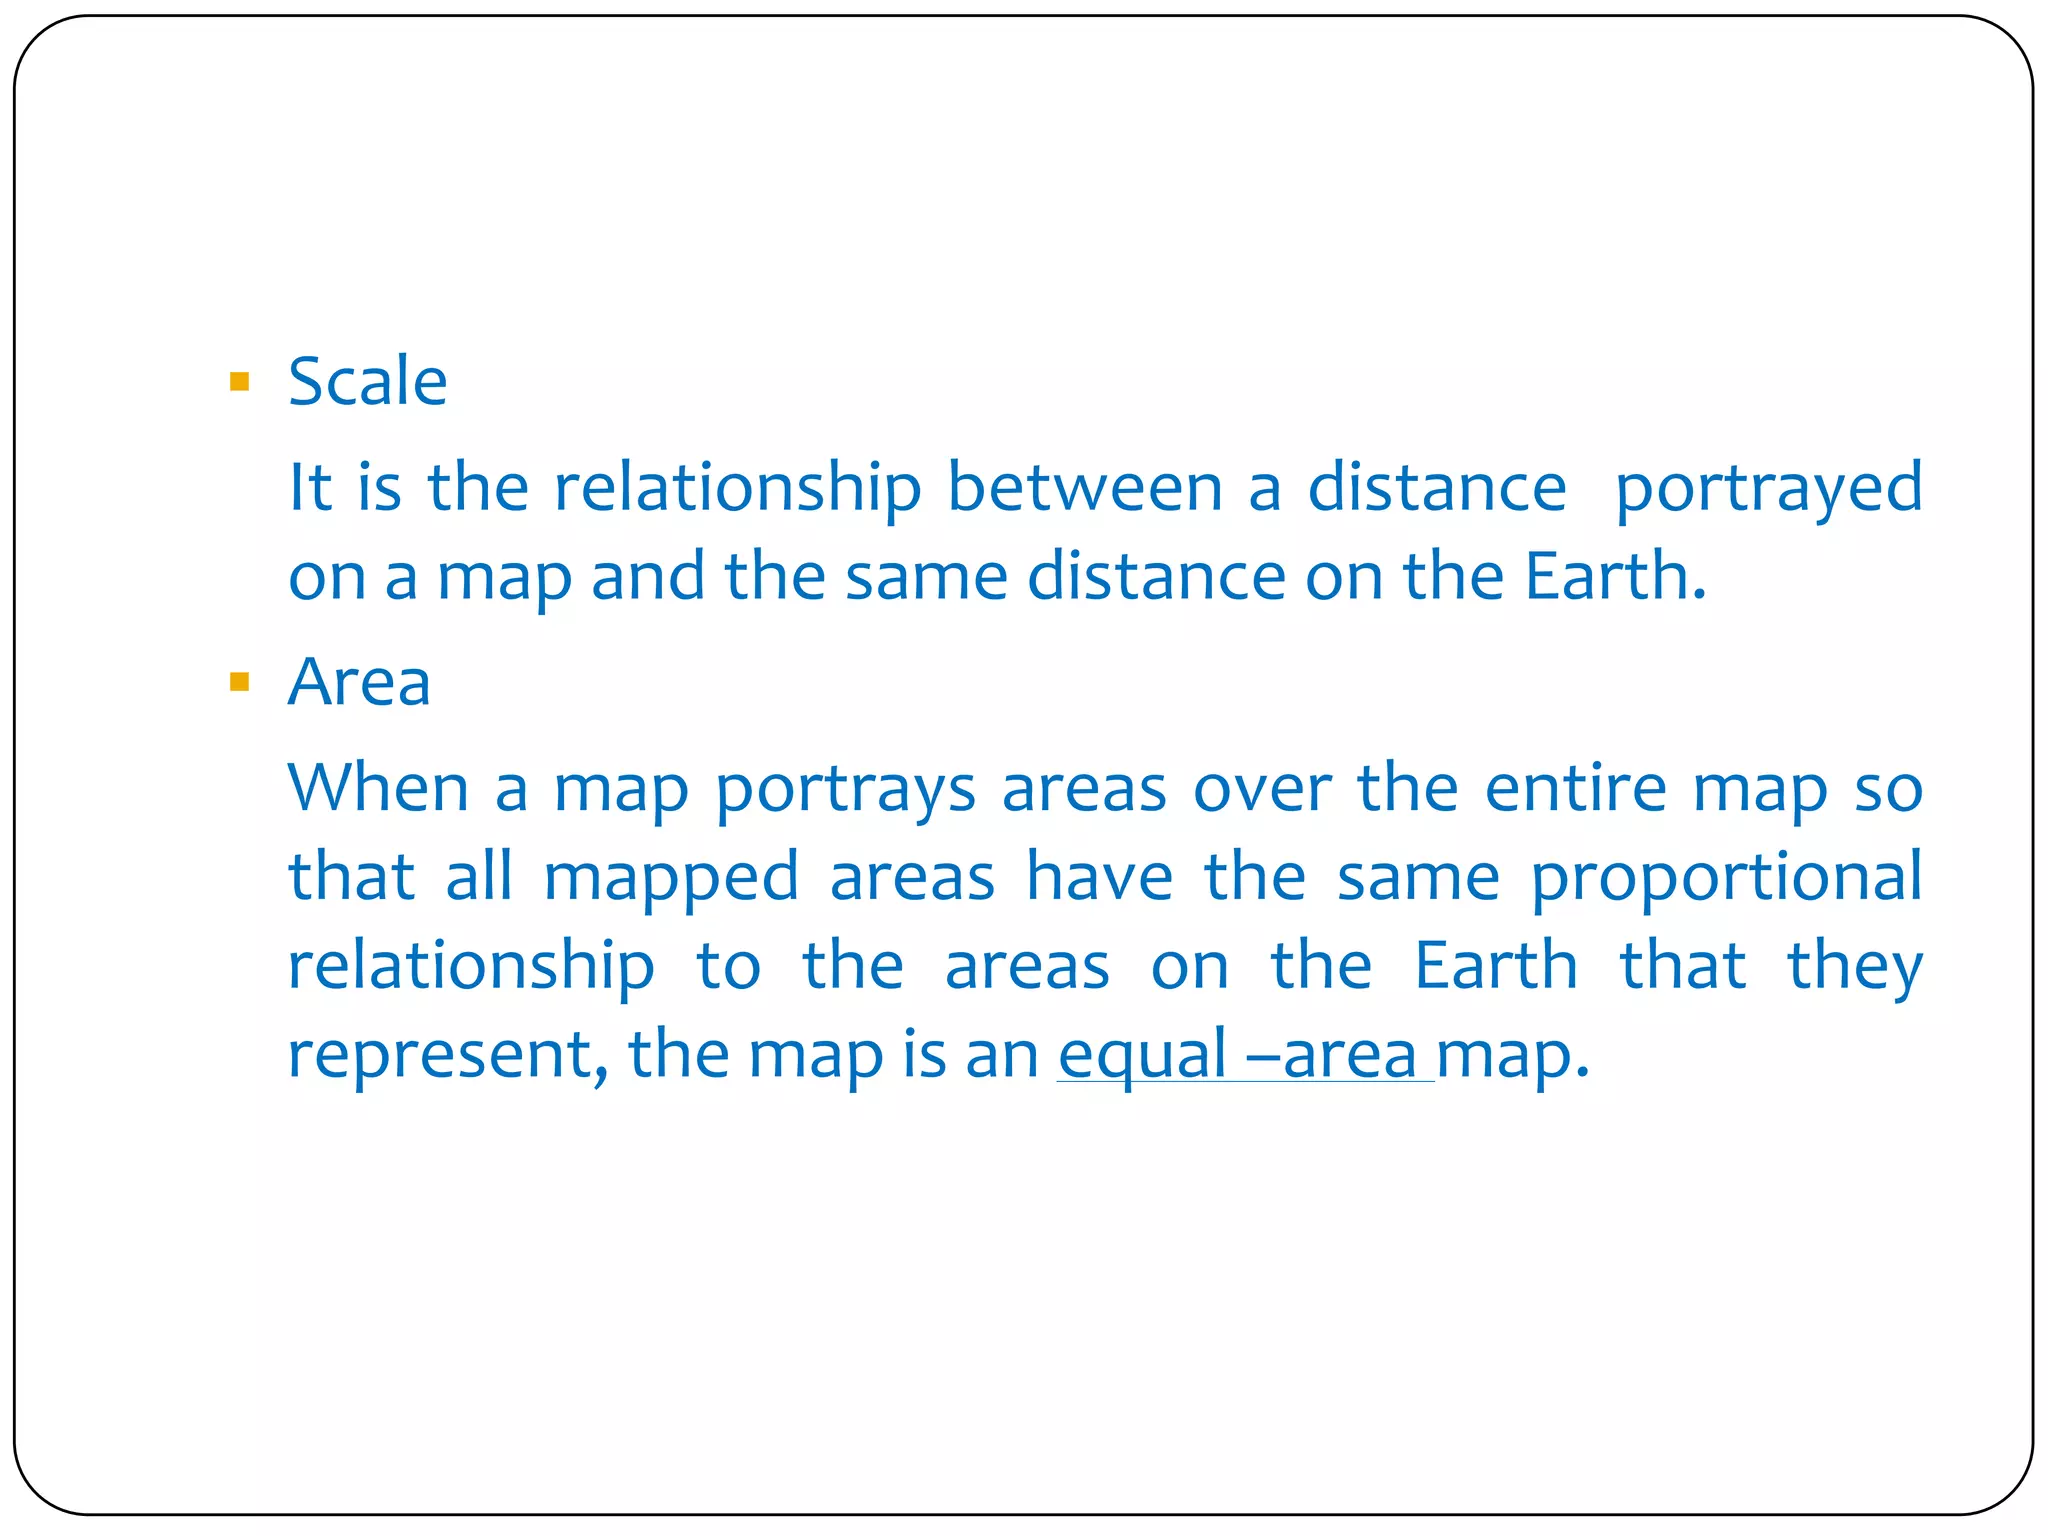
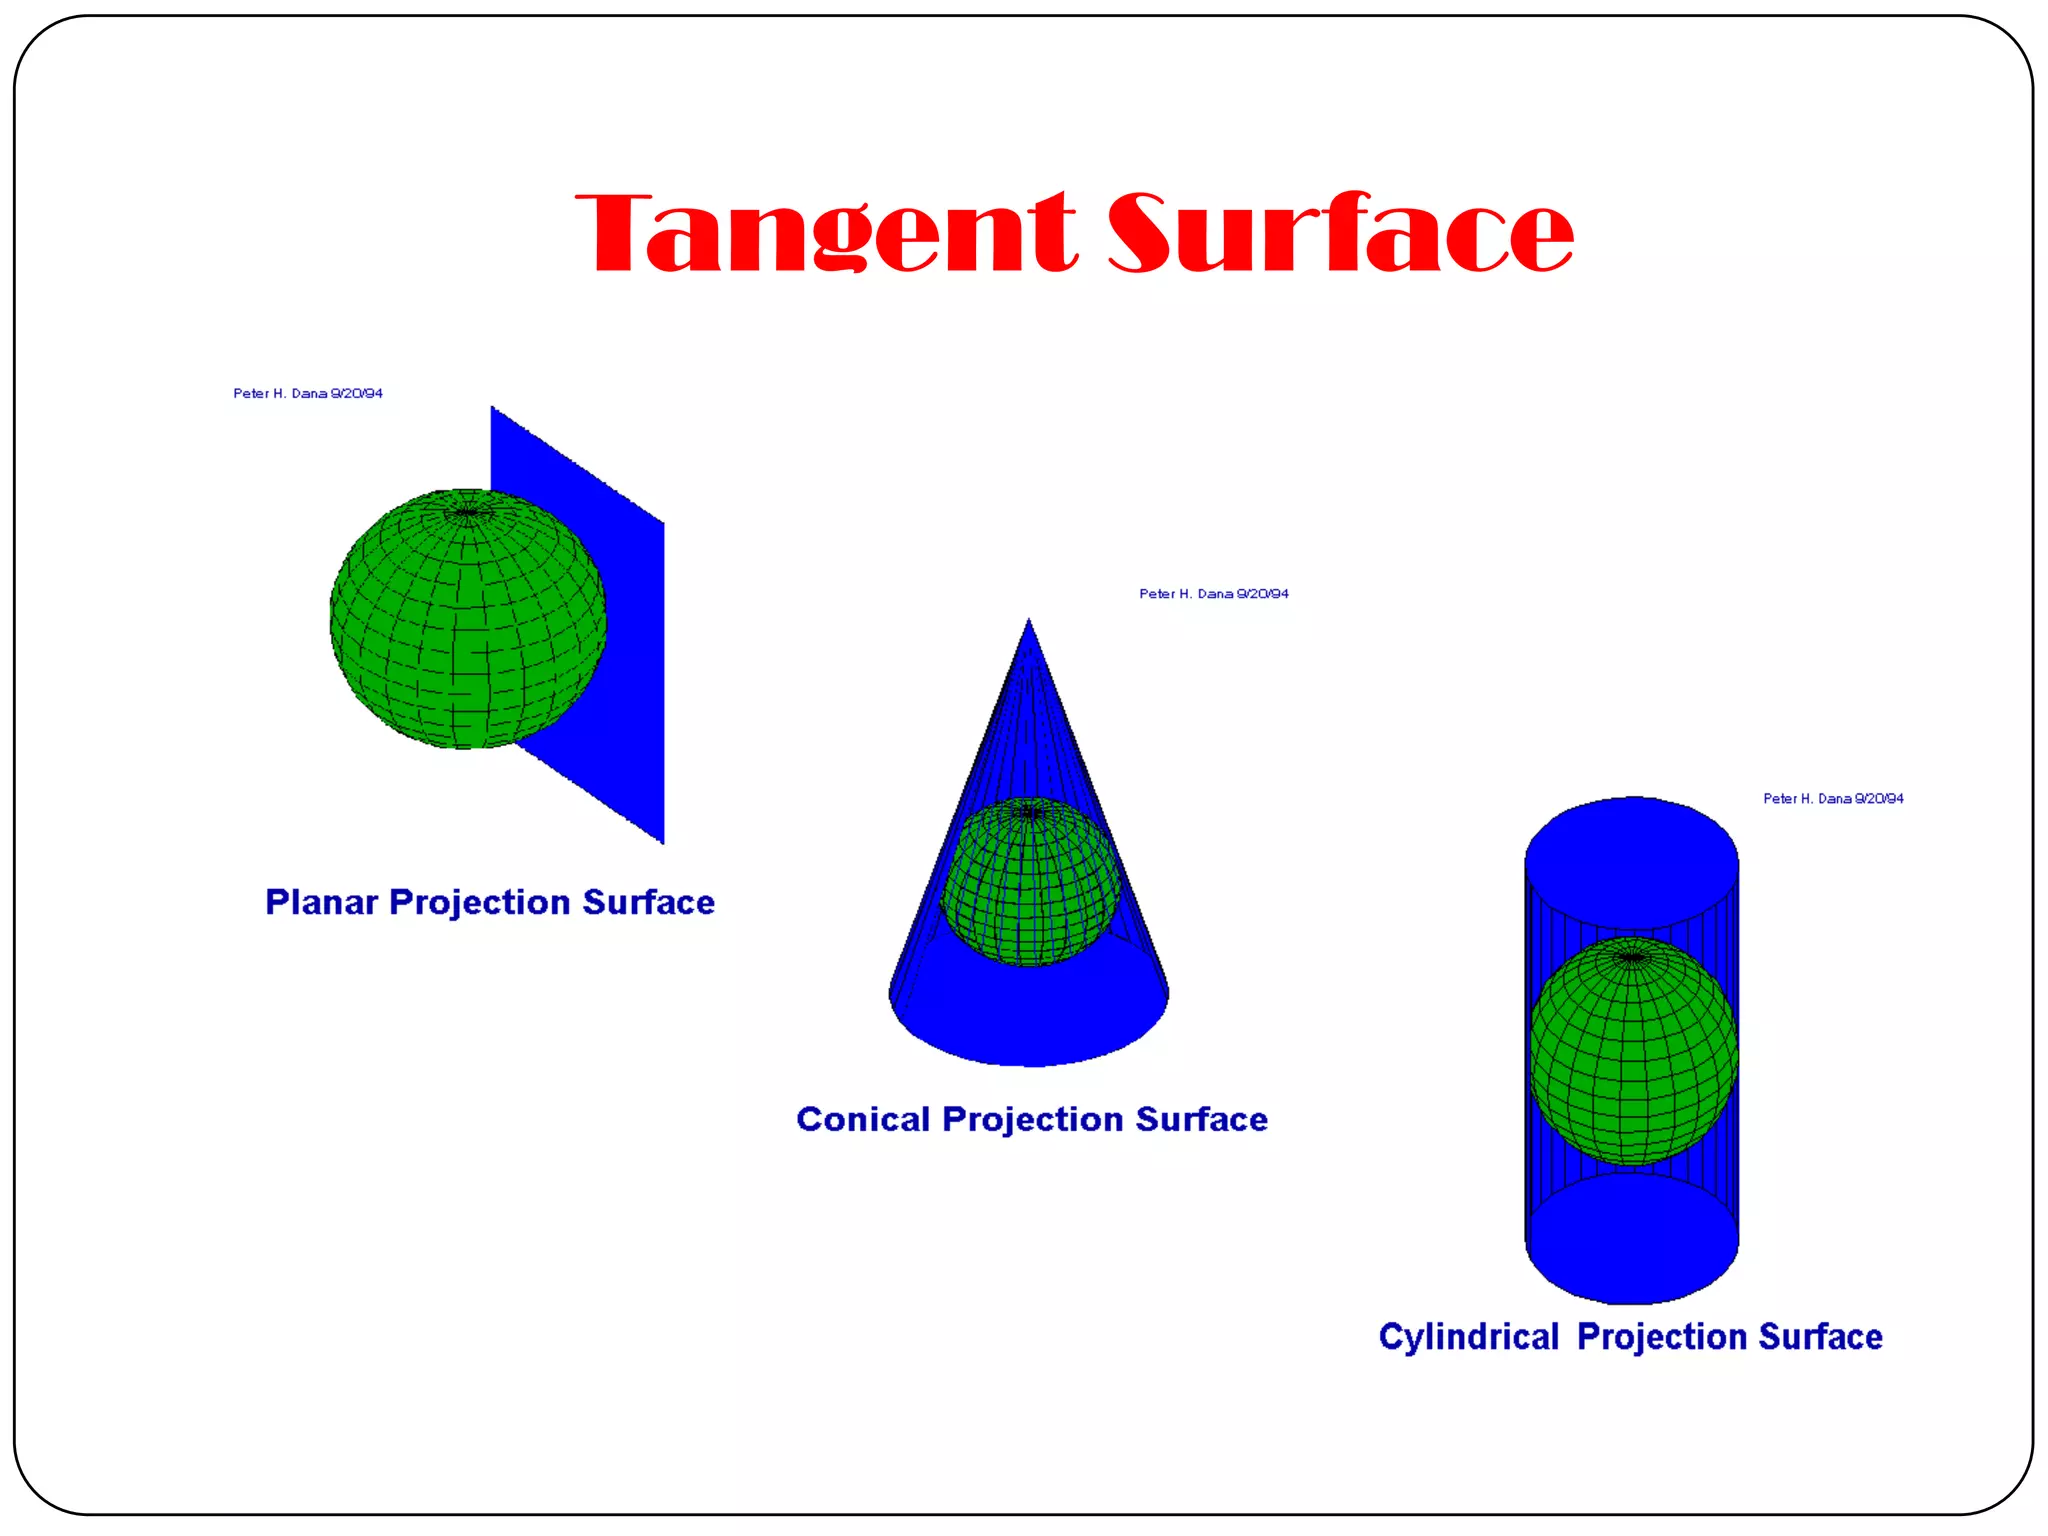
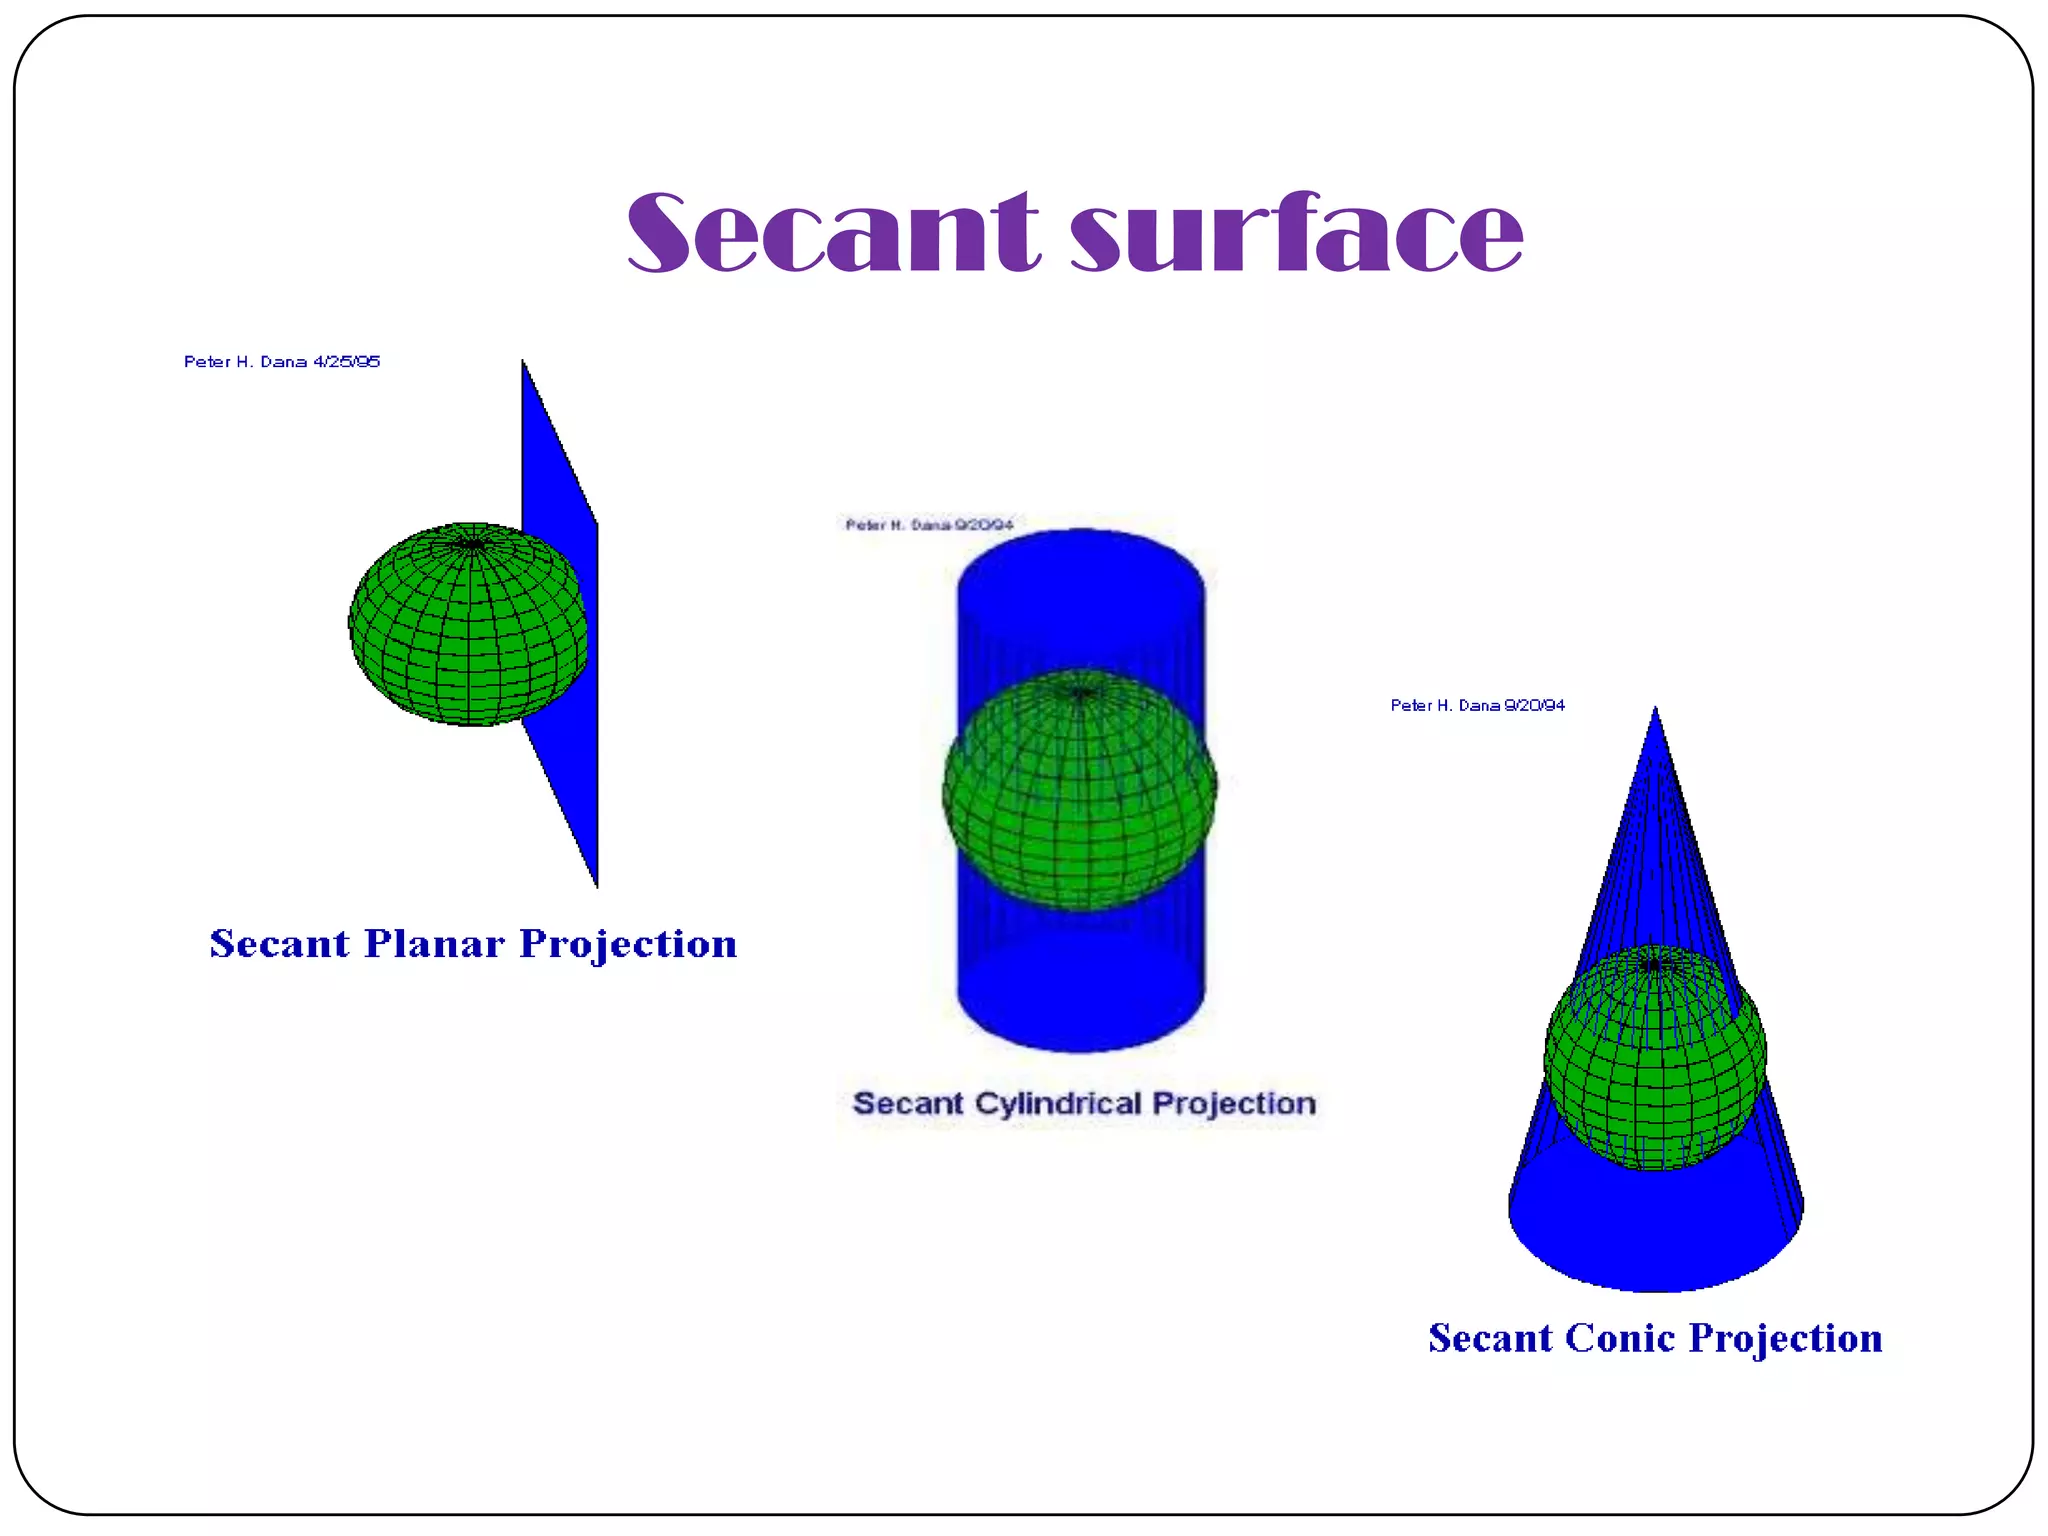
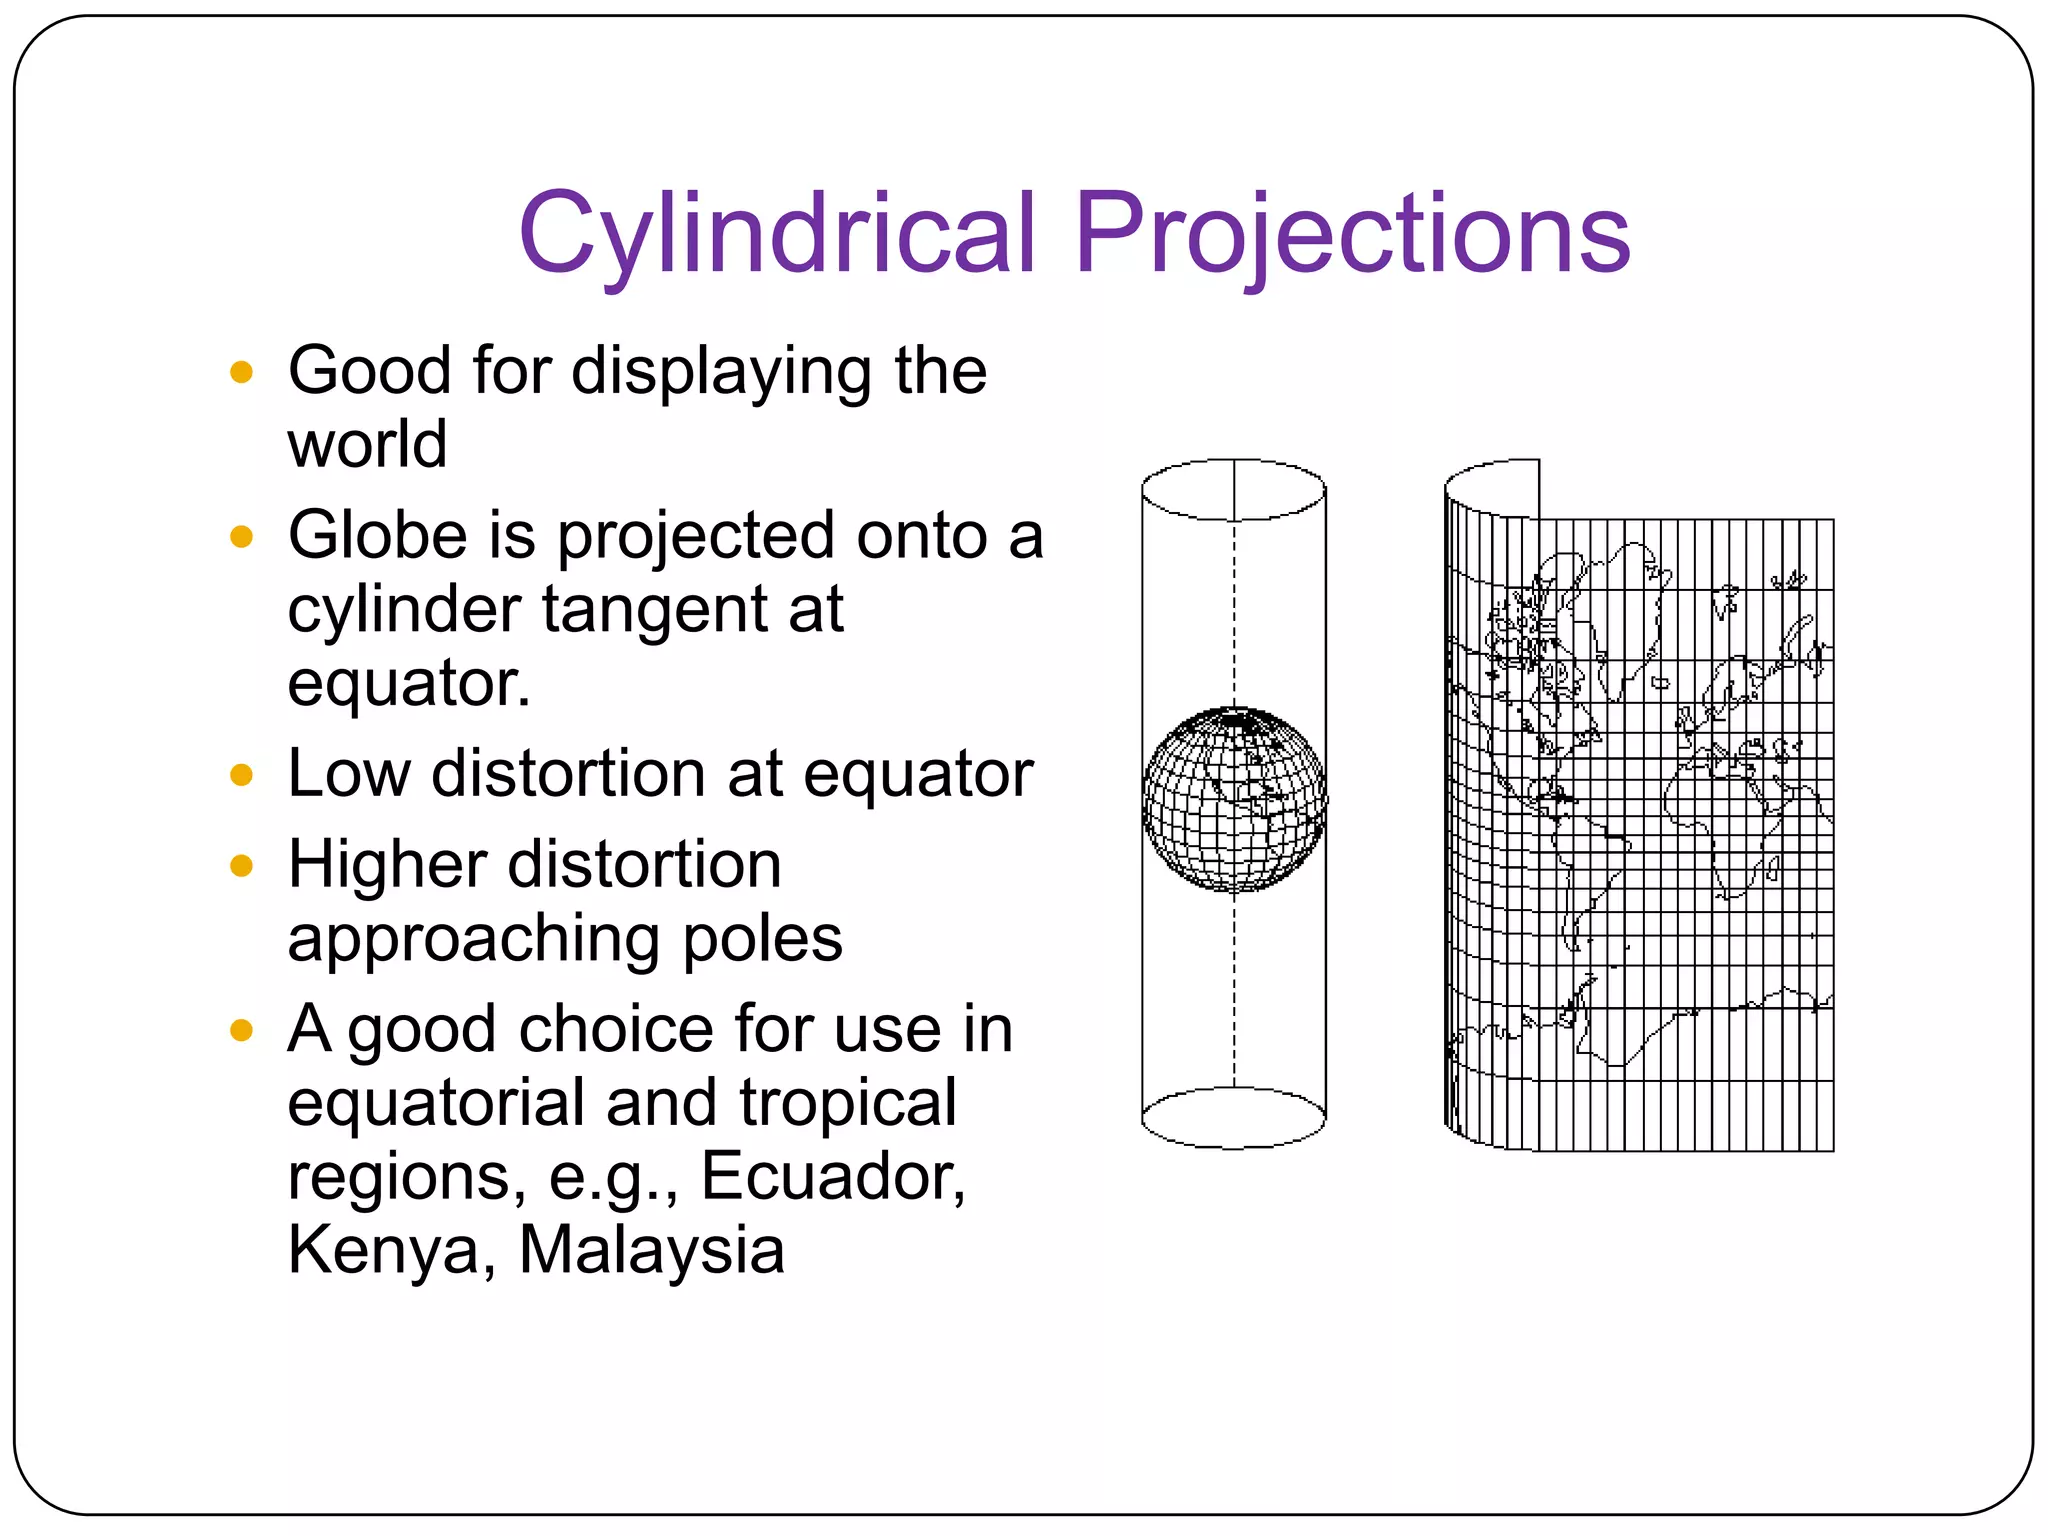
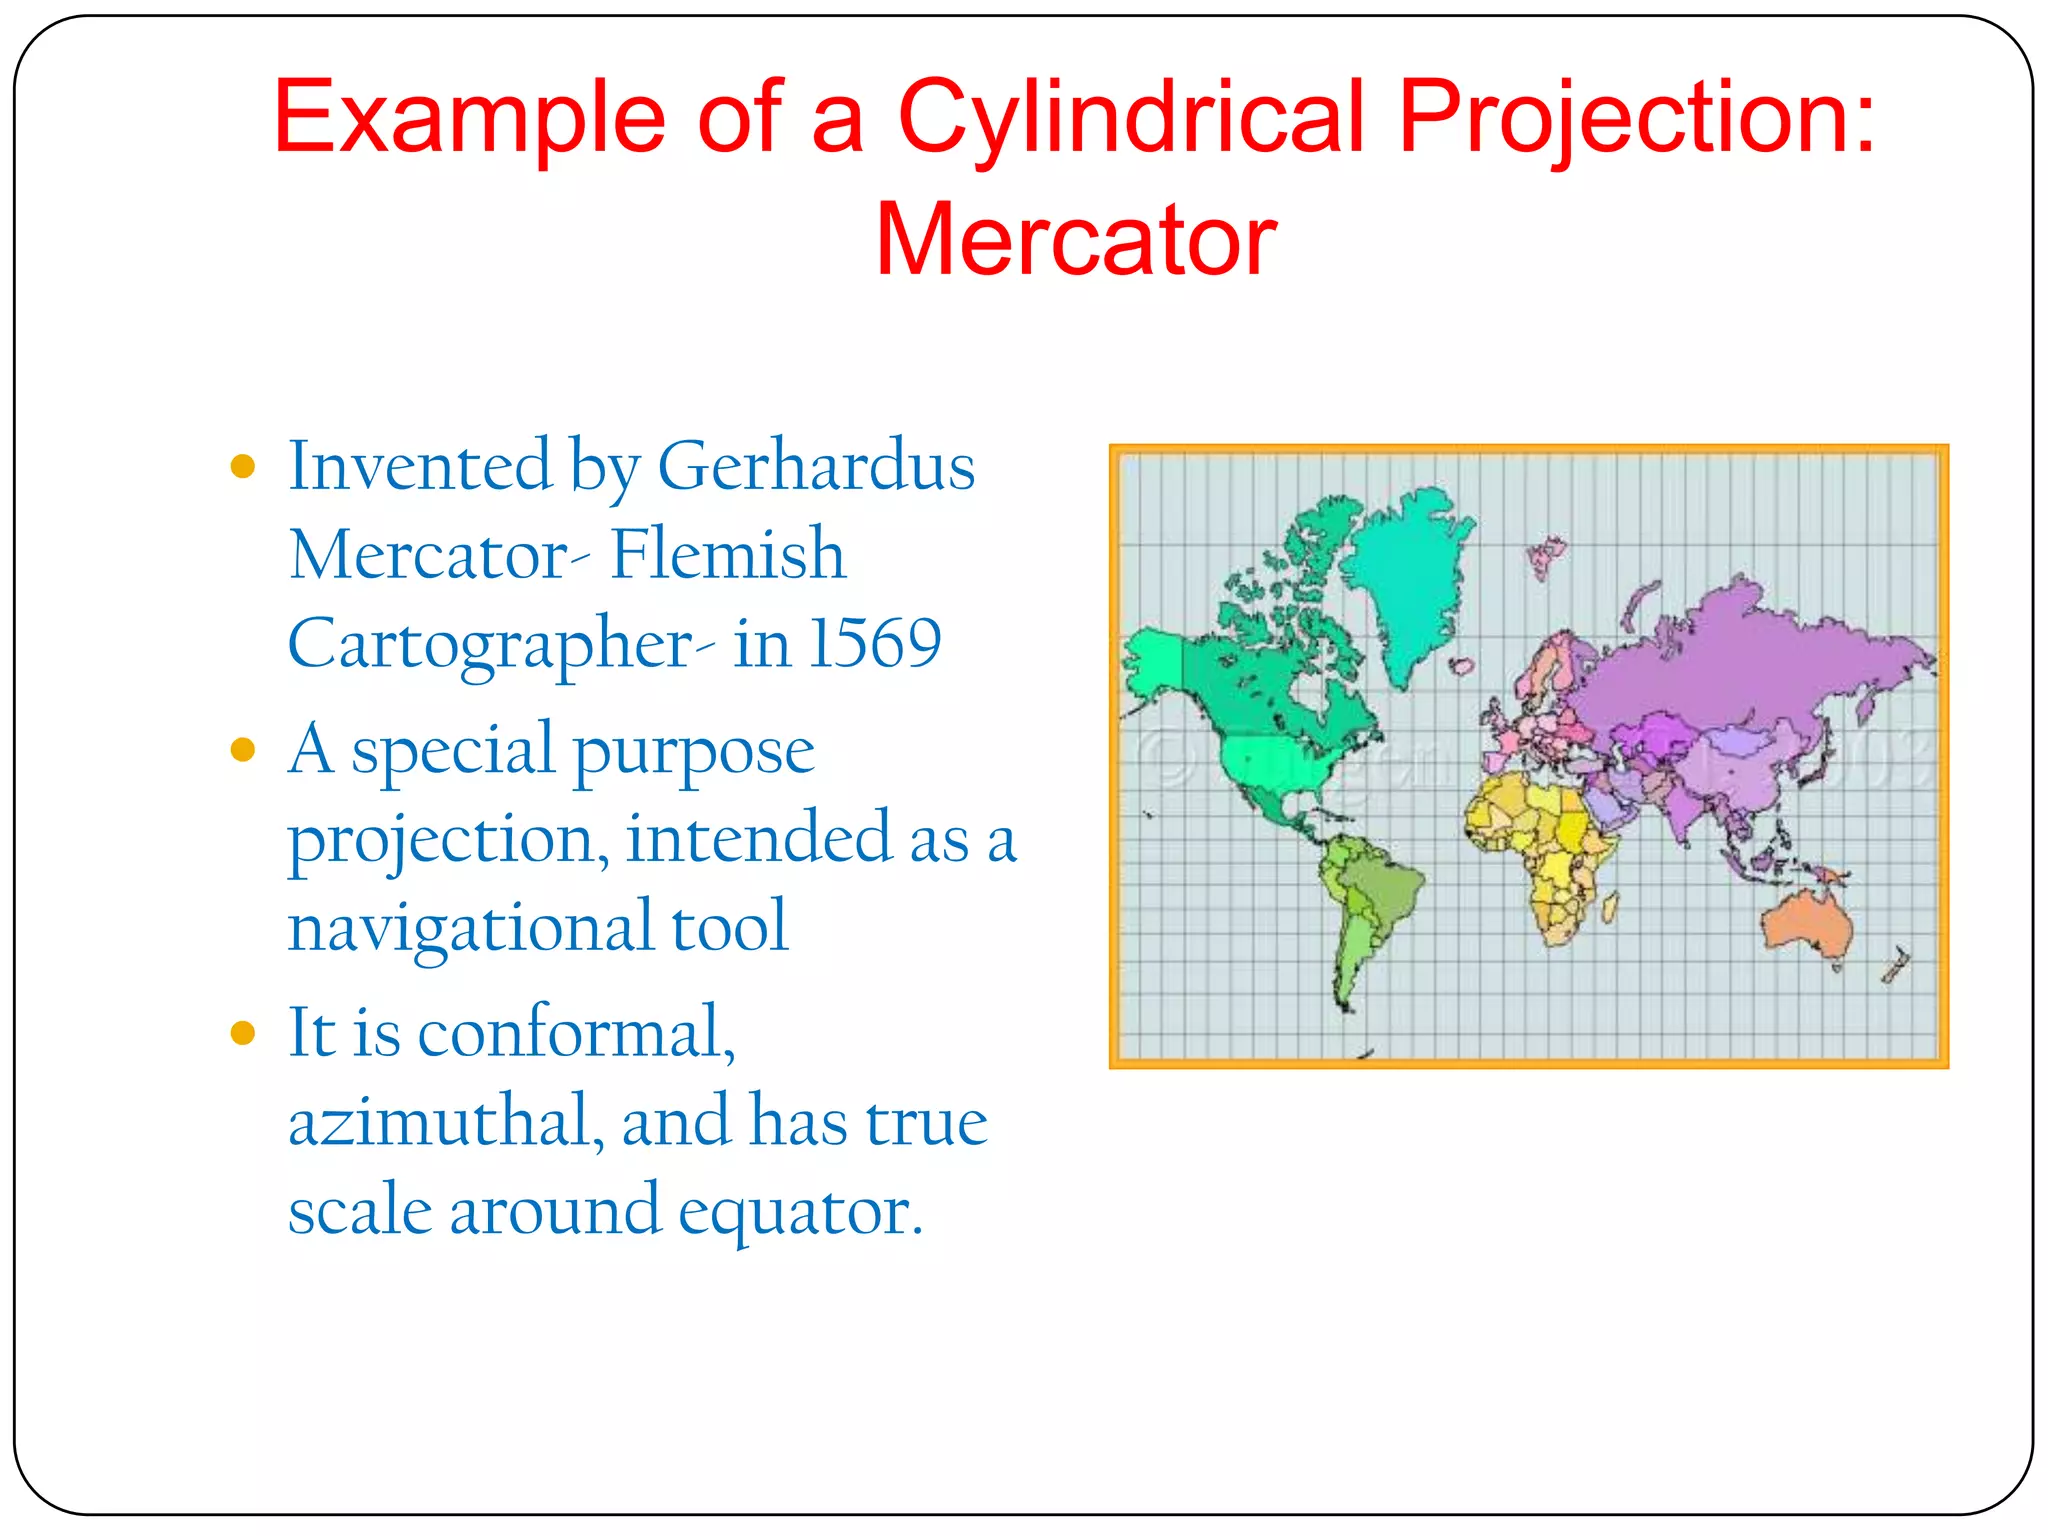
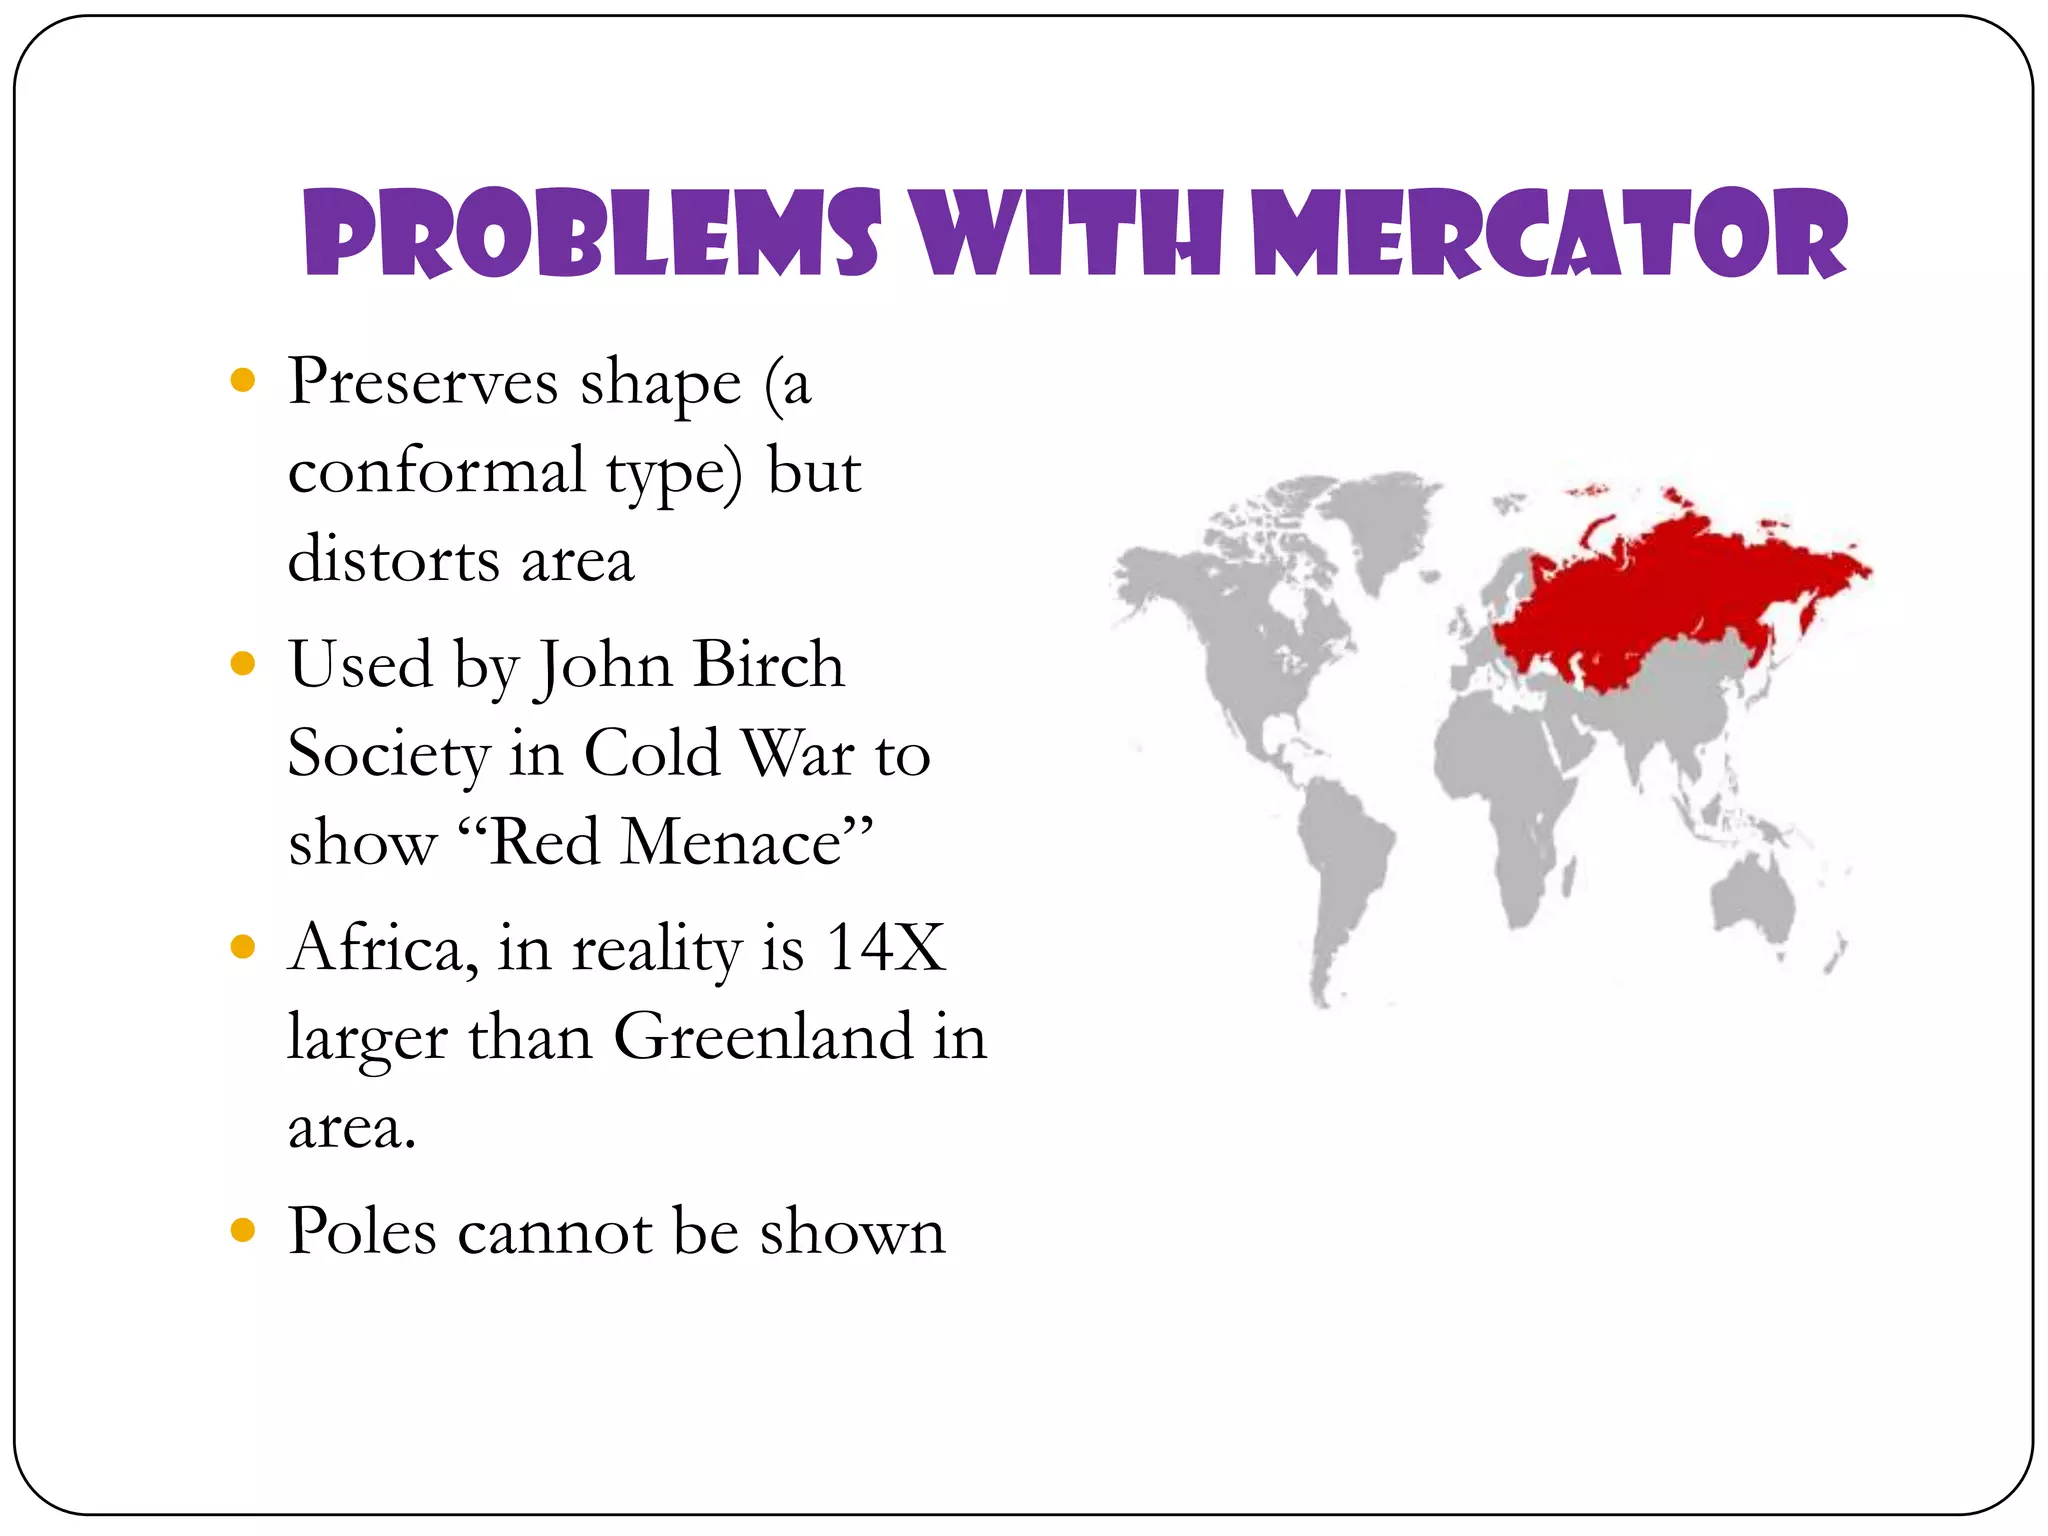
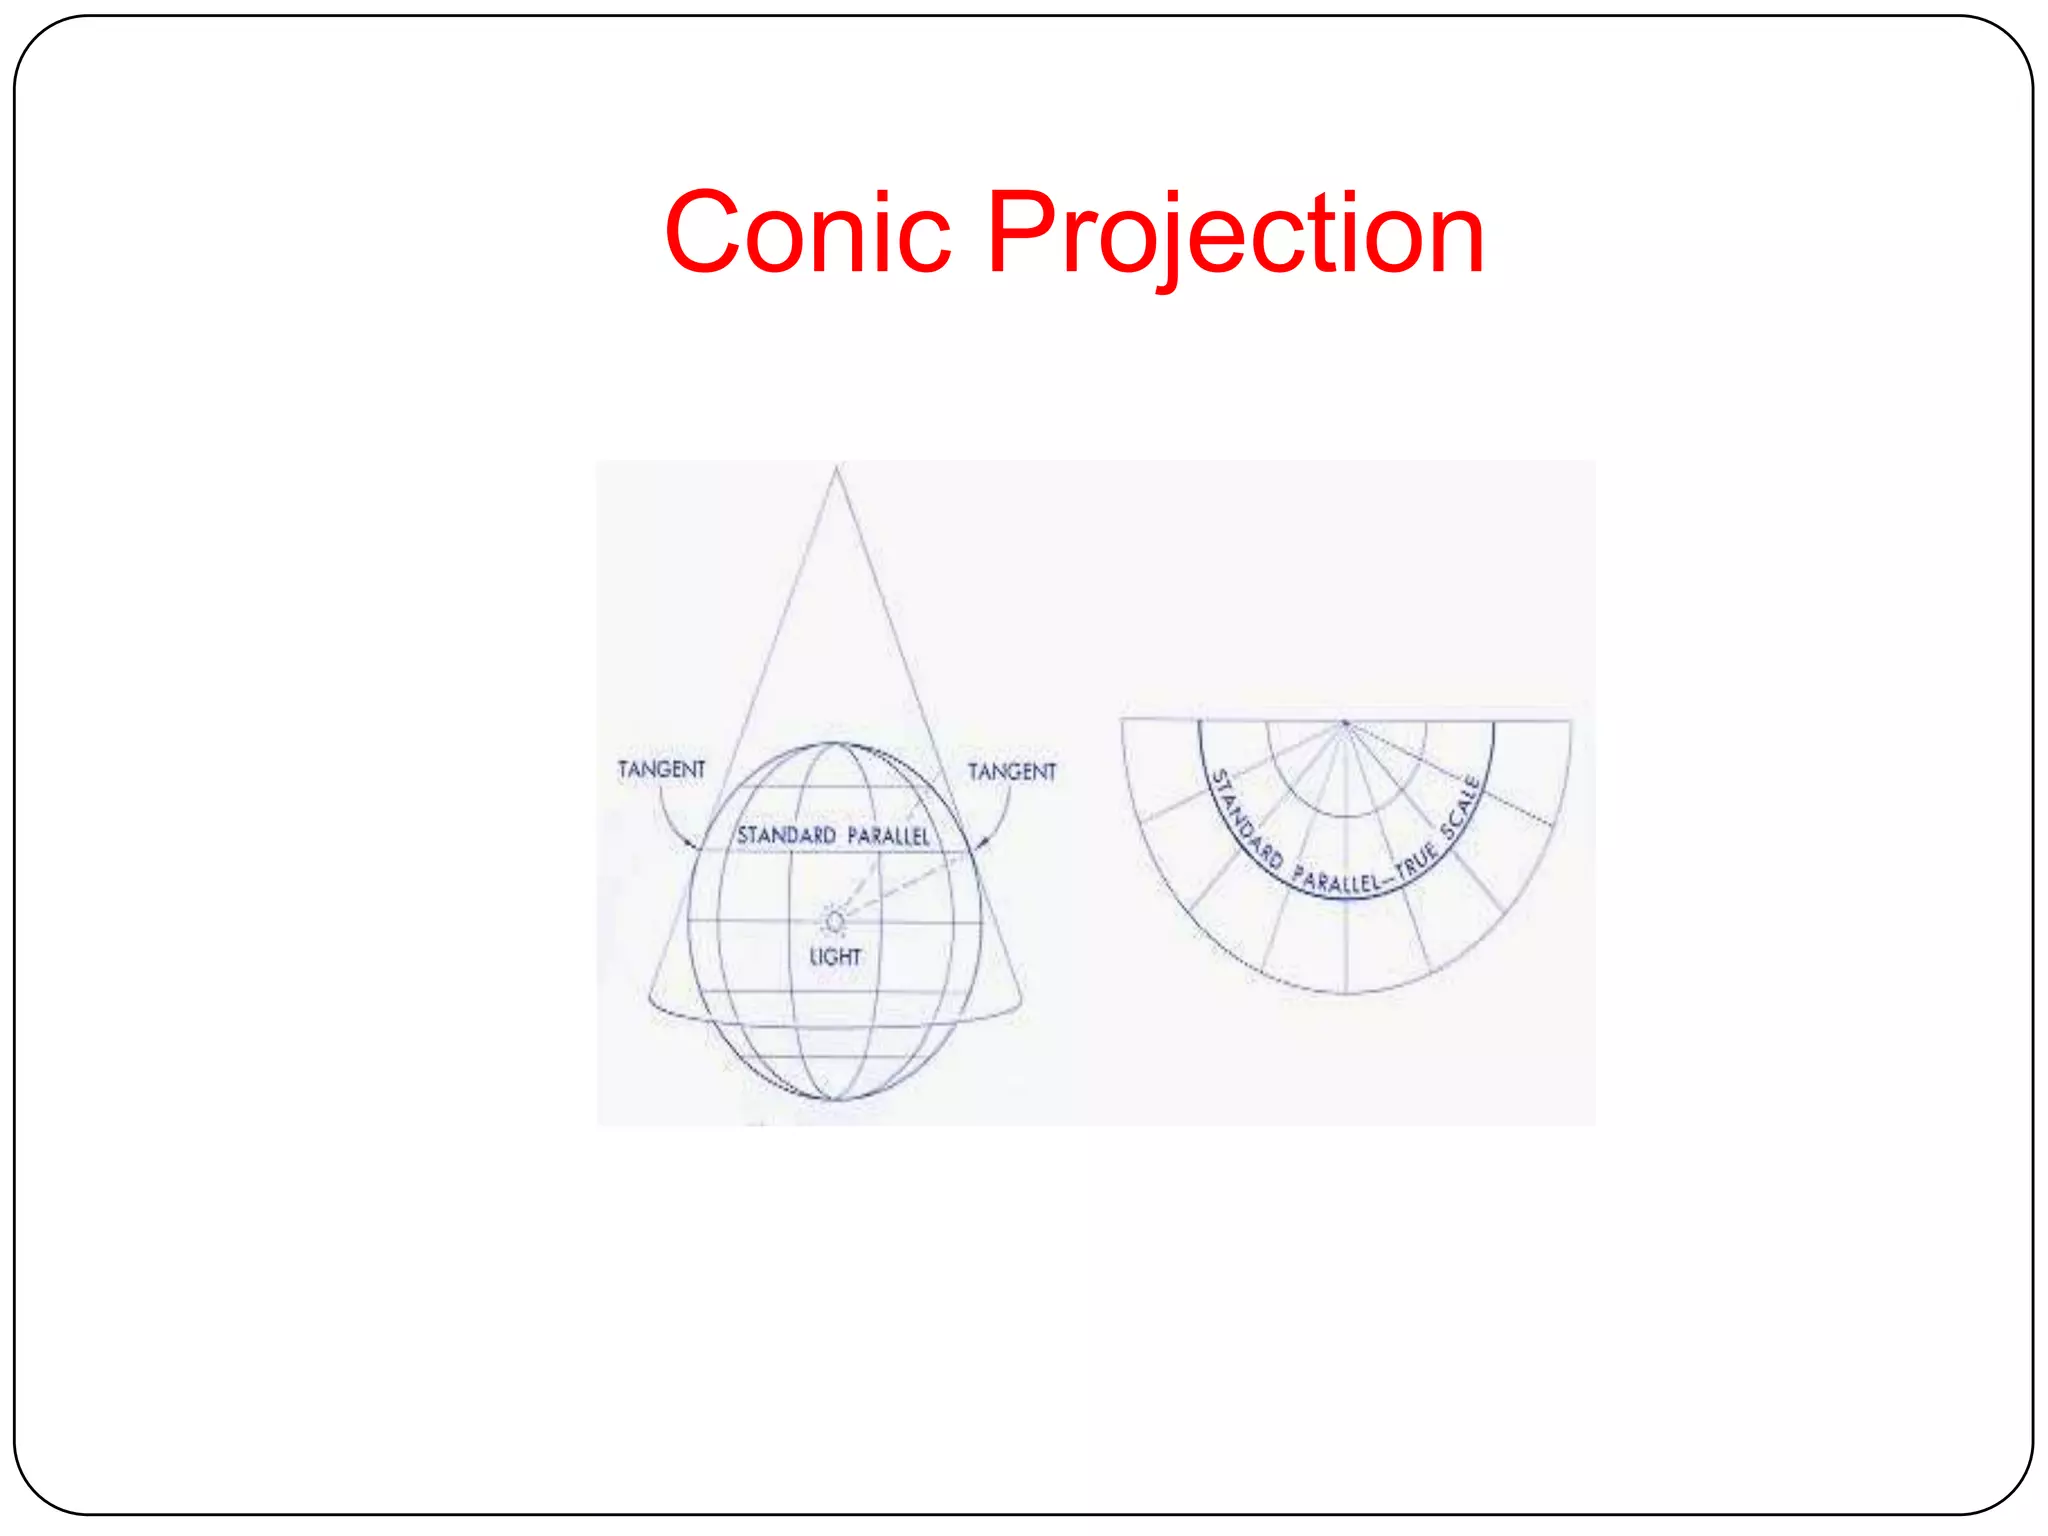
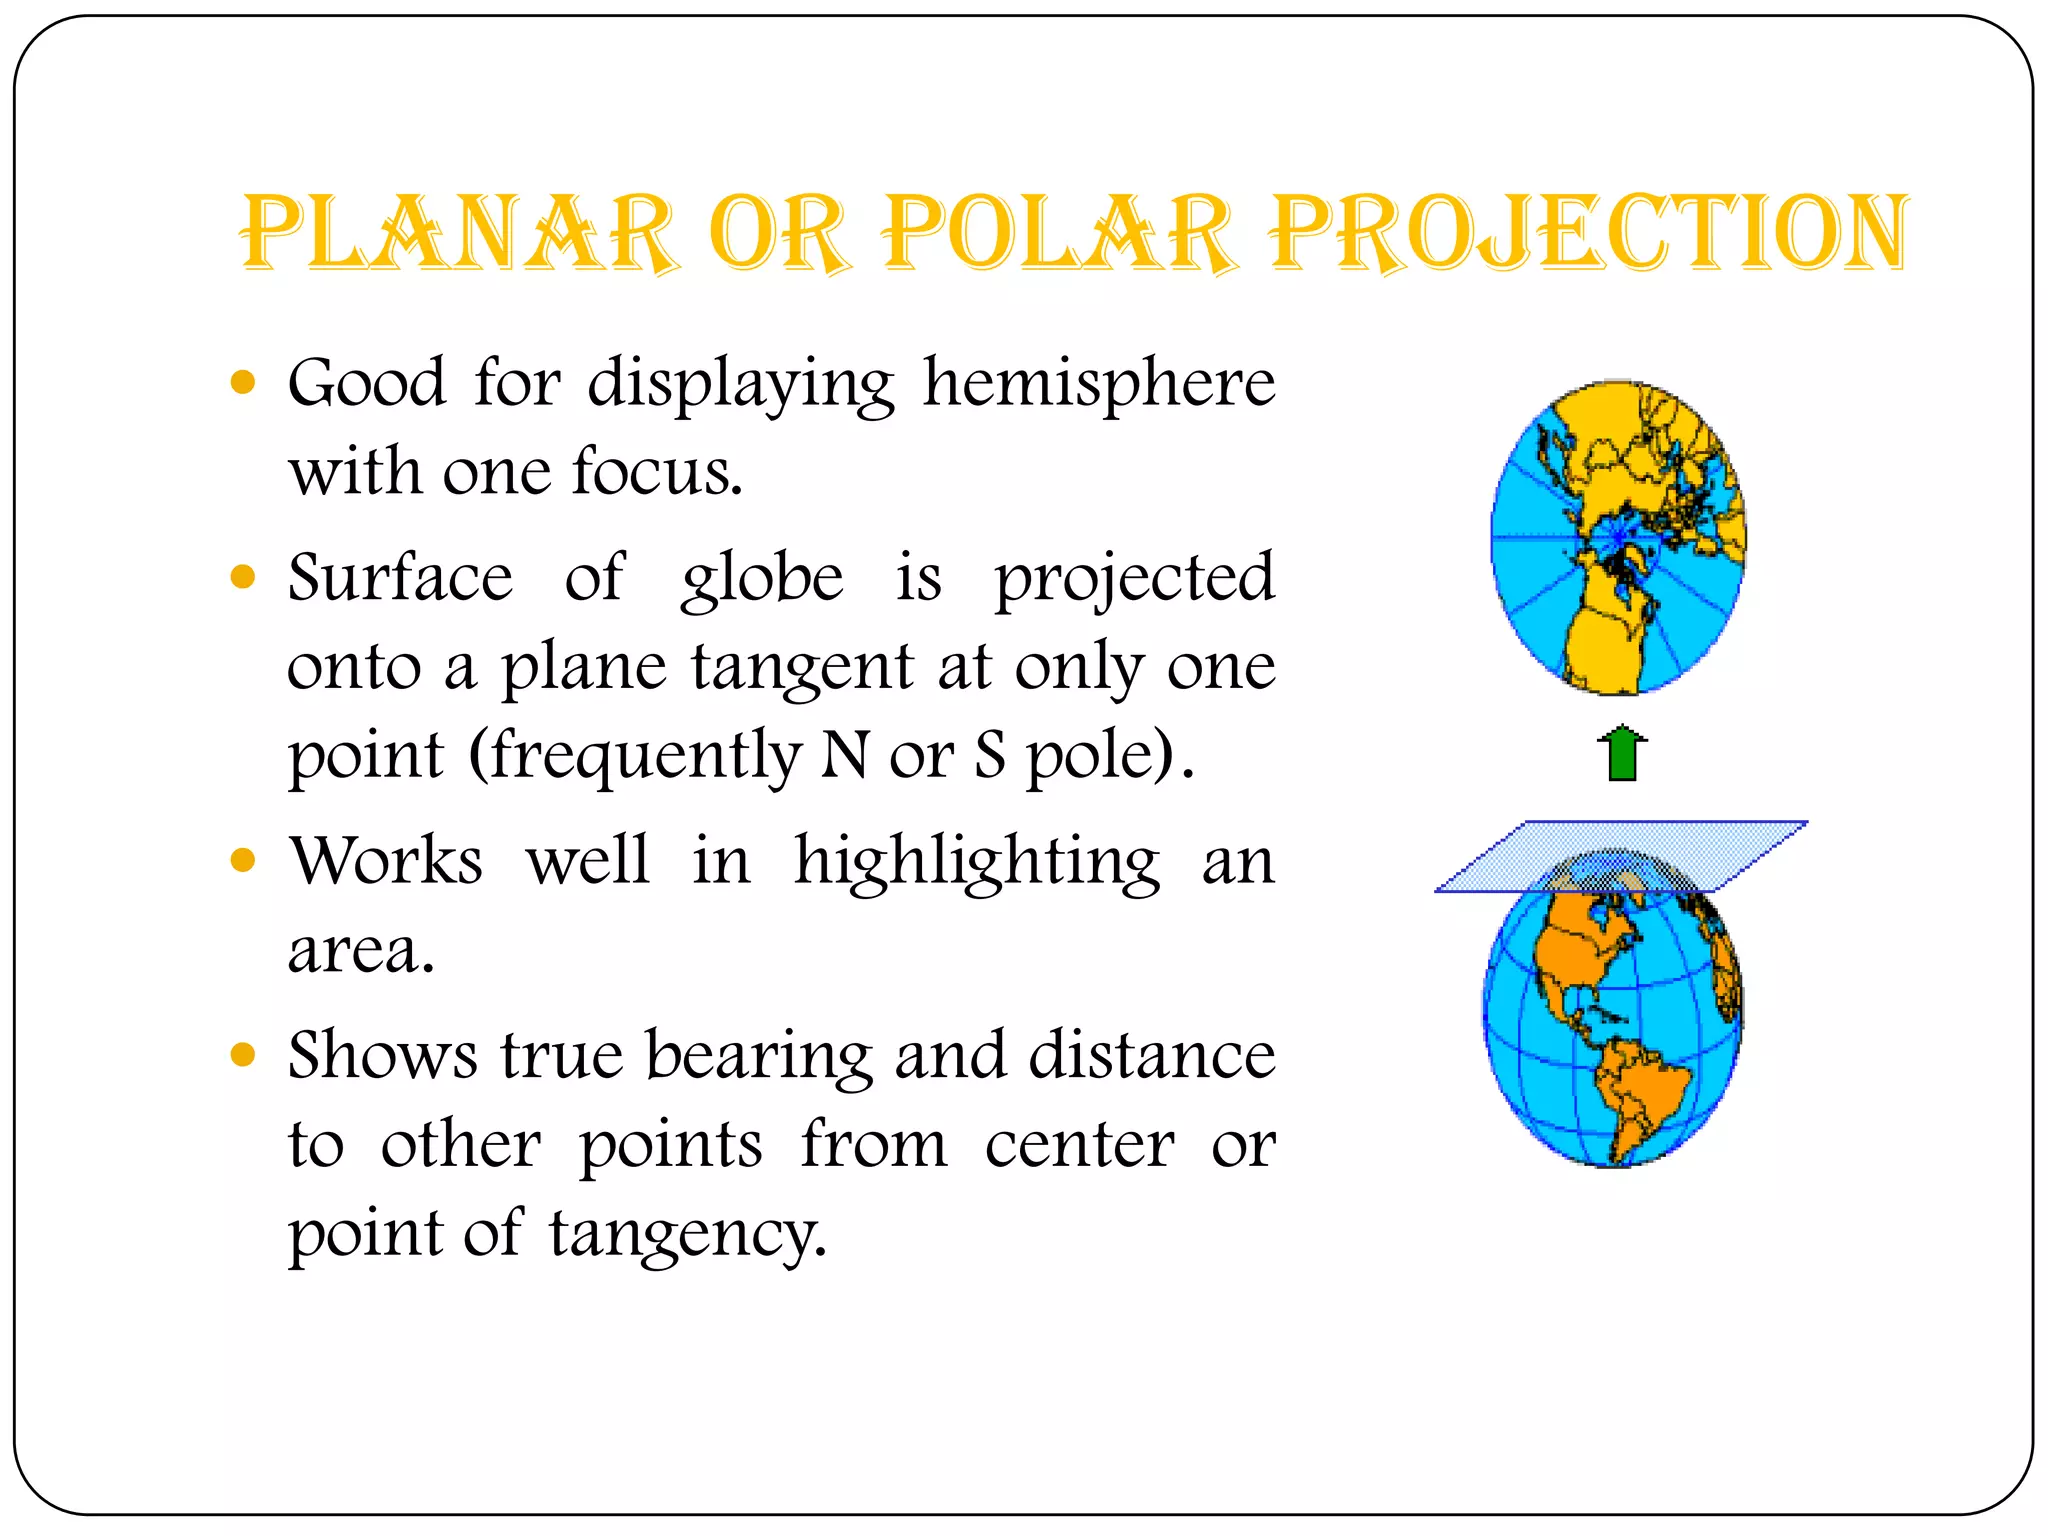
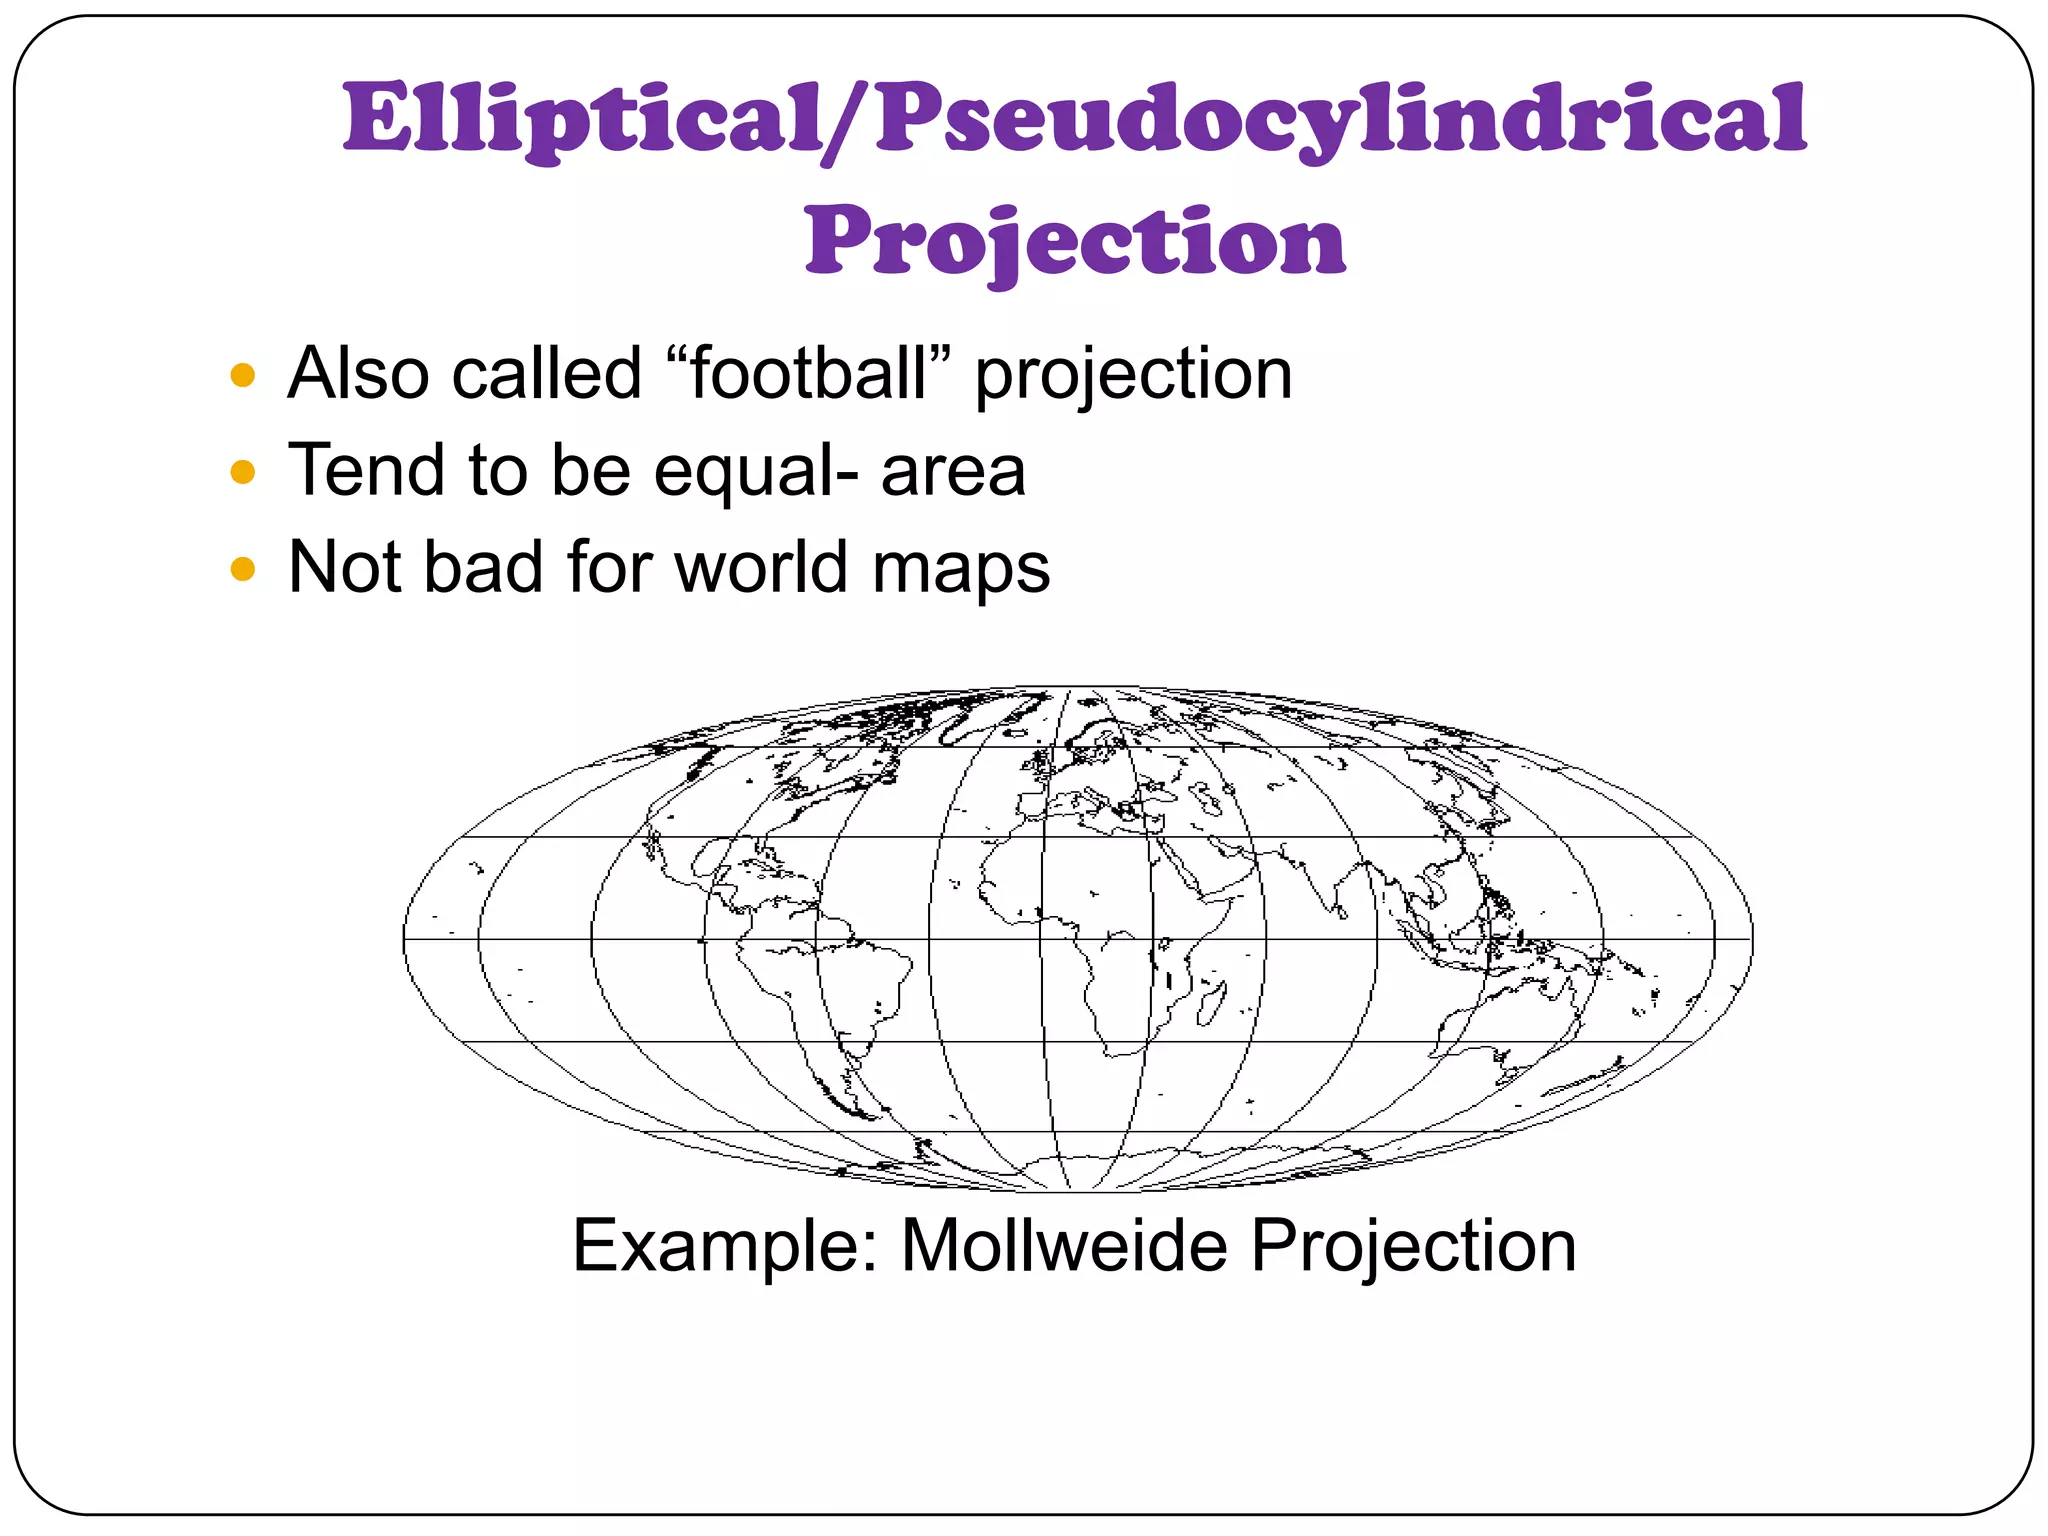
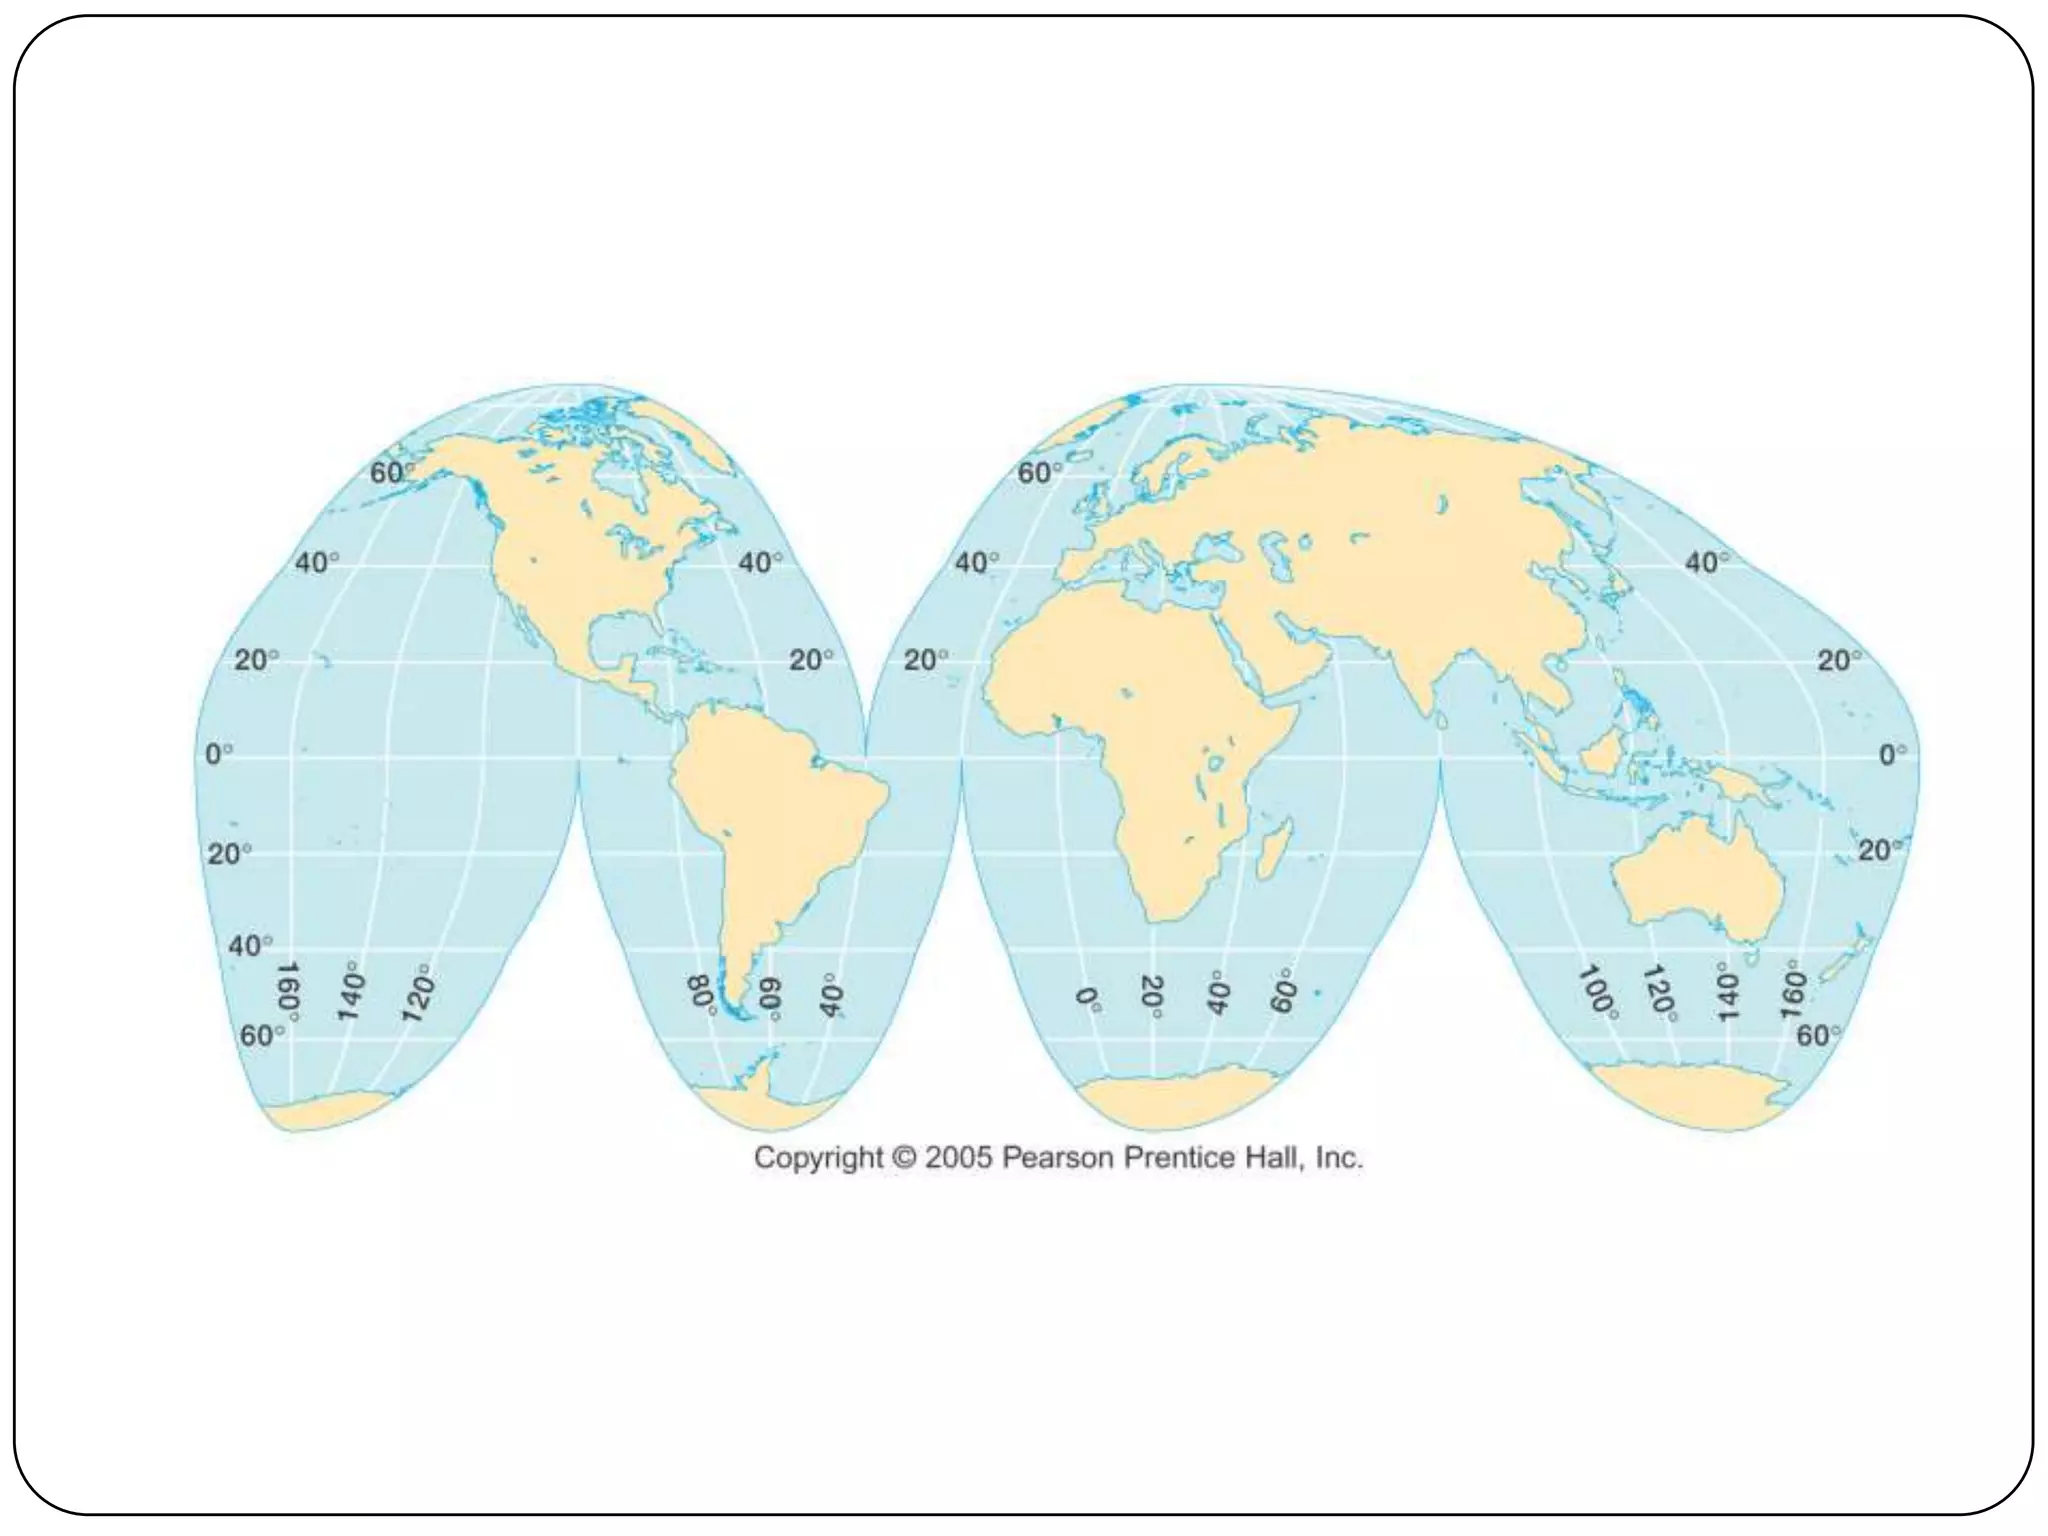


This document discusses map projections and their properties. Map projections transform the three-dimensional globe onto a two-dimensional surface, necessarily introducing some distortions. The best projection depends on the map's purpose and region. Common projections include cylindrical (like Mercator), conic, and planar/polar types. Key properties that projections aim to preserve, like shape, area, distance and direction, often involve tradeoffs. Choosing a projection minimizes distortions for a map's intended use and geographic extent.


![CTR_ppresentation[1RRRRRRRRRRRRRRRRR].pptx](https://cdn.slidesharecdn.com/ss_thumbnails/ctrppresentation1-250330155714-ac87e8bd-thumbnail.jpg?width=640&height=640&fit=bounds)


![Vibe Coding vs. Spec-Driven Development [Free Meetup]](https://cdn.slidesharecdn.com/ss_thumbnails/vibecodingvsspecdrivendevelopment-251209105622-43f455e7-thumbnail.jpg?width=640&height=640&fit=bounds)


