Downloaded 281 times
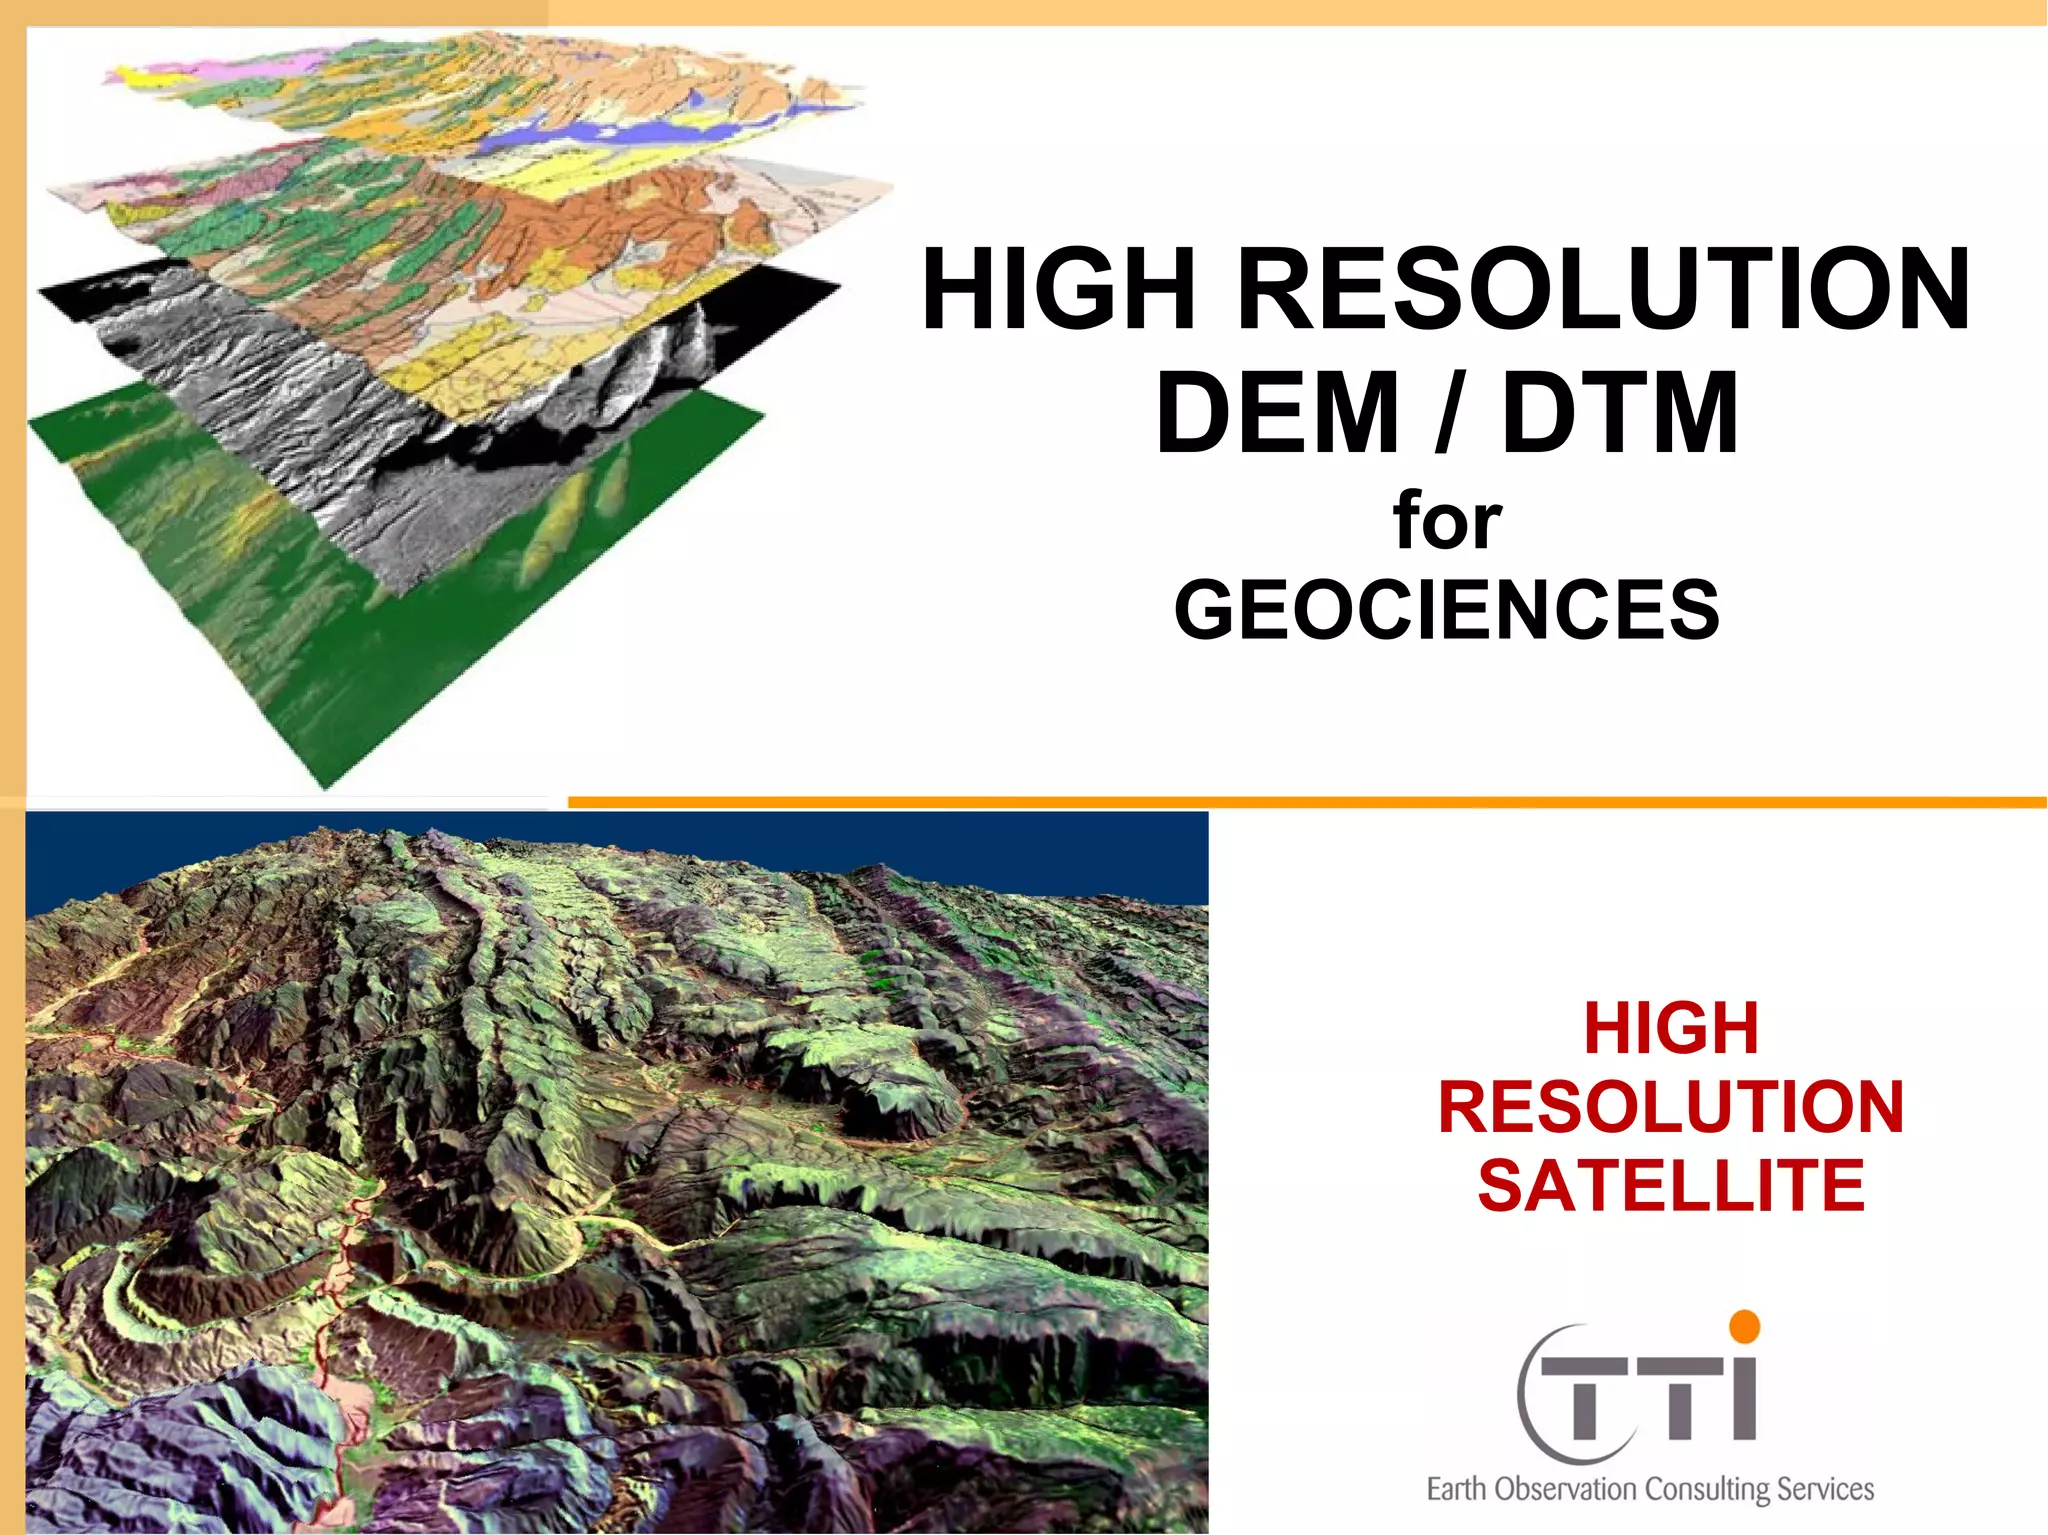
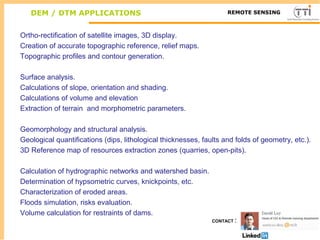
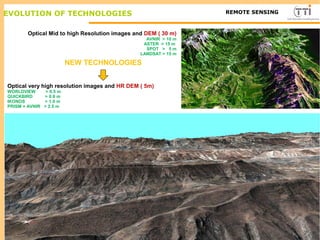
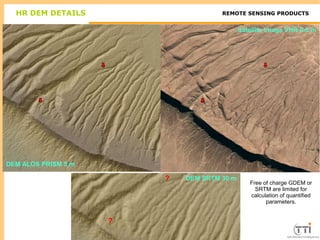
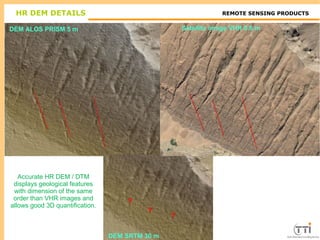
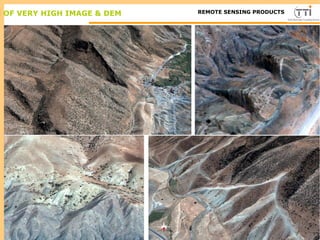
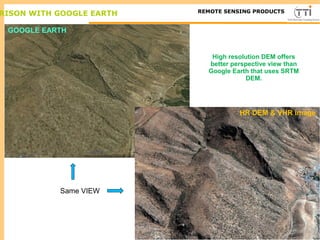
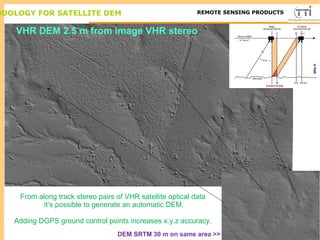
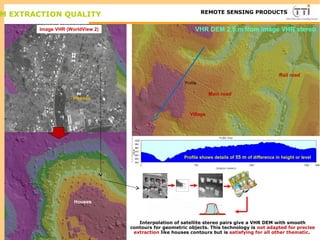
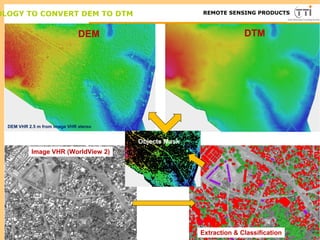
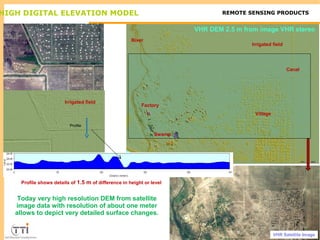
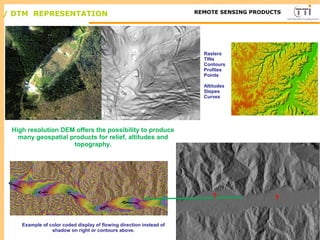
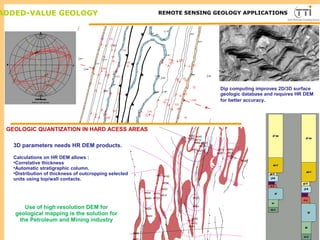
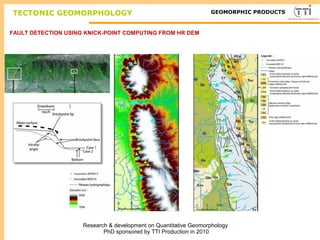
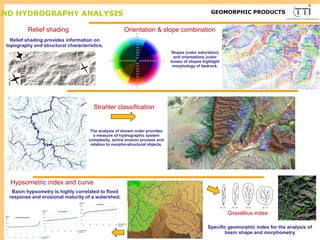
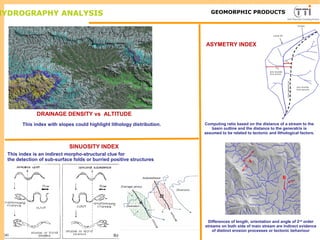

The document discusses high-resolution satellite imagery and digital elevation models (DEM/DTM) for various geoscience applications, including topographic analysis, geological mapping, and flood risk assessment. It highlights the capabilities of advanced technologies like LiDAR and satellite data in producing accurate geological features and topographic information, which are essential for resource extraction and environmental monitoring. Additionally, it underscores the significance of high-resolution DEM for improved spatial analysis and mapping accuracy in geological and hydrological studies.


![제 23회 보아즈(BOAZ) 빅데이터 컨퍼런스 - [MBOAX] : ABSA를 활용한 소비자 반응 분석 기반 운영 효율화 대시보드 설계](https://cdn.slidesharecdn.com/ss_thumbnails/3-1boaz23rdconferencemboax-260203102709-9d519923-thumbnail.jpg?width=640&height=640&fit=bounds)


