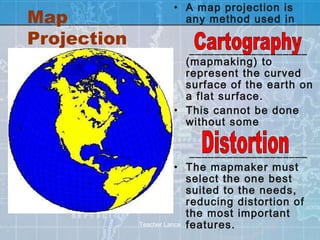
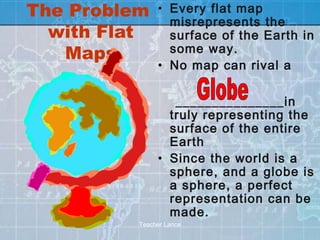
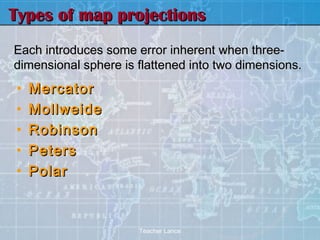
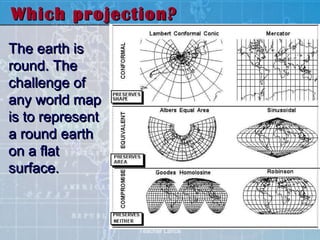
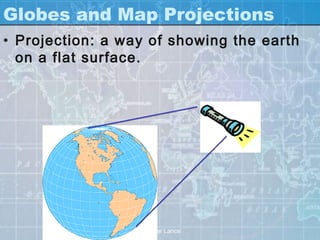
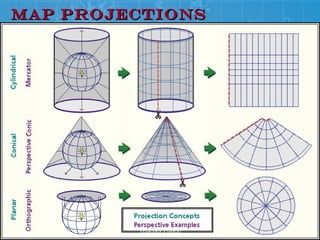
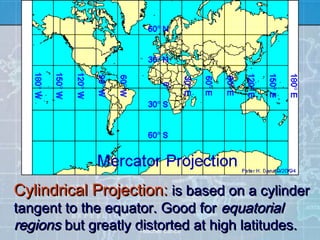
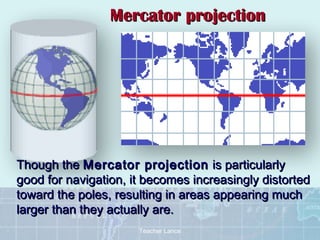
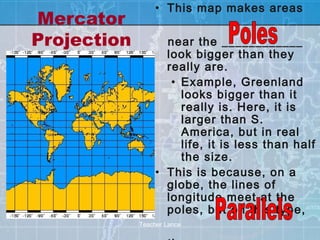
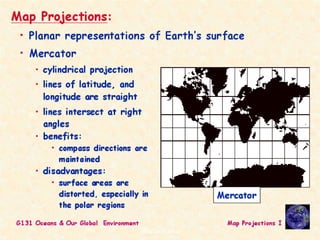
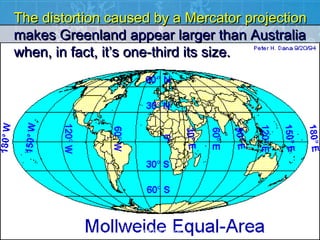
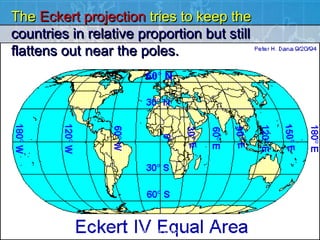
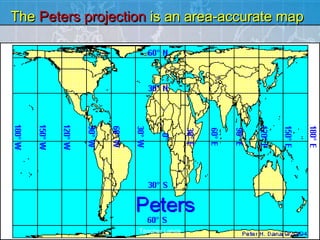
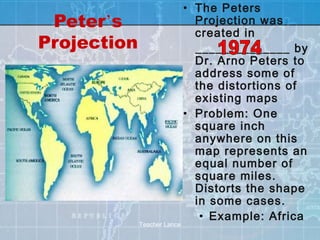
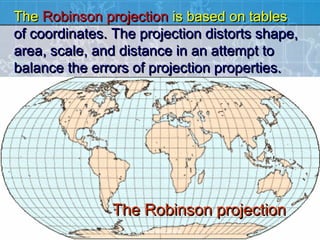
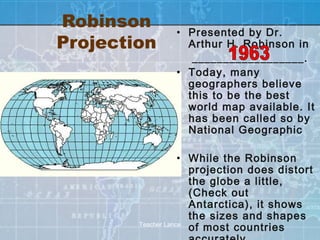
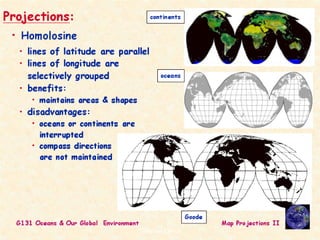
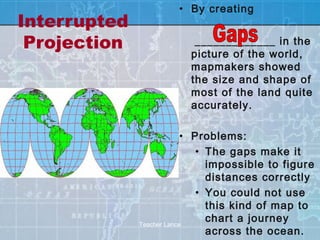
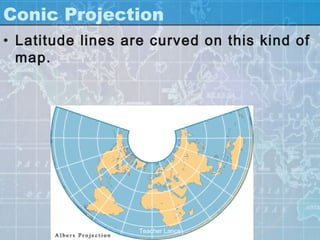
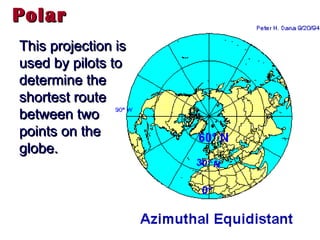
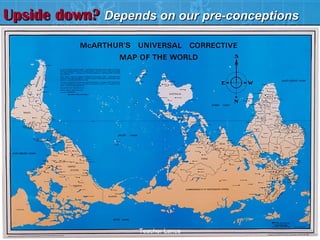
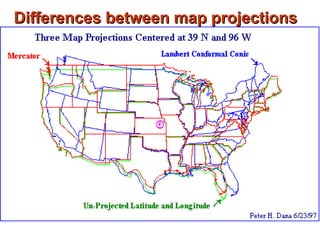
This document discusses different types of map projections and their tradeoffs in accurately representing the spherical Earth on a flat surface. It provides examples of common projections like Mercator, Robinson, and Peters and explains how they differently distort features like size, shape, and distance to prioritize certain map qualities. Overall, no single projection is perfect, and mapmakers have devised many methods to flatten the globe while minimizing distortions for specific mapping needs.
Map is a drawn or printed representation of the physical features of the Earth.
It is the best tool to show, understand and analyse the features of an area. Cartography is the art and science of making maps. This module highlights many information on maps, types and their uses.
Map projection is a systematic drawing of parallel of latitudes and meridians of longitude on a plane surface for the whole earth or a part of it on a certain scale so that any point on the earth surface may correspond to that on the drawing.
Maps cannot be created without map projections. All map projections necessarily distort the surface in some fashion.
Depending on the purpose of the map, some distortions are acceptable and others are not; therefore, different map projections exist in order to preserve some properties of the sphere-like body at the expense of other properties.
There is no limit to the number of possible map projections.
A map projection is a systematic transformation of the latitudes and longitudes of locations from the surface of a sphere or an ellipsoid into locations on a plane. Maps cannot be created without map projections.
Topics:
1. Mapping Concepts
2. Analysis with paper based Maps
3. Limitations of Paper based Maps
4. Computer Aided Cartography History and Development
5. GIS Definition
6. Advantage of Digital Maps
Cartography is the art, science and technology of map making.
Maps are used as research tools and as sources of information.
Maps have existed since the time of the Egyptian, Mesopotamian and Chinese civilizations, with the latter maps dating back to 6000 years.
Geographical Information System (GIS) Georeferencing and Digitization, Bihar ...Kamlesh Kumar
This work is an effort to share Geographical Information System: Georeferencing, digitization and map making steps through QGIS 2.0.1
Georeferencing
Digitization of Topographical sheet
Point
Line
Area
Bihar Map
District Headquarters
Railway of Bihar
District Boundaries
Thematic Maps (Literacy & Sex Ratio)
One of most important topics in ArcGIS and GIS, is coordinate system, the slides will cover this topic in order to understand the difference between various coordinate systems.
This Presentation is to made concepts about measuring the earth (to locate position of any person on the whole earth). For this purpose we re going step by step basis in this presentation.These steps are mentioned as contents. After that you may able to learn about measuring a person's position of earth. Thank you!
Let's dive deeper into the world of ODC! Ricardo Alves (OutSystems) will join us to tell all about the new Data Fabric. After that, Sezen de Bruijn (OutSystems) will get into the details on how to best design a sturdy architecture within ODC.
UiPath Test Automation using UiPath Test Suite series, part 4DianaGray10
Welcome to UiPath Test Automation using UiPath Test Suite series part 4. In this session, we will cover Test Manager overview along with SAP heatmap.
The UiPath Test Manager overview with SAP heatmap webinar offers a concise yet comprehensive exploration of the role of a Test Manager within SAP environments, coupled with the utilization of heatmaps for effective testing strategies.
Participants will gain insights into the responsibilities, challenges, and best practices associated with test management in SAP projects. Additionally, the webinar delves into the significance of heatmaps as a visual aid for identifying testing priorities, areas of risk, and resource allocation within SAP landscapes. Through this session, attendees can expect to enhance their understanding of test management principles while learning practical approaches to optimize testing processes in SAP environments using heatmap visualization techniques
What will you get from this session?
1. Insights into SAP testing best practices
2. Heatmap utilization for testing
3. Optimization of testing processes
4. Demo
Topics covered:
Execution from the test manager
Orchestrator execution result
Defect reporting
SAP heatmap example with demo
Speaker:
Deepak Rai, Automation Practice Lead, Boundaryless Group and UiPath MVP
"Impact of front-end architecture on development cost", Viktor TurskyiFwdays
I have heard many times that architecture is not important for the front-end. Also, many times I have seen how developers implement features on the front-end just following the standard rules for a framework and think that this is enough to successfully launch the project, and then the project fails. How to prevent this and what approach to choose? I have launched dozens of complex projects and during the talk we will analyze which approaches have worked for me and which have not.
Builder.ai Founder Sachin Dev Duggal's Strategic Approach to Create an Innova...Ramesh Iyer
In today's fast-changing business world, Companies that adapt and embrace new ideas often need help to keep up with the competition. However, fostering a culture of innovation takes much work. It takes vision, leadership and willingness to take risks in the right proportion. Sachin Dev Duggal, co-founder of Builder.ai, has perfected the art of this balance, creating a company culture where creativity and growth are nurtured at each stage.
Key Trends Shaping the Future of Infrastructure.pdfCheryl Hung
Keynote at DIGIT West Expo, Glasgow on 29 May 2024.
Cheryl Hung, ochery.com
Sr Director, Infrastructure Ecosystem, Arm.
The key trends across hardware, cloud and open-source; exploring how these areas are likely to mature and develop over the short and long-term, and then considering how organisations can position themselves to adapt and thrive.
Connector Corner: Automate dynamic content and events by pushing a buttonDianaGray10
Here is something new! In our next Connector Corner webinar, we will demonstrate how you can use a single workflow to:
Create a campaign using Mailchimp with merge tags/fields
Send an interactive Slack channel message (using buttons)
Have the message received by managers and peers along with a test email for review
But there’s more:
In a second workflow supporting the same use case, you’ll see:
Your campaign sent to target colleagues for approval
If the “Approve” button is clicked, a Jira/Zendesk ticket is created for the marketing design team
But—if the “Reject” button is pushed, colleagues will be alerted via Slack message
Join us to learn more about this new, human-in-the-loop capability, brought to you by Integration Service connectors.
And...
Speakers:
Akshay Agnihotri, Product Manager
Charlie Greenberg, Host
LF Energy Webinar: Electrical Grid Modelling and Simulation Through PowSyBl -...DanBrown980551
Do you want to learn how to model and simulate an electrical network from scratch in under an hour?
Then welcome to this PowSyBl workshop, hosted by Rte, the French Transmission System Operator (TSO)!
During the webinar, you will discover the PowSyBl ecosystem as well as handle and study an electrical network through an interactive Python notebook.
PowSyBl is an open source project hosted by LF Energy, which offers a comprehensive set of features for electrical grid modelling and simulation. Among other advanced features, PowSyBl provides:
- A fully editable and extendable library for grid component modelling;
- Visualization tools to display your network;
- Grid simulation tools, such as power flows, security analyses (with or without remedial actions) and sensitivity analyses;
The framework is mostly written in Java, with a Python binding so that Python developers can access PowSyBl functionalities as well.
What you will learn during the webinar:
- For beginners: discover PowSyBl's functionalities through a quick general presentation and the notebook, without needing any expert coding skills;
- For advanced developers: master the skills to efficiently apply PowSyBl functionalities to your real-world scenarios.
Accelerate your Kubernetes clusters with Varnish CachingThijs Feryn
A presentation about the usage and availability of Varnish on Kubernetes. This talk explores the capabilities of Varnish caching and shows how to use the Varnish Helm chart to deploy it to Kubernetes.
This presentation was delivered at K8SUG Singapore. See https://feryn.eu/presentations/accelerate-your-kubernetes-clusters-with-varnish-caching-k8sug-singapore-28-2024 for more details.
The Art of the Pitch: WordPress Relationships and SalesLaura Byrne
Clients don’t know what they don’t know. What web solutions are right for them? How does WordPress come into the picture? How do you make sure you understand scope and timeline? What do you do if sometime changes?
All these questions and more will be explored as we talk about matching clients’ needs with what your agency offers without pulling teeth or pulling your hair out. Practical tips, and strategies for successful relationship building that leads to closing the deal.
Neuro-symbolic is not enough, we need neuro-*semantic*Frank van Harmelen
Neuro-symbolic (NeSy) AI is on the rise. However, simply machine learning on just any symbolic structure is not sufficient to really harvest the gains of NeSy. These will only be gained when the symbolic structures have an actual semantics. I give an operational definition of semantics as “predictable inference”.
All of this illustrated with link prediction over knowledge graphs, but the argument is general.
Neuro-symbolic is not enough, we need neuro-*semantic*
Cartography
1. Ca rto g ra p he rs
a ffe c t ho w we
p e rc e ive
o ur
wo rld
Teacher Lance
2. Representing the earth
A geographical map is a two-dimensional,
geometrically accurate representation of a three-
dimensional
space. Inevitably,
however,
distortion is
introduced when
a globe is made
to lay
flat.
This teacher uses a physical map
of Europe to explain his point.
Teacher Lance
4. • A map projection is
Map any method used in
Projection
___________________
(mapmaking) to
represent the curved
surface of the earth on
a flat surface.
• This cannot be done
without some
___________________
• The mapmaker must
select the one best
suited to the needs,
reducing distortion of
the most important
Teacher Lance features.
6. Mapmaker • Mapmakers and
mathematicians
s have devised almost
________________
ways to project the
image of the globe
onto paper.
• Every projection has
its own set of
advantages and
disadvantages.
There
is no
Teacher Lance
“______________"
7. • Flat maps can be more
Good Uses useful than globes in
many situations:
of Flat Maps
• Maps are more
compact and easier to
store.
• They are viewed easily
on computer displays.
• Maps can show larger
portions of the earth's
surface at once.
• These useful traits of
Teacher Lance
flat maps motivate the
development of map
8. The Problem • Every flat map
misrepresents the
with Flat surface of the Earth in
Maps some way.
• No map can rival a
_______________in
truly representing the
surface of the entire
Earth
• Since the world is a
sphere, and a globe is
a sphere, a perfect
representation can be
made.
Teacher Lance
10. Types of map projections
Each introduces some error inherent when three-
dimensional sphere is flattened into two dimensions.
• Mercator
• Mollweide
• Robinson
• Peters
• Polar
Teacher Lance
11. Which projection?
The earth is
round. The
challenge of
any world map
is to represent
a round earth
on a flat
surface.
Teacher Lance
12. Globes and Map Projections
• Projection: a way of showing the earth
on a flat surface.
Teacher Lance
14. Cylindrical Projection: is based on a cylinder
tangent to the equator. Good for equatorial
regions but greatly distorted at high latitudes.
Teacher Lance
15. Mercator projection
Though the Mercator projection is particularly
good for navigation, it becomes increasingly distorted
toward the poles, resulting in areas appearing much
larger than they actually are.
Teacher Lance
16. • This map makes areas
Mercator
Projection near the ____________
look bigger than they
really are.
• Example, Greenland
looks bigger than it
really is. Here, it is
larger than S.
America, but in real
life, it is less than half
the size.
• This is because, on a
globe, the lines of
longitude meet at the
poles, but on this type,
Teacher Lance
21. • The Peters
Peter’s Projection was
created in
Projection ______________ by
Dr. Arno Peters to
address some of
the distortions of
existing maps
• Problem: One
square inch
anywhere on this
map represents an
equal number of
square miles.
Distorts the shape
in some cases.
• Example: Africa
Teacher Lance
22. The Robinson projection is based on tables
of coordinates. The projection distorts shape,
area, scale, and distance in an attempt to
balance the errors of projection properties.
The Robinson projection
Teacher Lance
23. Robinson • Presented by Dr.
Projection Arthur H. Robinson in
__________________.
• Today, many
geographers believe
this to be the best
world map available. It
has been called so by
National Geographic
• While the Robinson
projection does distort
the globe a little,
(Check out
Antarctica), it shows
the sizes and shapes
Teacher Lance
of most countries
25. • By creating
Interrupted
Projection _____________ in the
picture of the world,
mapmakers showed
the size and shape of
most of the land quite
accurately.
• Problems:
• The gaps make it
impossible to figure
distances correctly
• You could not use
this kind of map to
Teacher Lance
chart a journey
across the ocean.
43. Prime Meridian:
• 0° longitude line that runs from the
north pole to the south pole
Teacher Lance
44. Different types of Maps
• Political Map: shows location of
countries, states, and provinces and
boundary lines separation
governments
• Physical Map: shows physical features
of an area
• Mountains, plains, valleys, etc
• Economic map: can see that locations
of natural resources, industrial areas,
farmlands, and fishing areas
• Travel or transportation map: also
known as a road map
Teacher Lance
45. Landsat
A series of satellites that
can photograph the
entire earth in 16 days.
Teacher Lance
46. Global Positioning Systems (GPS)
This system uses a series of 24 satellites called
the Navstars to beam information to earth about
an object and its location of the earth’s surface.
Teacher Lance
47. Atlas technology
“Like a huge piece
of orange peel that
refuses to be
flattened without
tearing at the
edges, the globe
cannot be forced
into two
dimensions
without distortion.
But that distortion
can now be
minimised “
Teacher Lance
There are literally thousands of map projections. Each has certain strengths and corresponding weaknesses. Choosing among them is an exercise in values clarification: you have to decide what's important to you.
This one of the oldest and most common projections
The Mollweide Equal Area projection preserves the relative area of landforms.
but it looks like someone hung their laundry out to dry
A great circle path is the shortest path on the surface of a sphere between two points on that sphere.