Downloaded 179 times
![Ingredients
Statistics Programming
n Summary statistics for n vector and data frame
continuous data
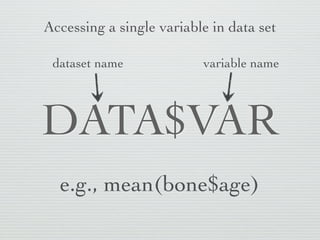
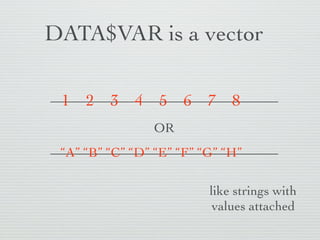
n DATA$VAR extraction
n Normal data
n Indexing by [row,col]
n Non-normal data
n Various functions
n Normality check
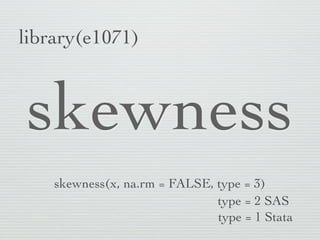
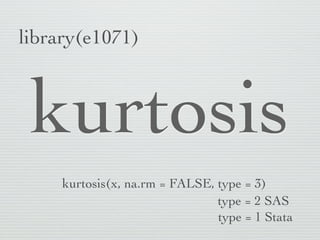
n skewness(), kurtosis()
n summary()
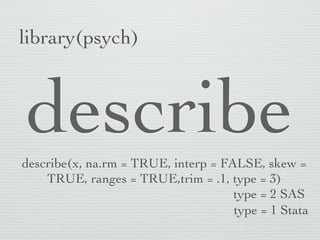
n describe(), describeBy()](https://image.slidesharecdn.com/20121005descriptive-120927231412-phpapp01/85/Descriptive-Statistics-with-R-5-320.jpg)


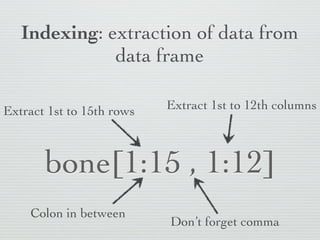
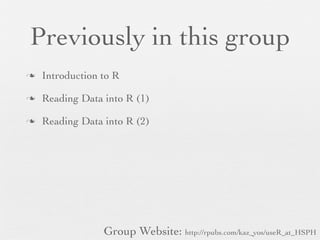
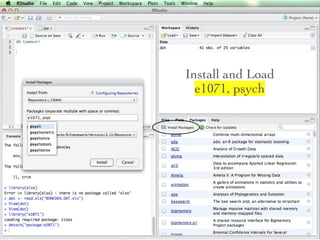
![Indexing: extraction of data from
data frame
Extract 1st to 15th rows Extract 1st to 12th columns
bone[1:15 , 1:12]
Colon in between
Don’t forget comma](https://image.slidesharecdn.com/20121005descriptive-120927231412-phpapp01/85/Descriptive-Statistics-with-R-17-320.jpg)
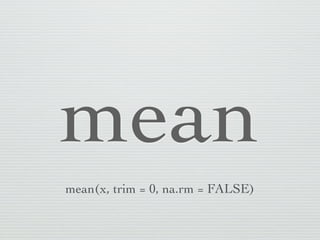


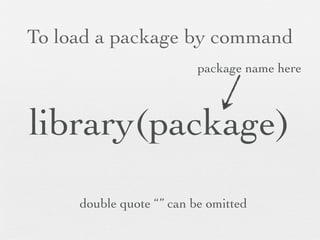


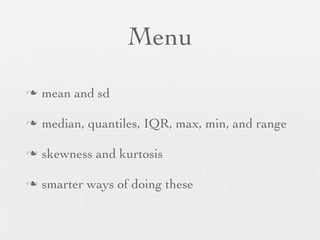
![Your turn adopted from Hadley Wickham
n describe(bone[,-1], type = 2)](https://image.slidesharecdn.com/20121005descriptive-120927231412-phpapp01/85/Descriptive-Statistics-with-R-47-320.jpg)

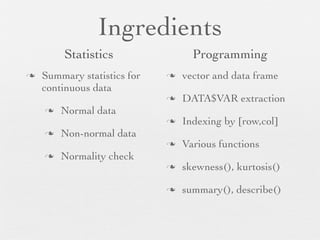
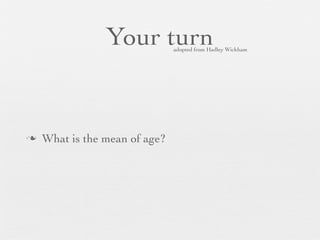
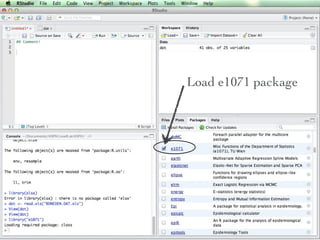
![Your turn adopted from Hadley Wickham
bone data frame
without 1st columns zyg vector for grouping
n describeBy(bone[ , c(-1)] , bone$zyg , type = 2)
SAS method for
skewness and kurtosis](https://image.slidesharecdn.com/20121005descriptive-120927231412-phpapp01/85/Descriptive-Statistics-with-R-49-320.jpg)
![Ingredients
Statistics Programming
n Summary statistics for n vector and data frame
continuous data
n DATA$VAR extraction
n Normal data
n Indexing by [row,col]
n Non-normal data
n Various functions
n Normality check
n skewness(), kurtosis()
n summary()
n describe(), describeBy()](https://image.slidesharecdn.com/20121005descriptive-120927231412-phpapp01/85/Descriptive-Statistics-with-R-50-320.jpg)


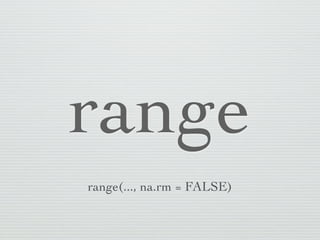
The document discusses descriptive statistics and how to calculate them in R. It introduces common summary statistics like the mean, median, percentiles, range, and measures of normality like skewness and kurtosis. It demonstrates how to use functions like mean(), sd(), quantile(), range(), skewness(), kurtosis(), summary(), describe(), and describeBy() to calculate these statistics on data frames and vectors in R. Examples are provided to showcase calculating these statistics on variables from a bone data set.