Downloaded 640 times


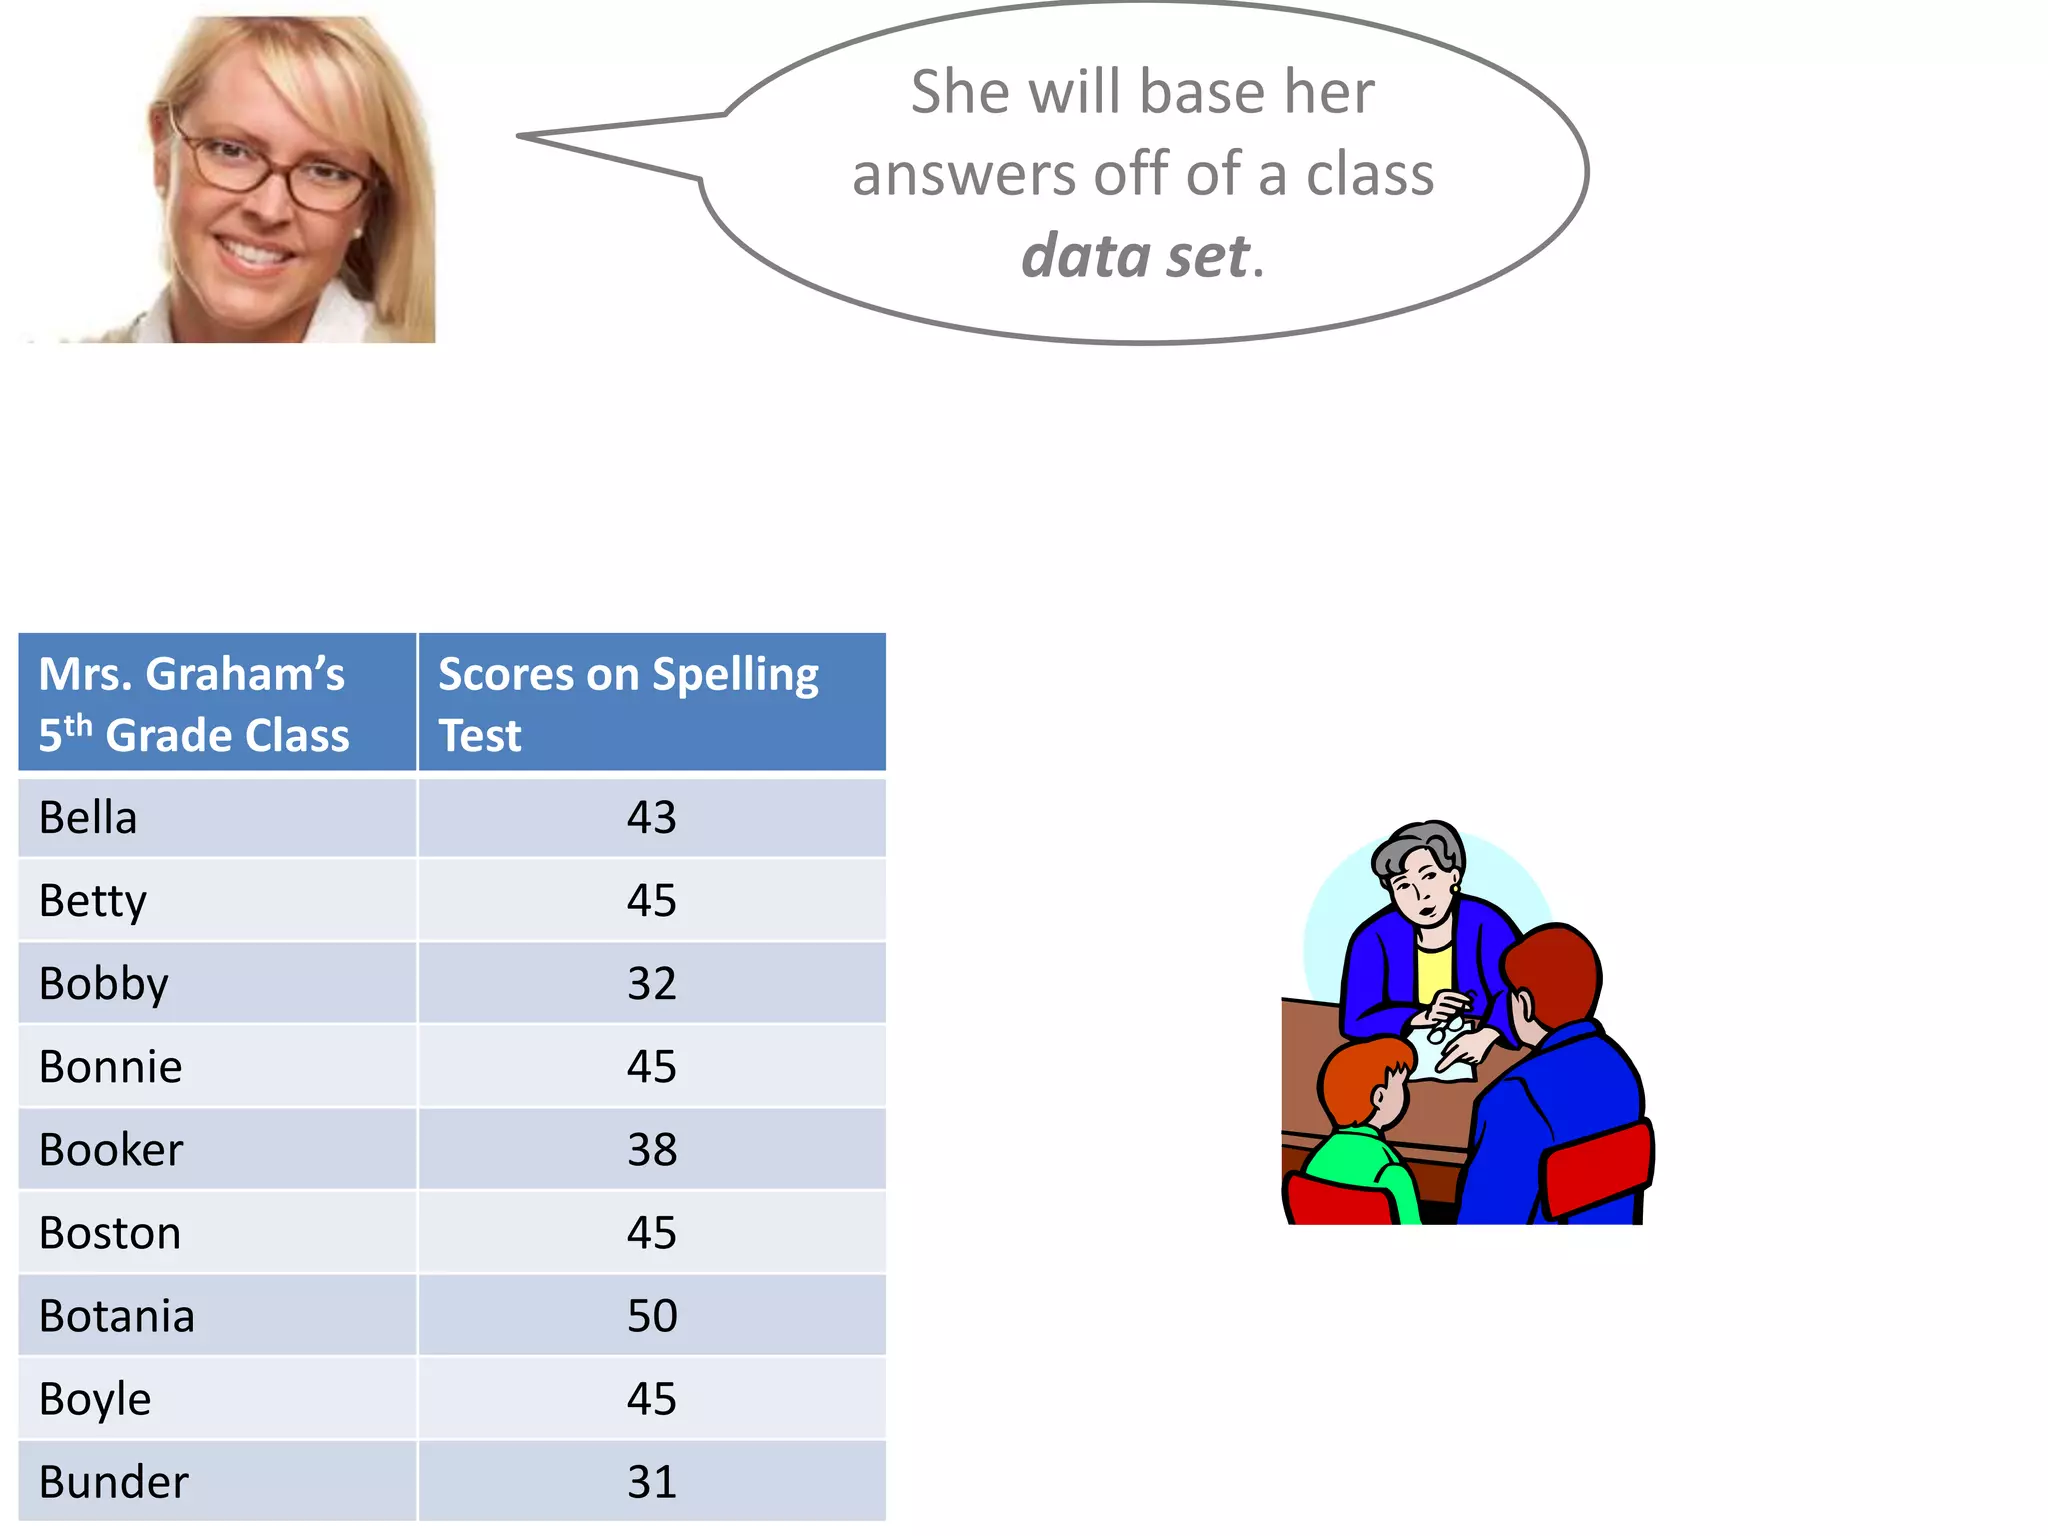
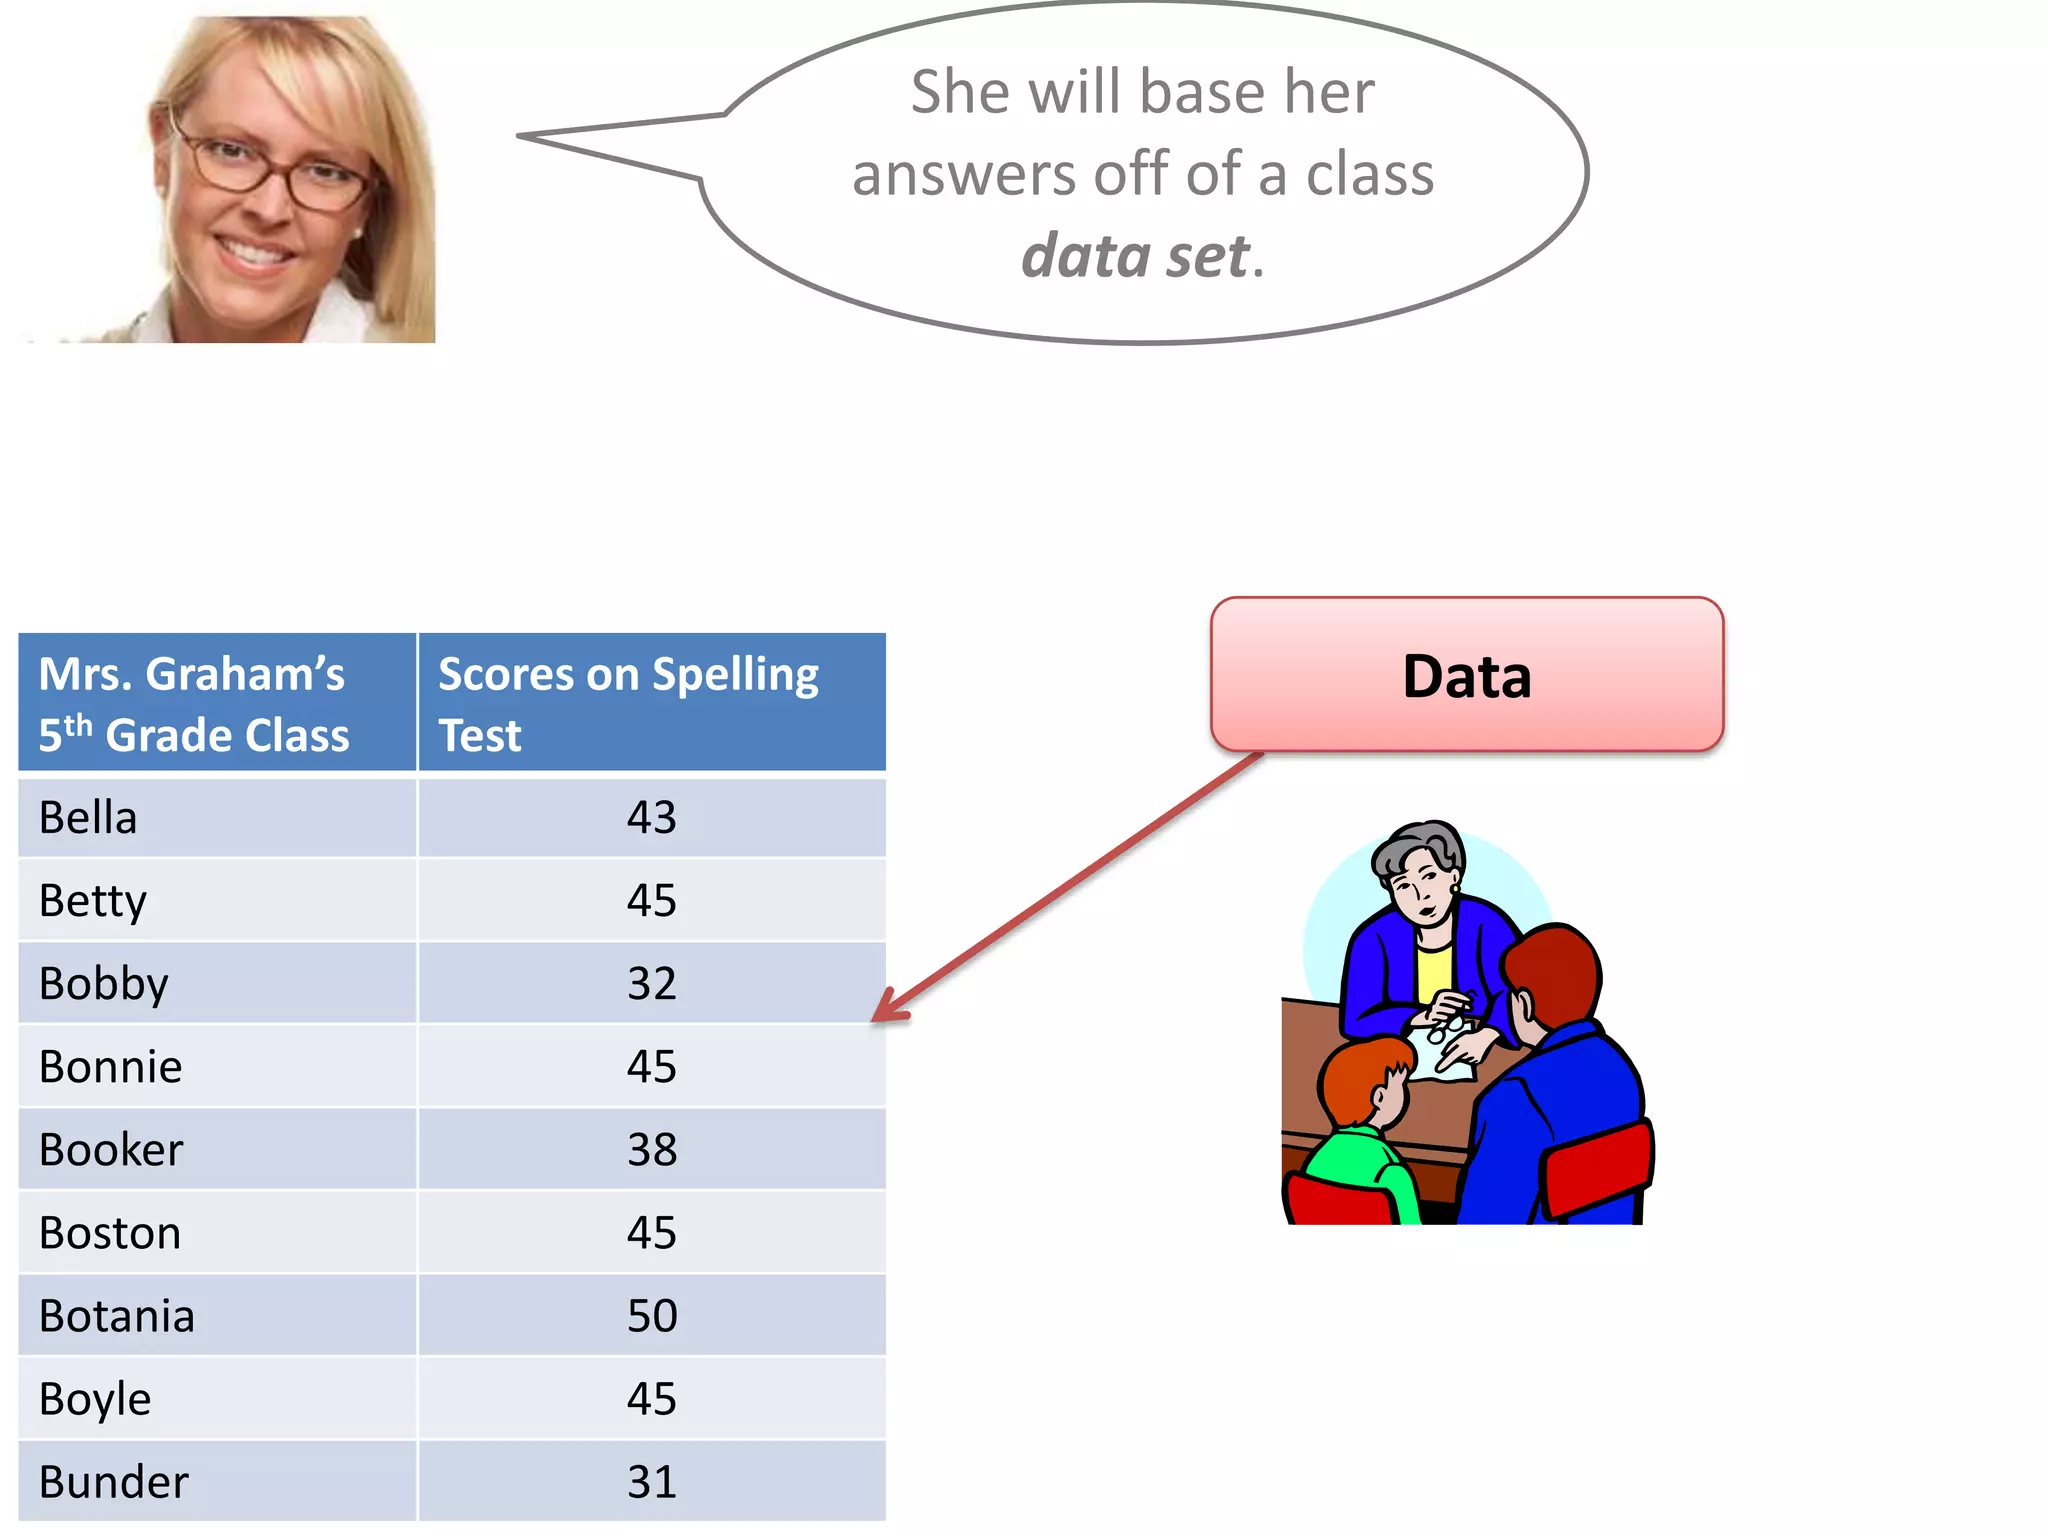
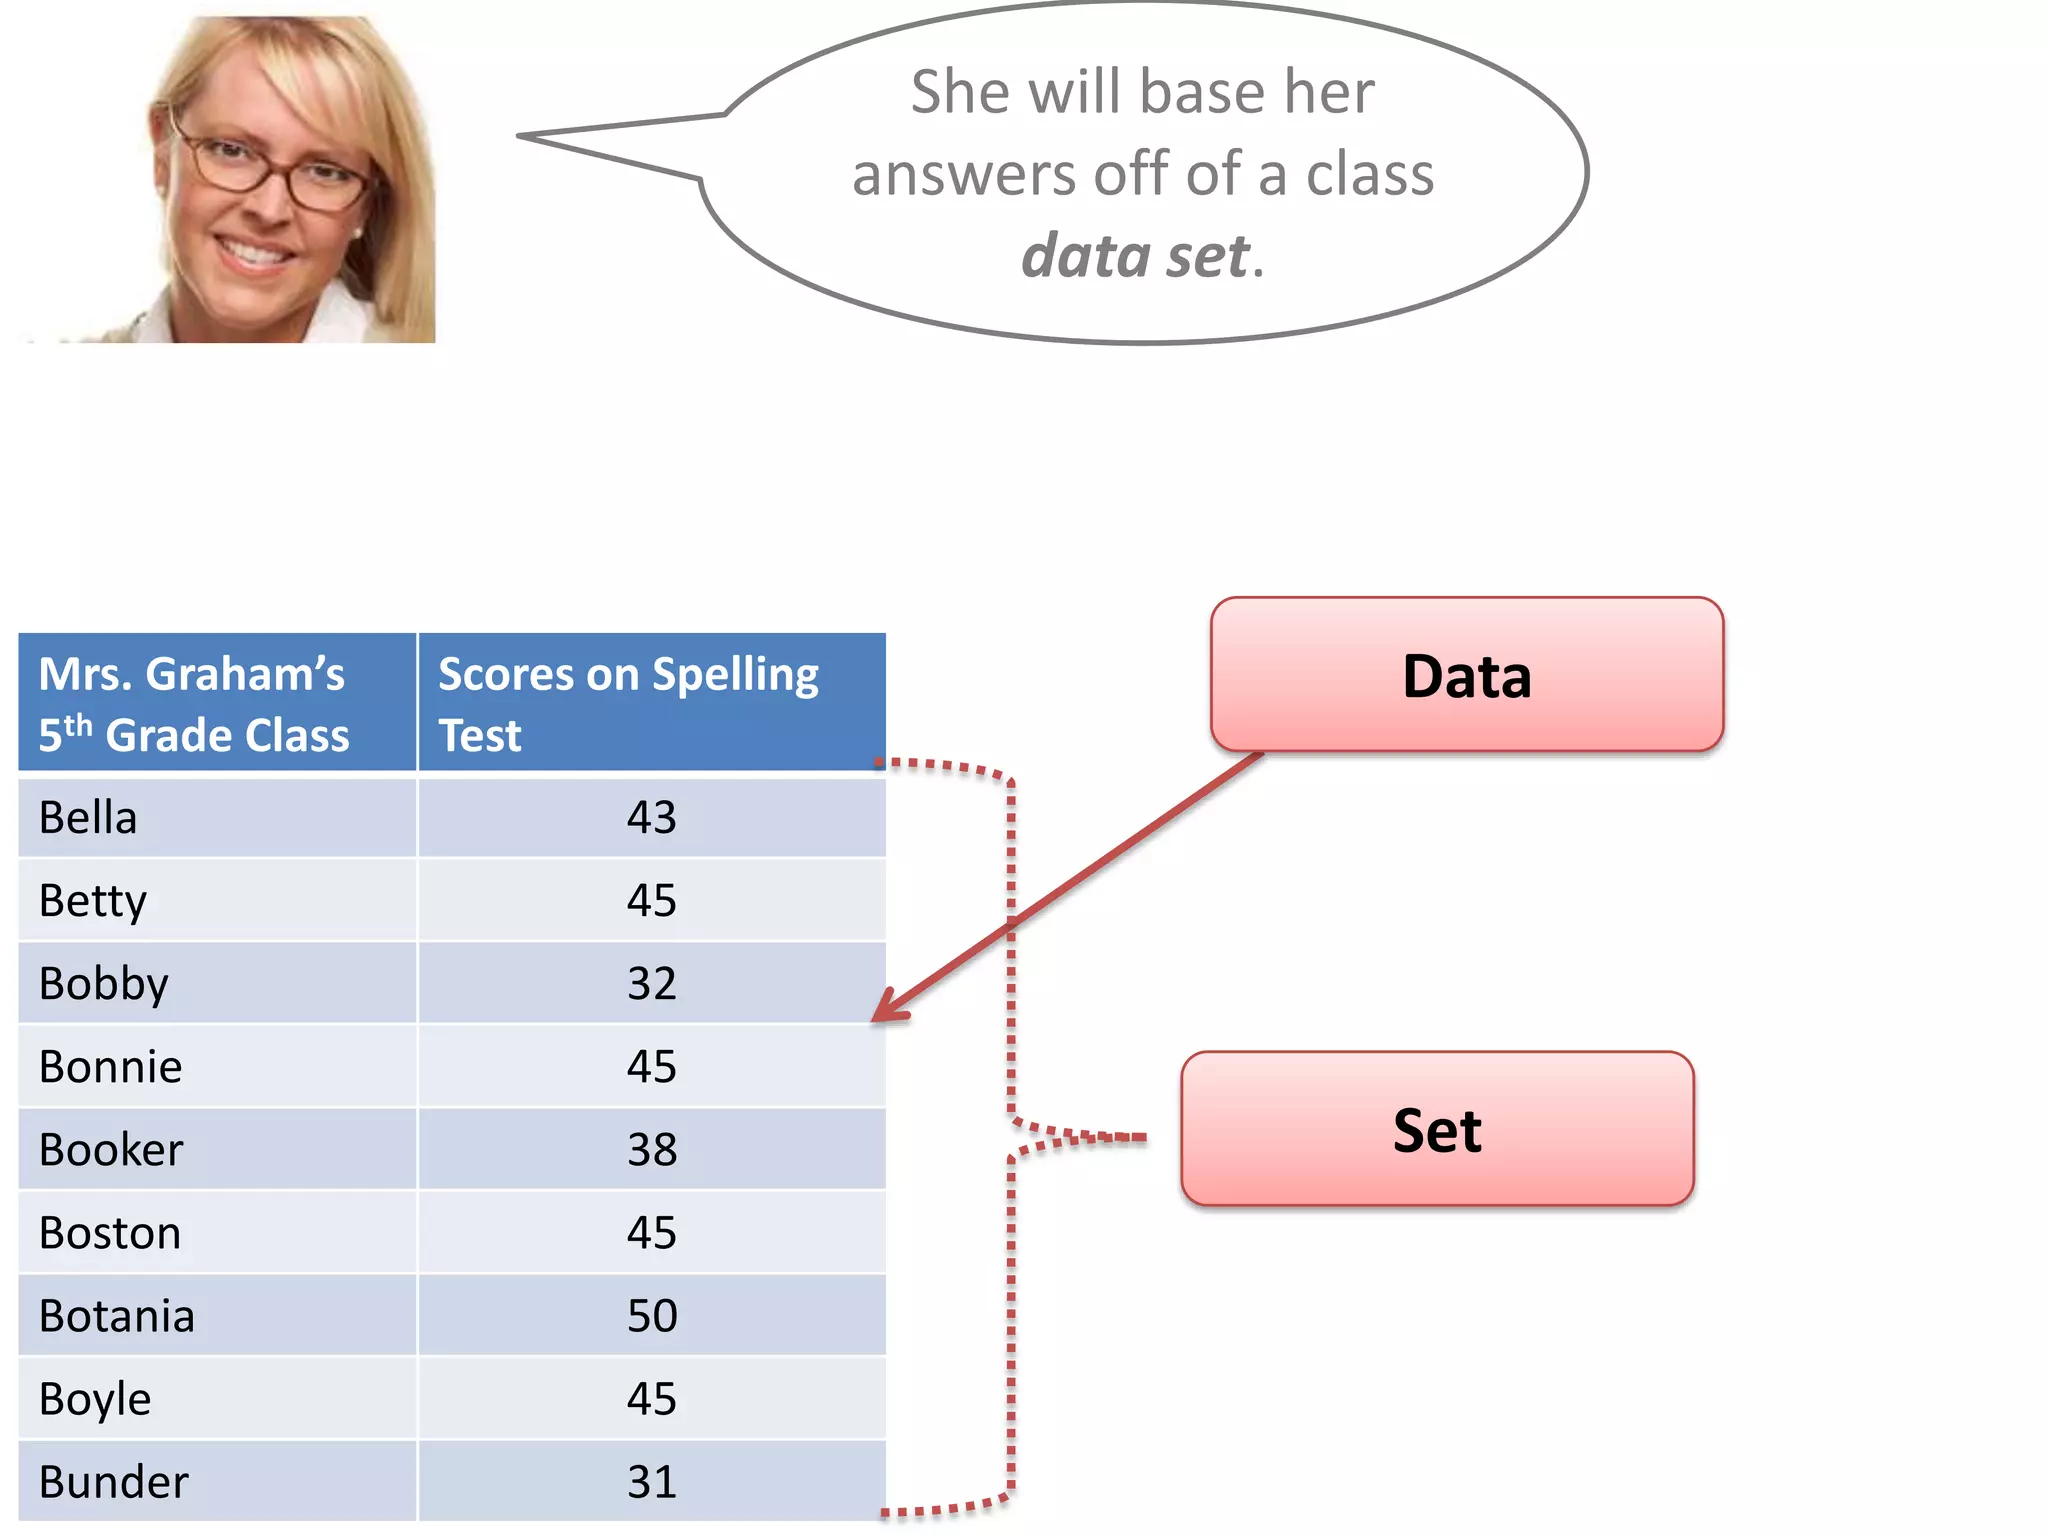
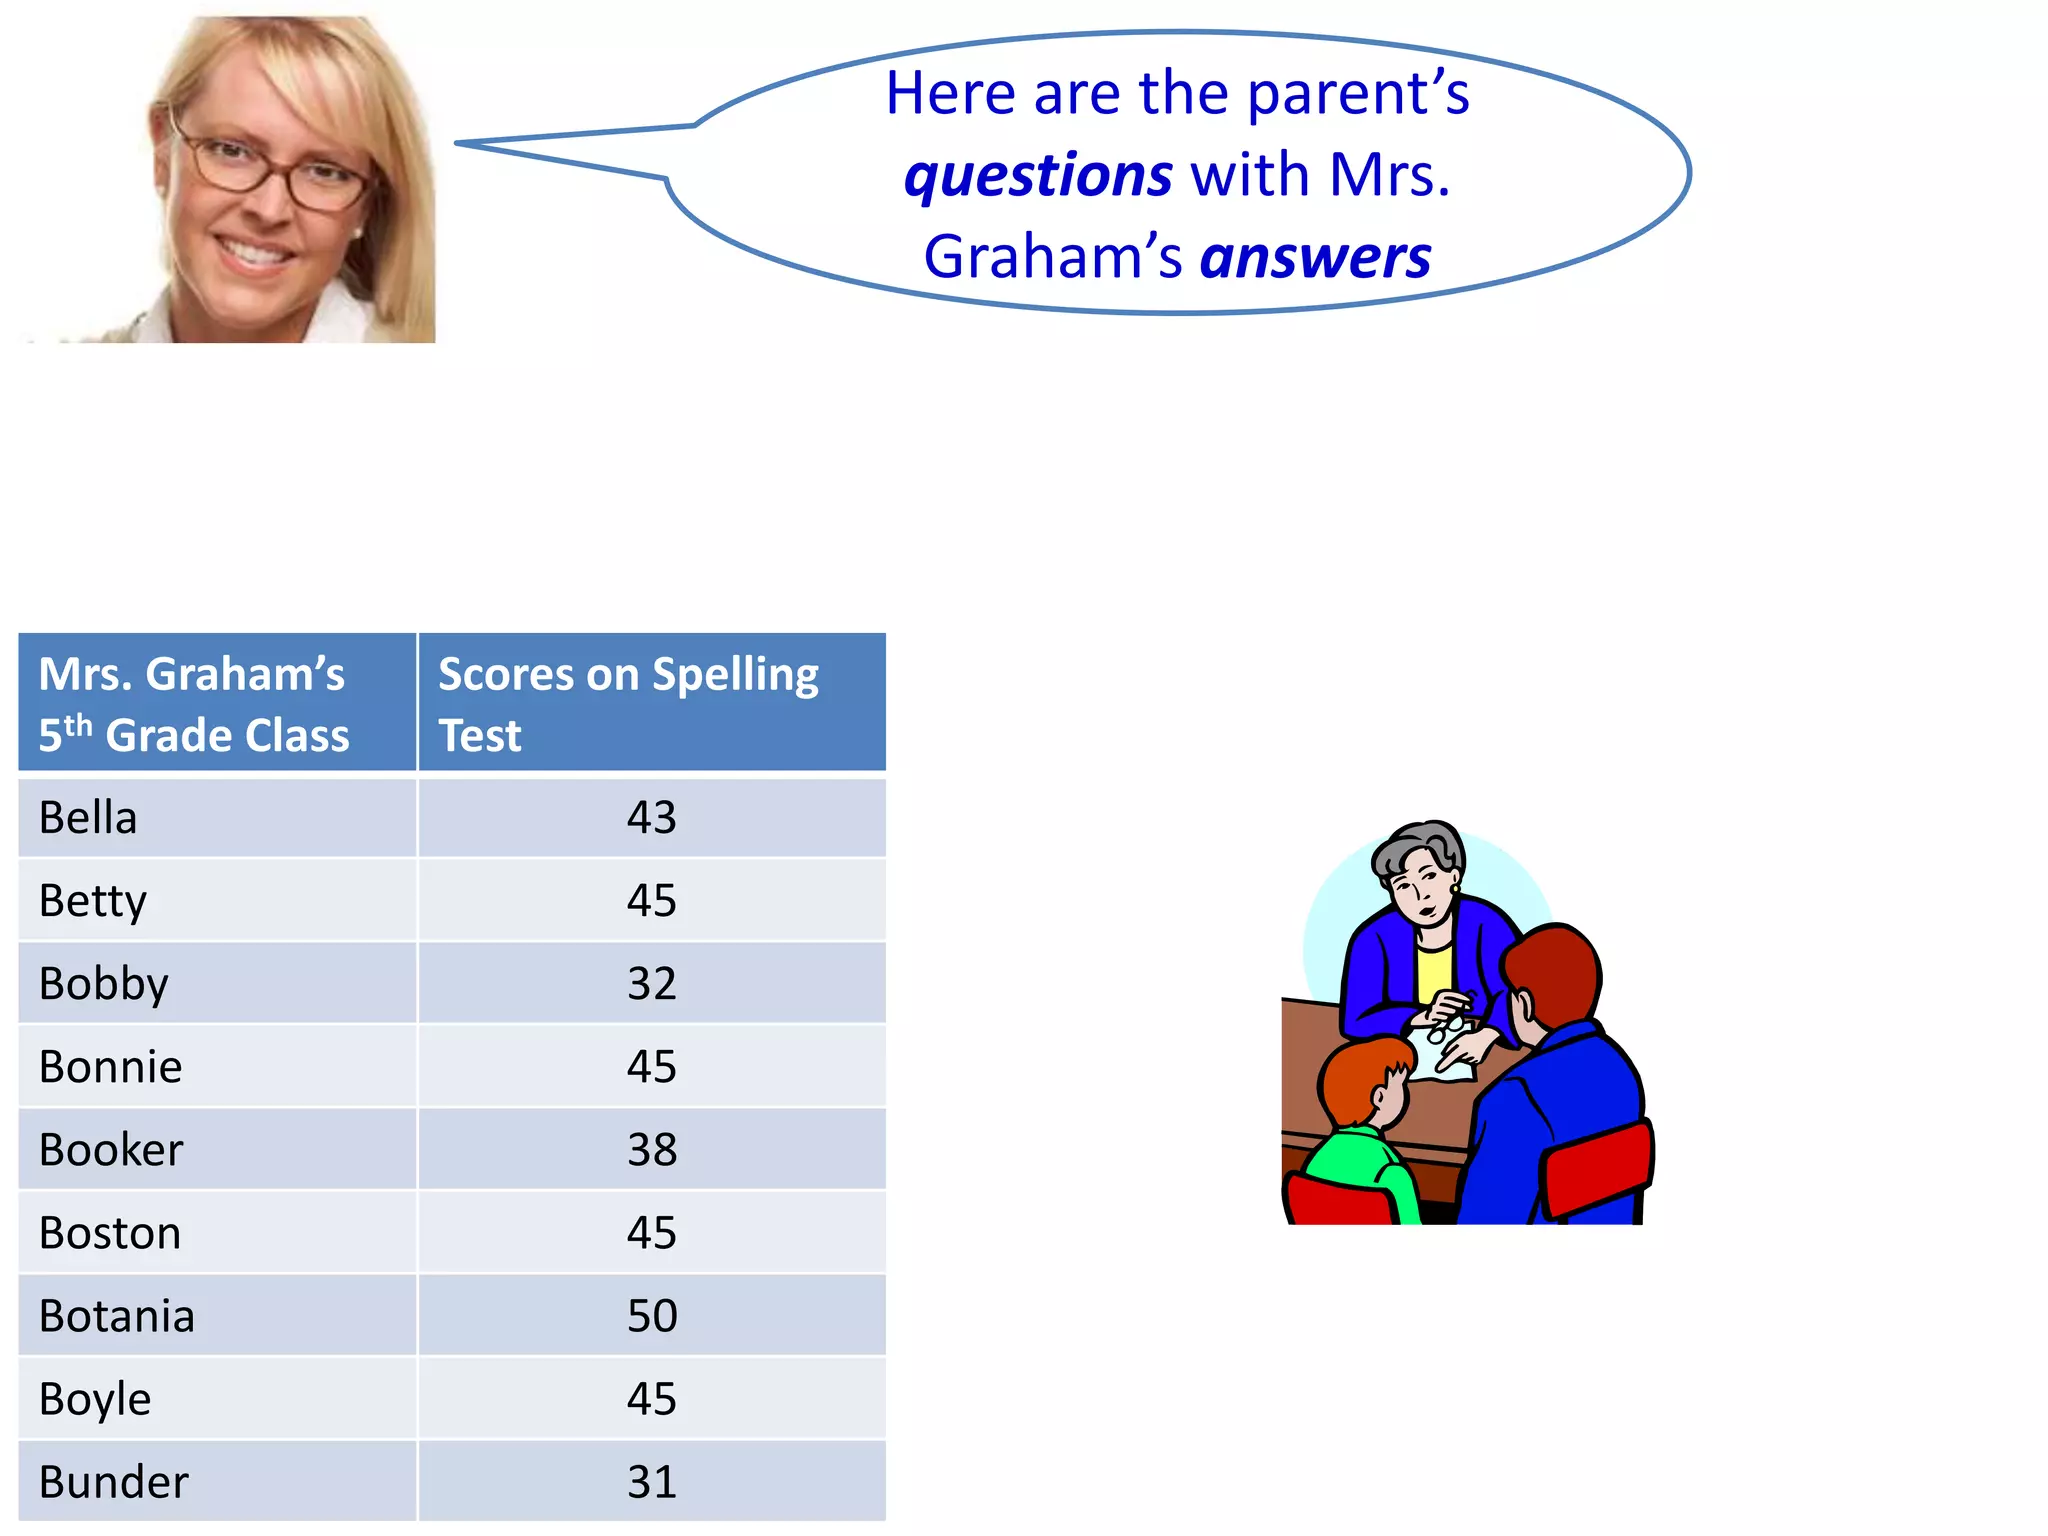
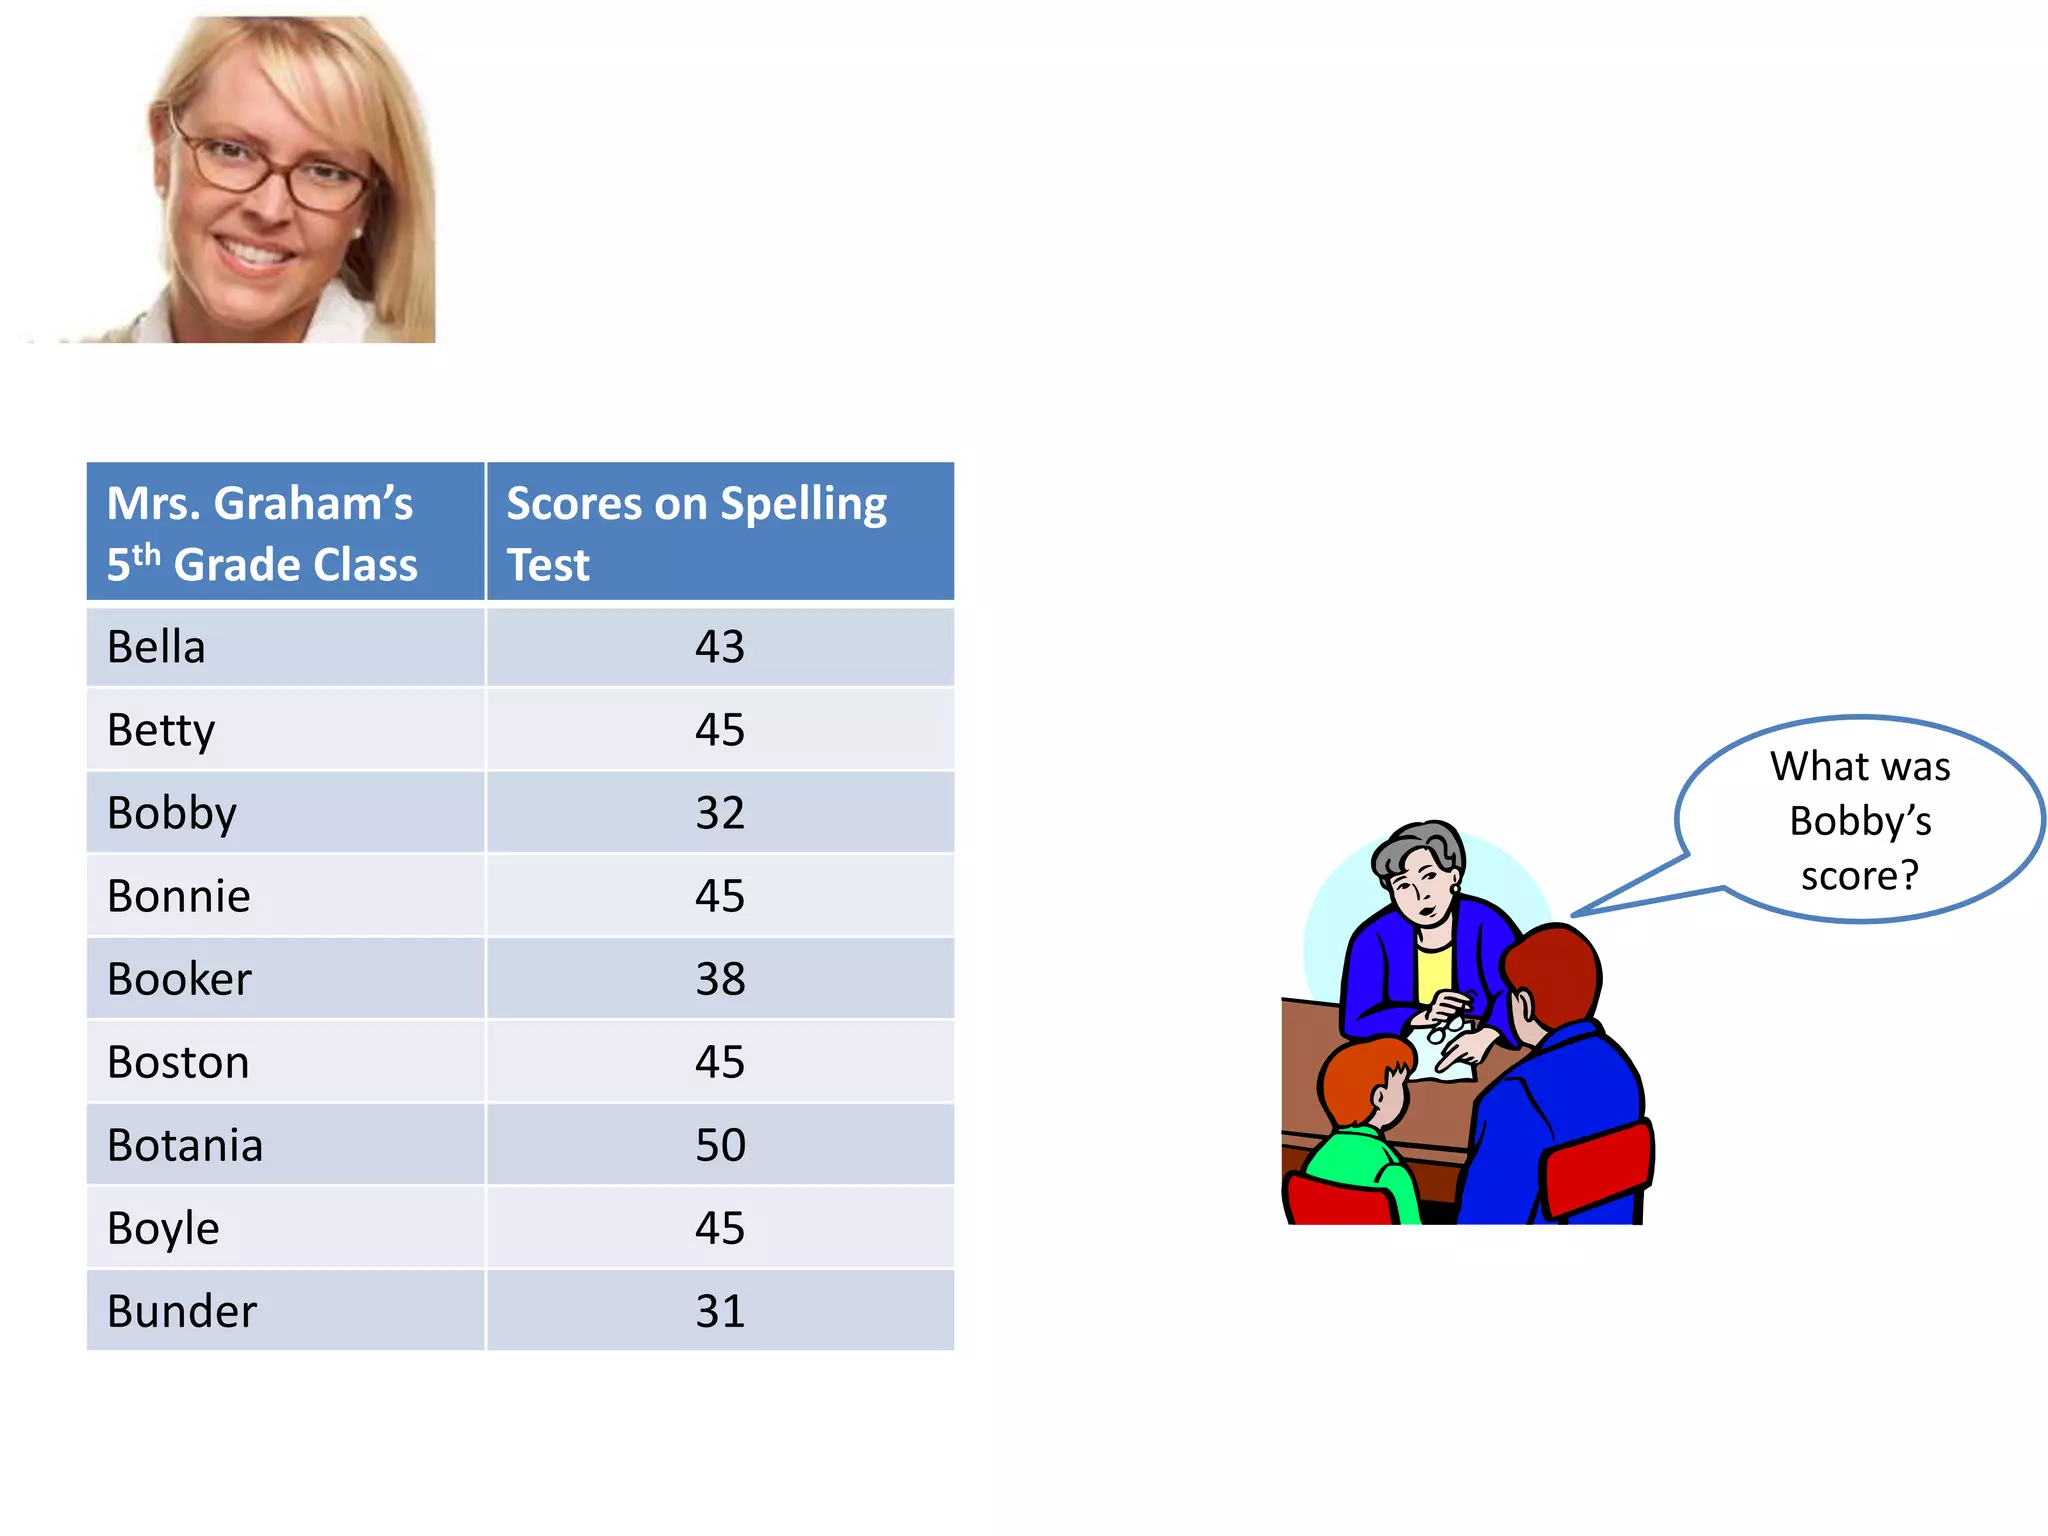
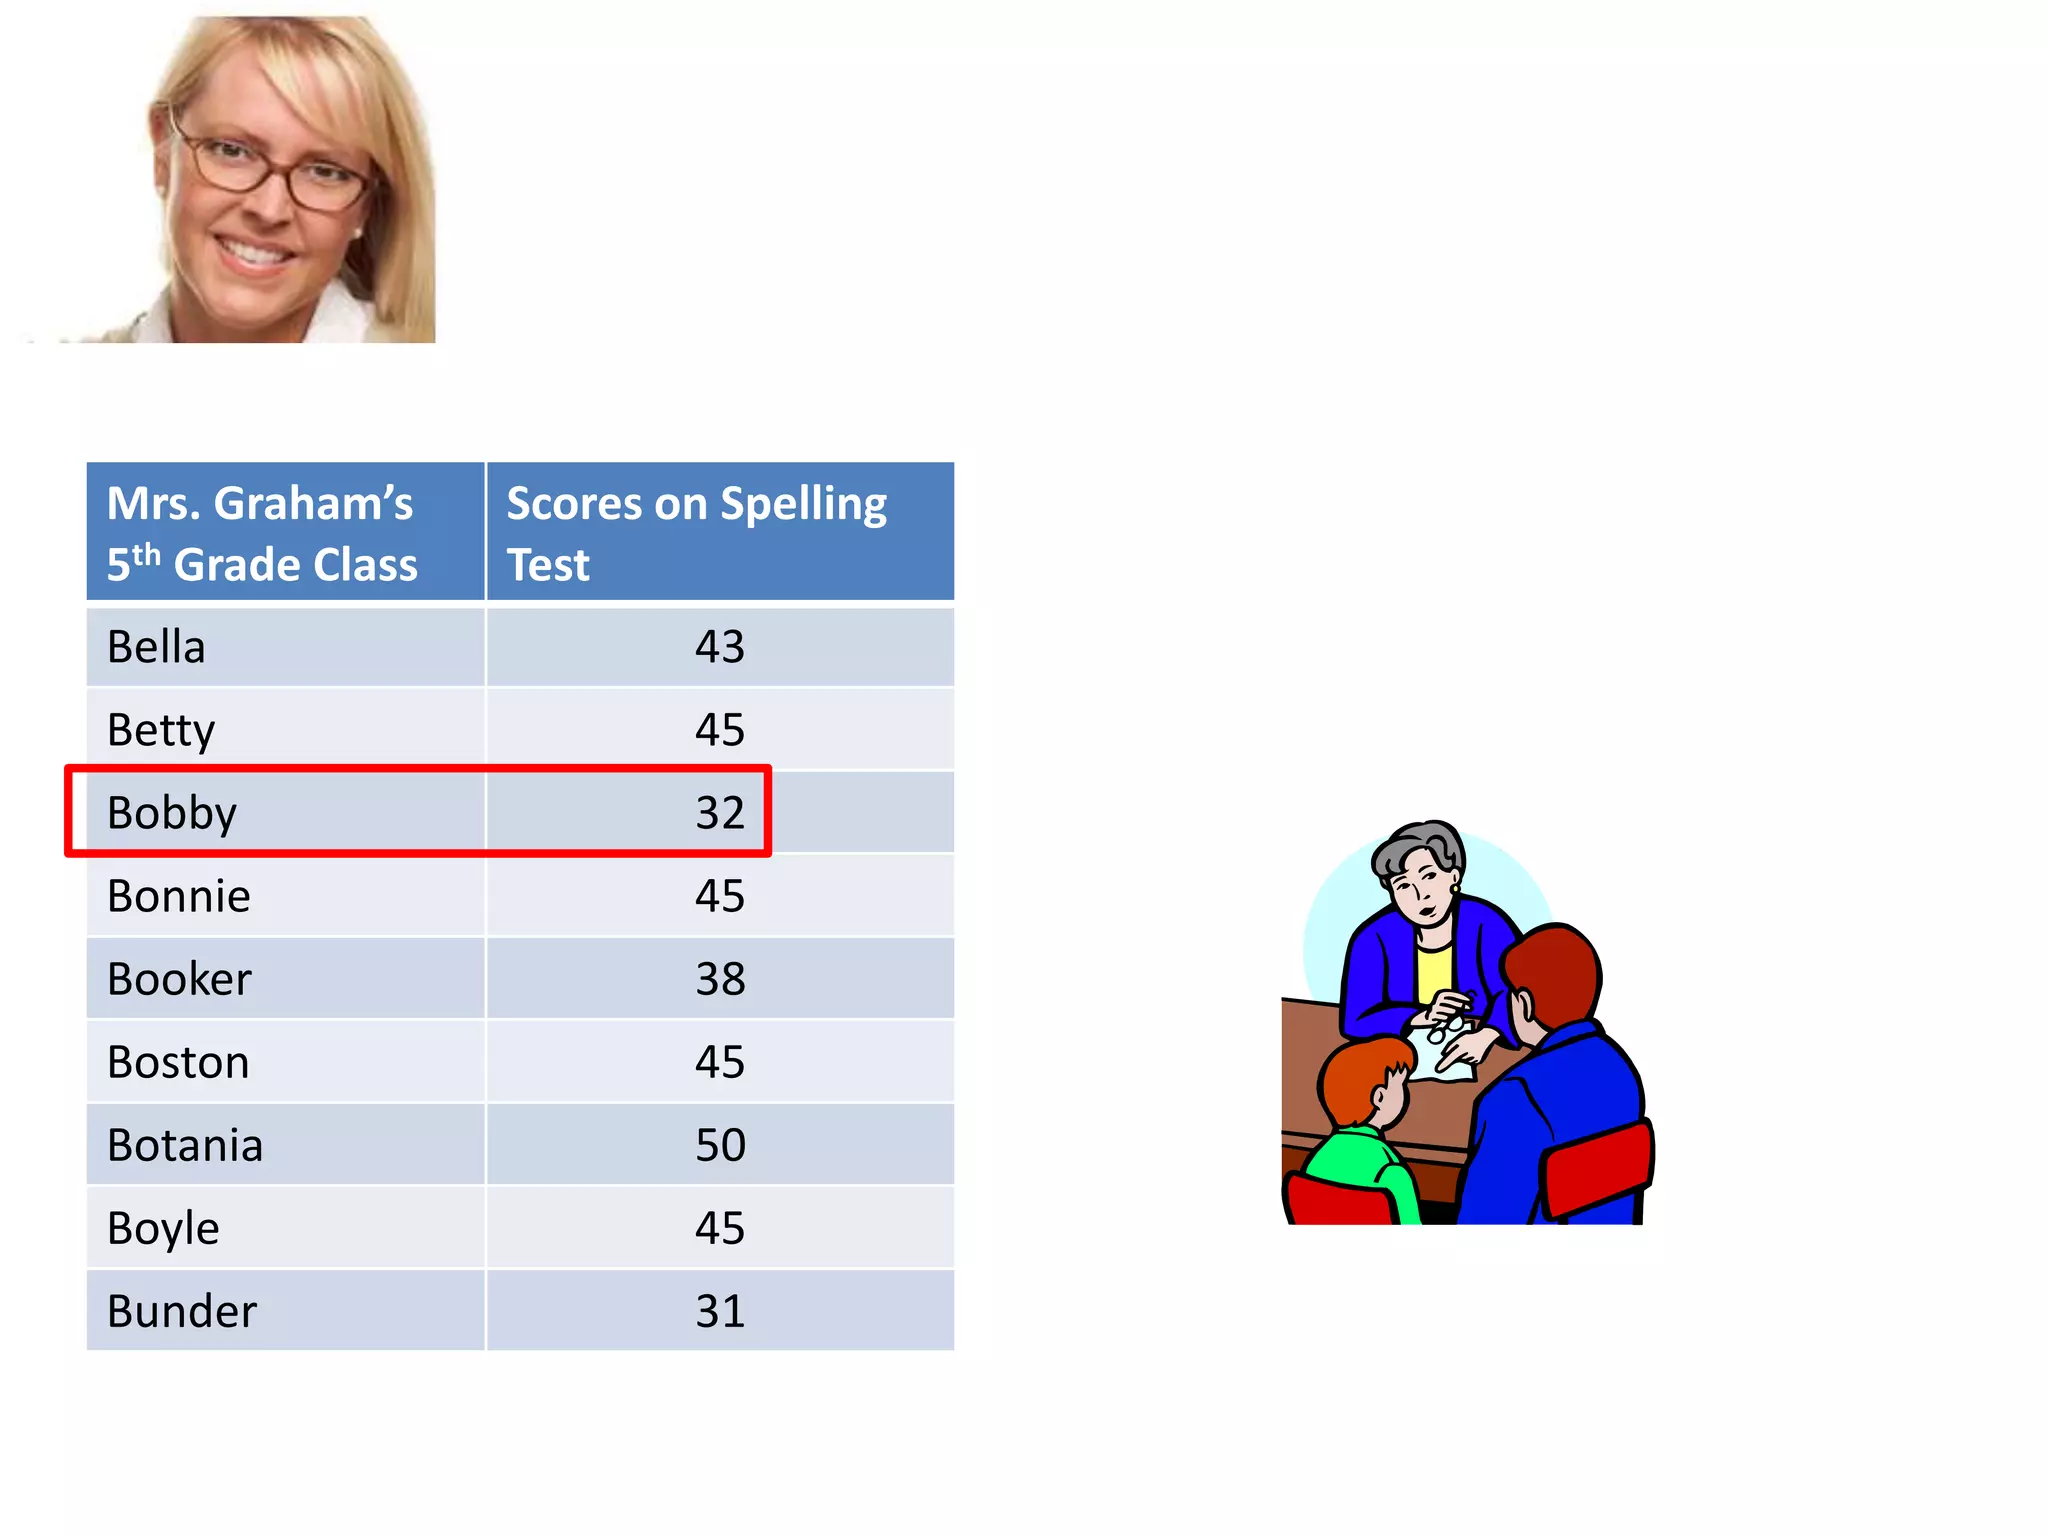


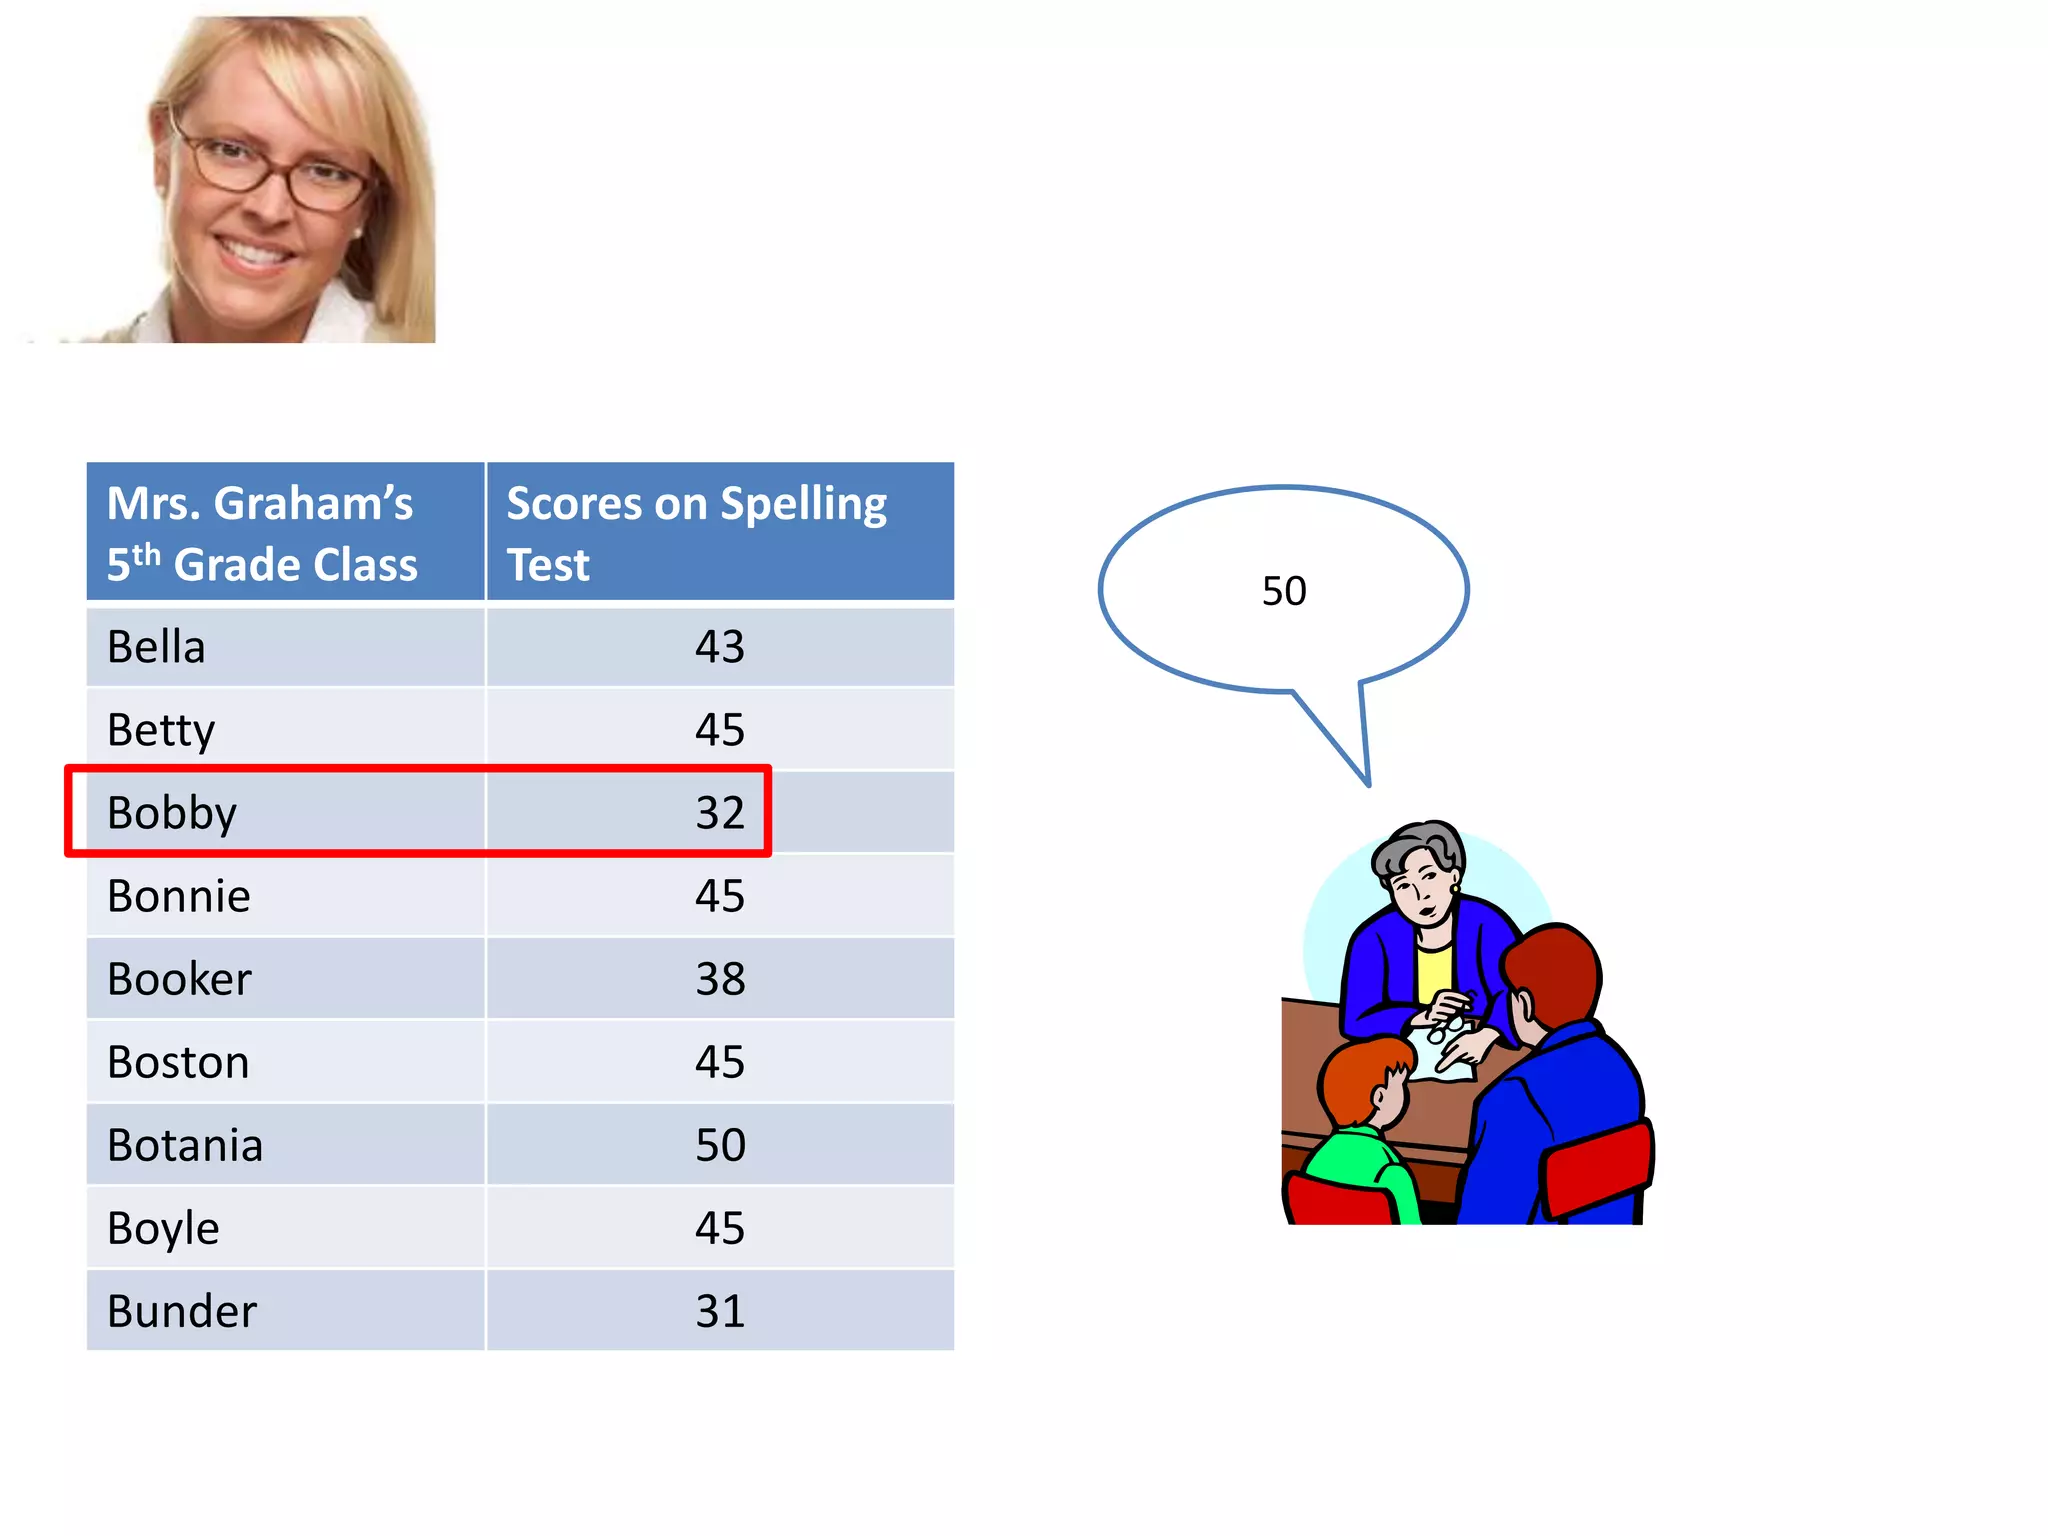

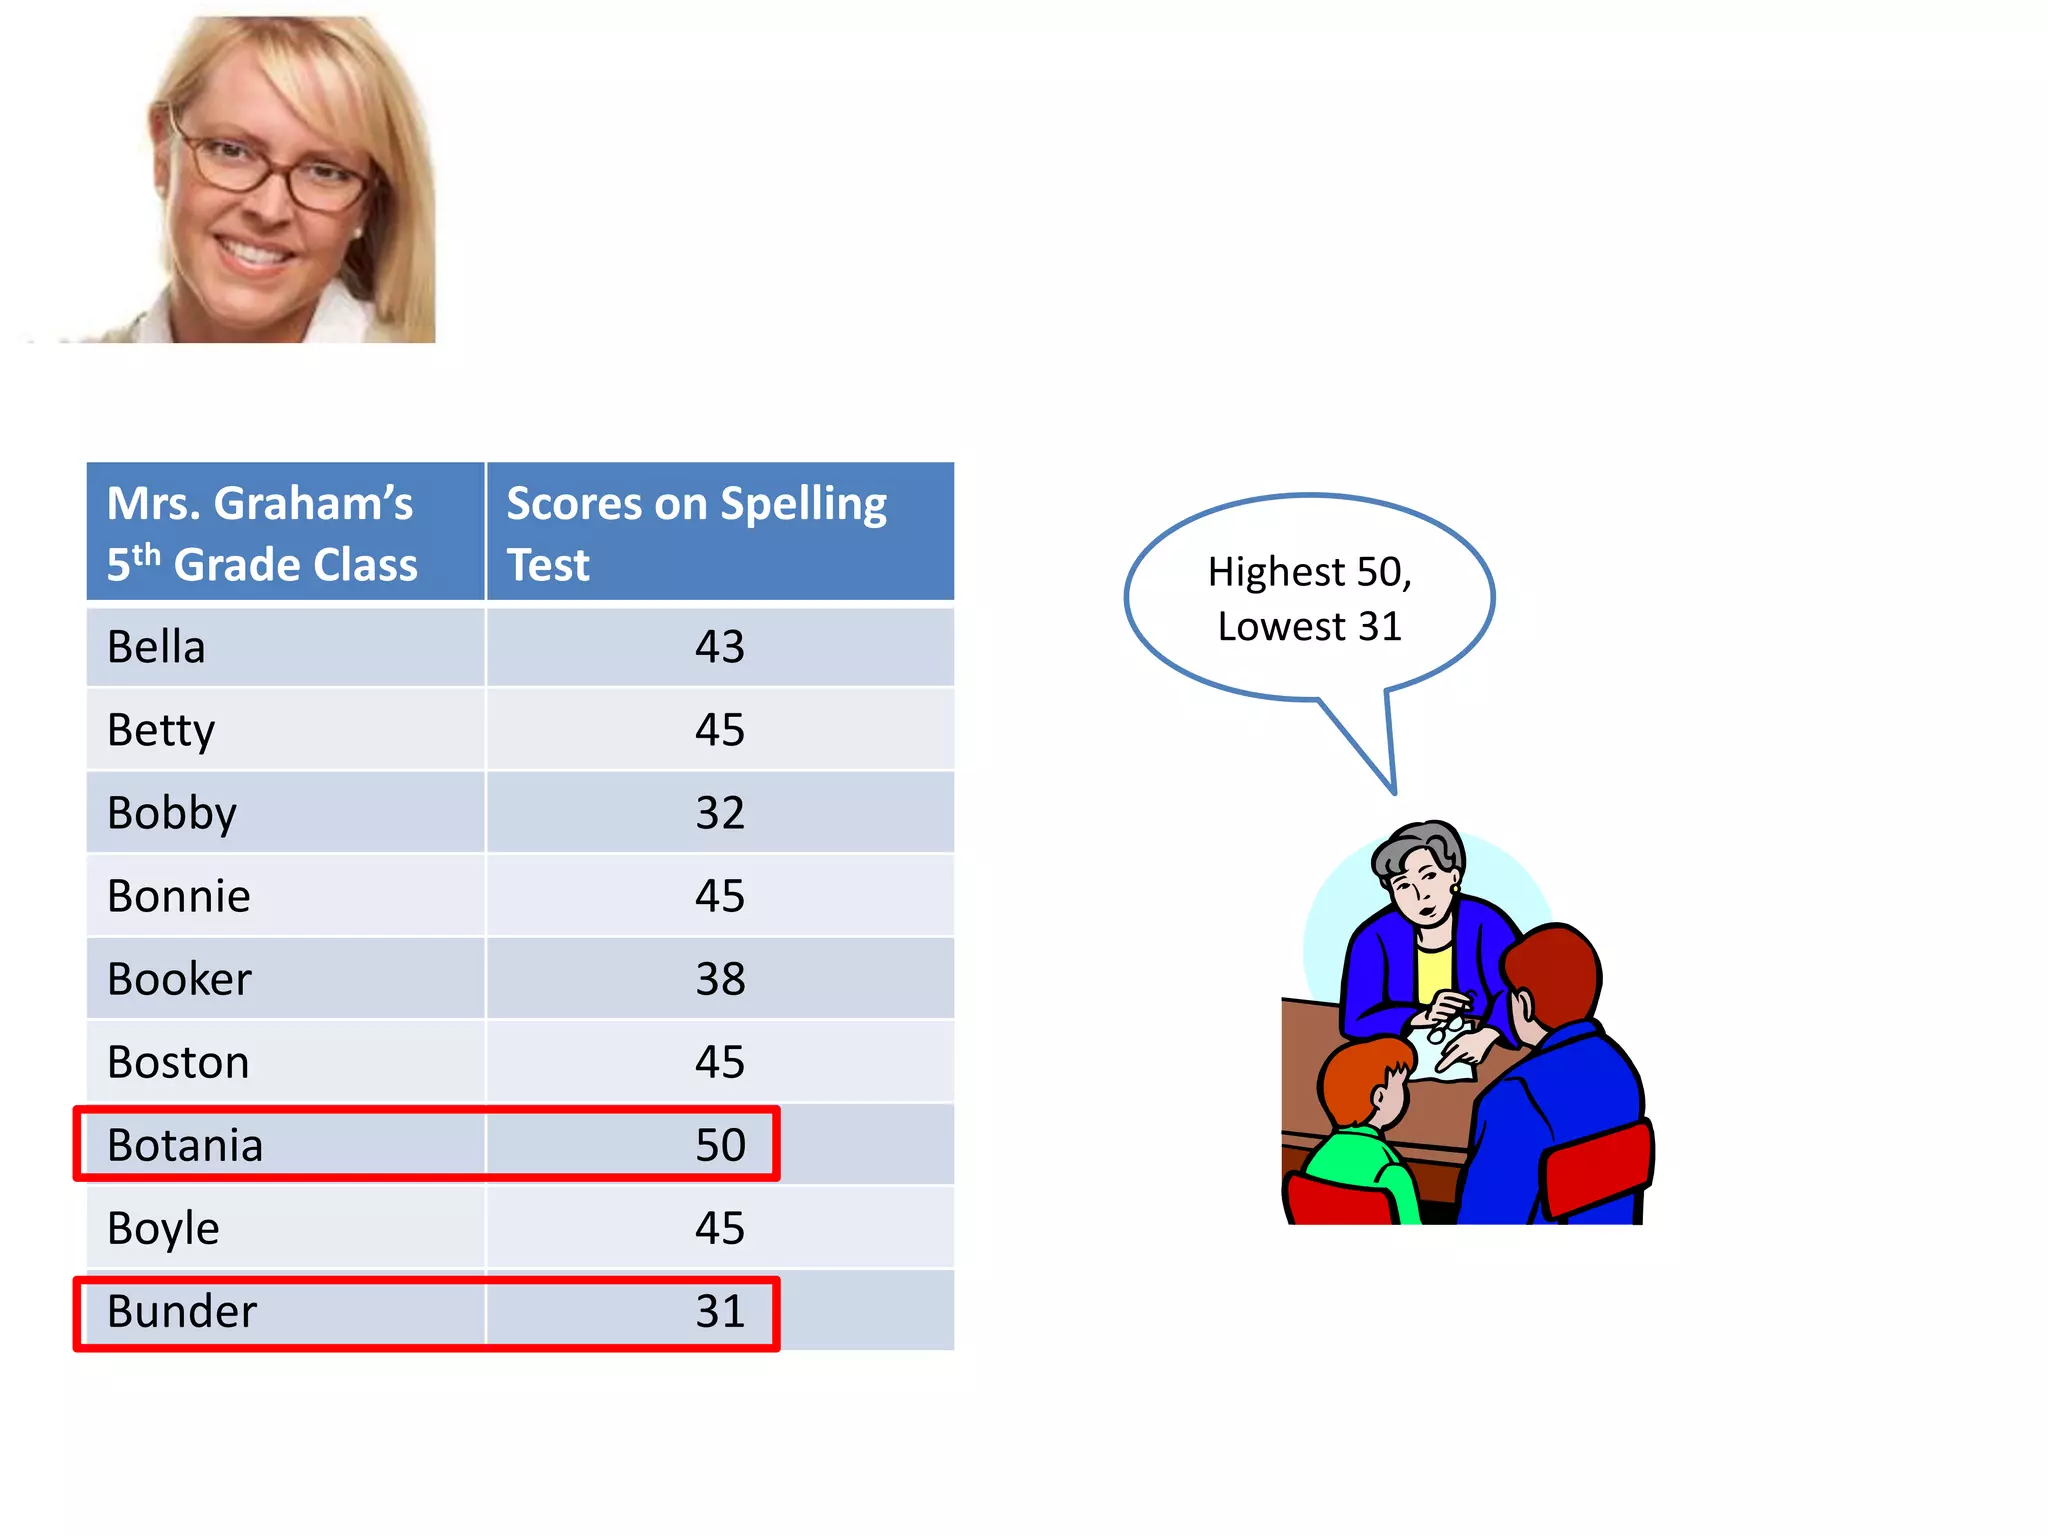

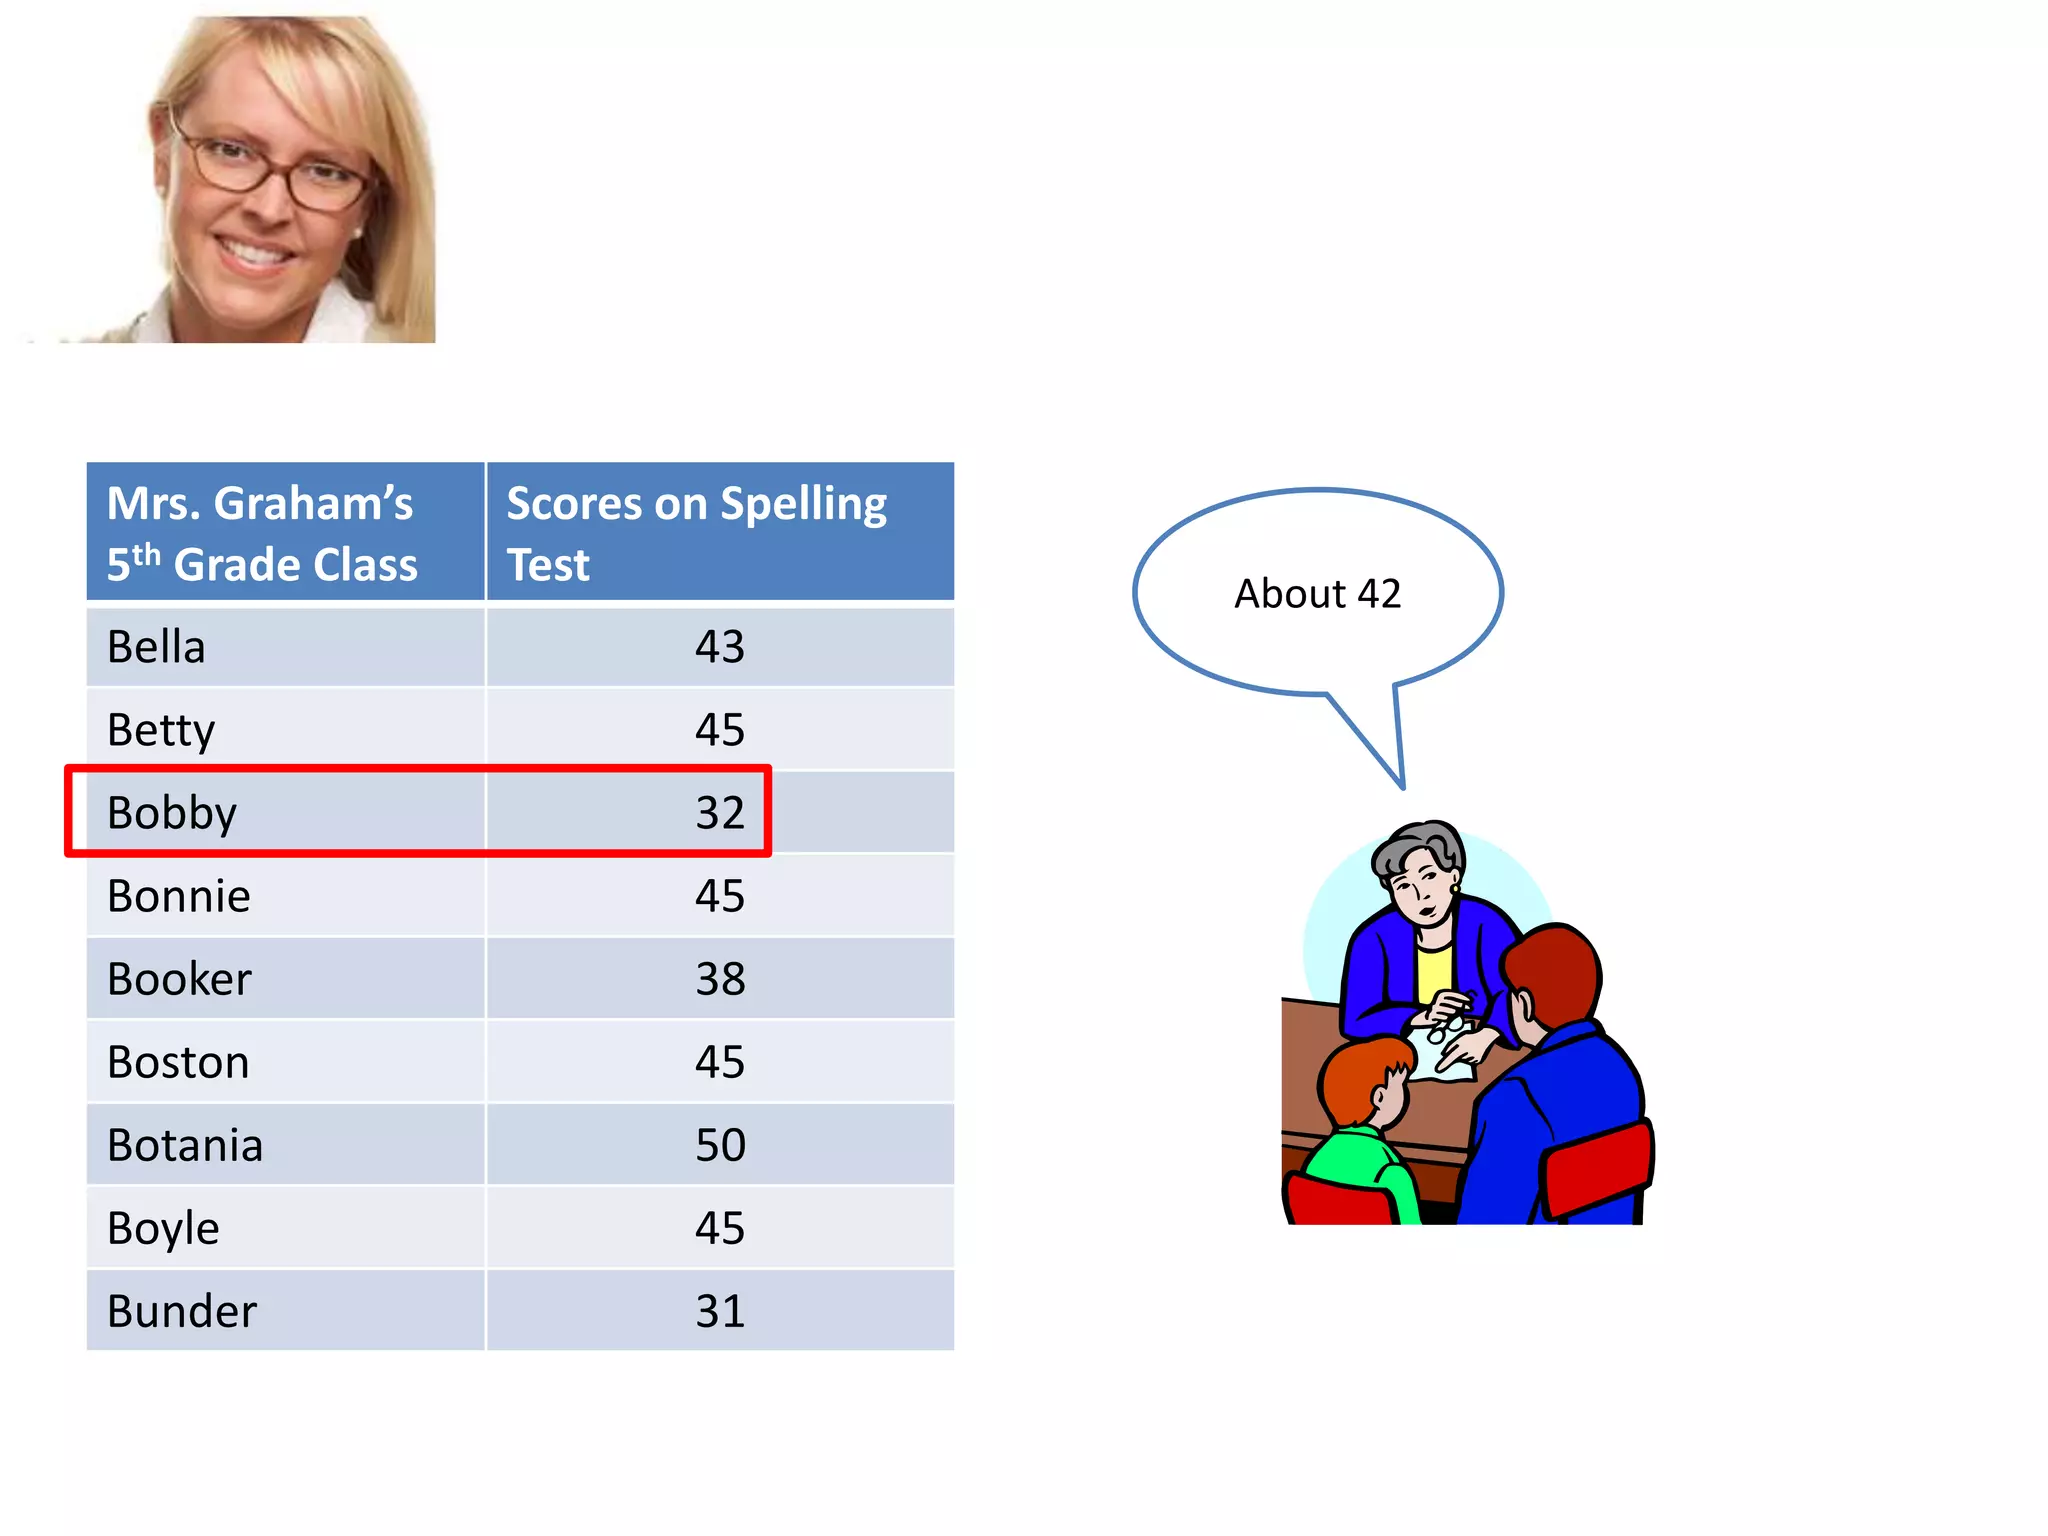

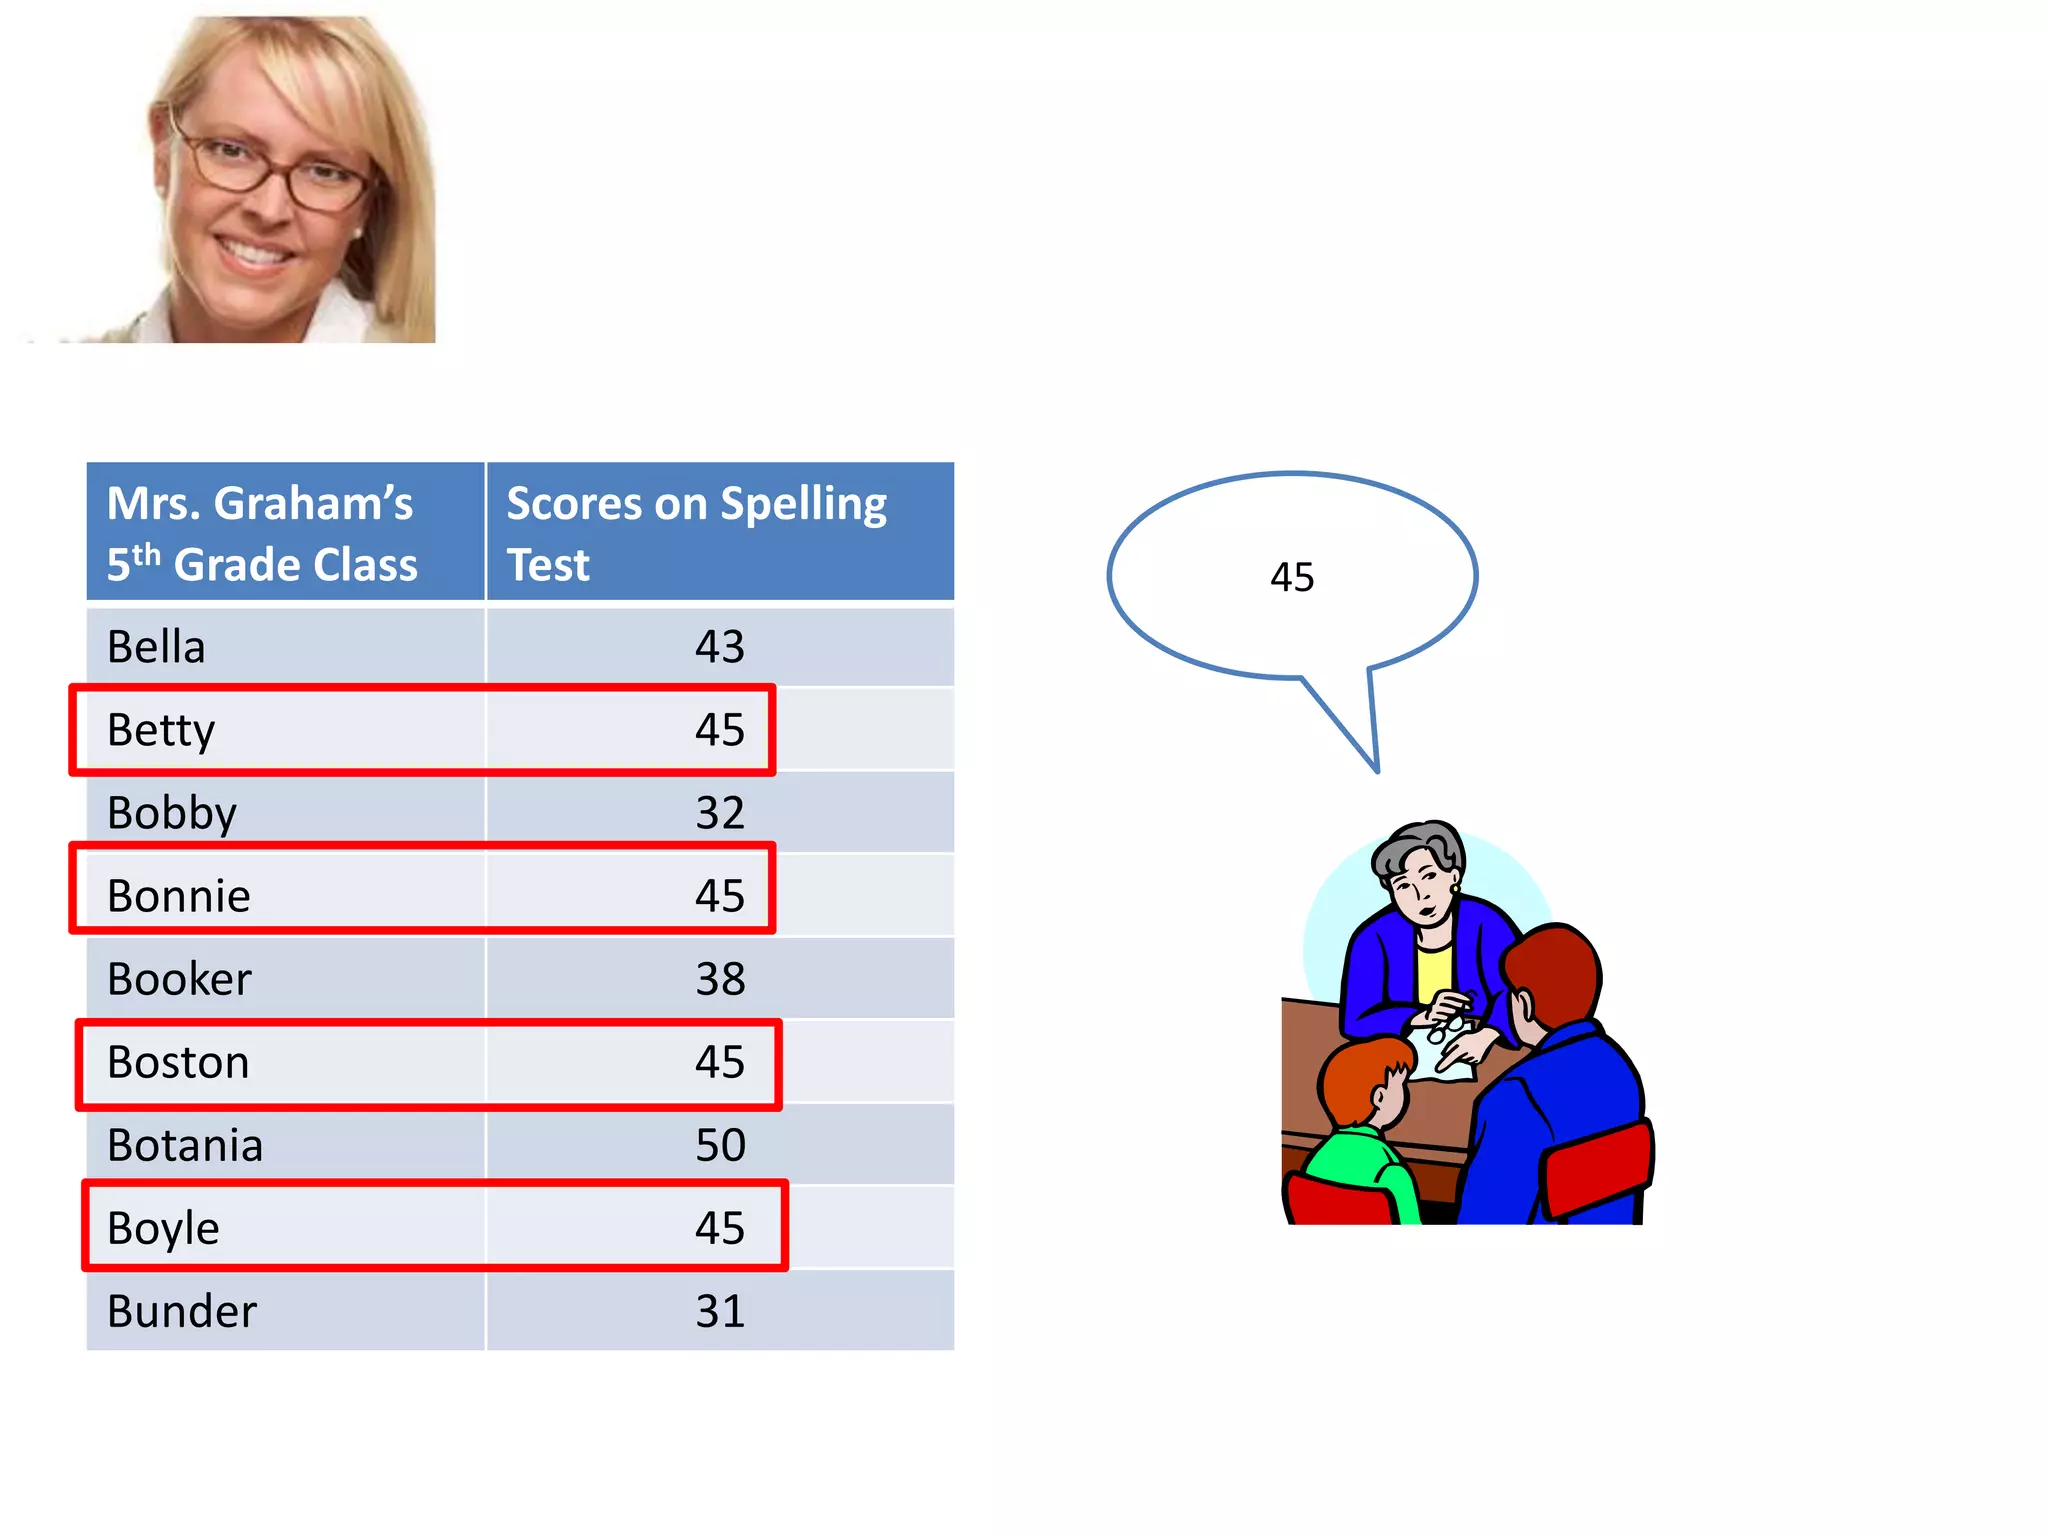

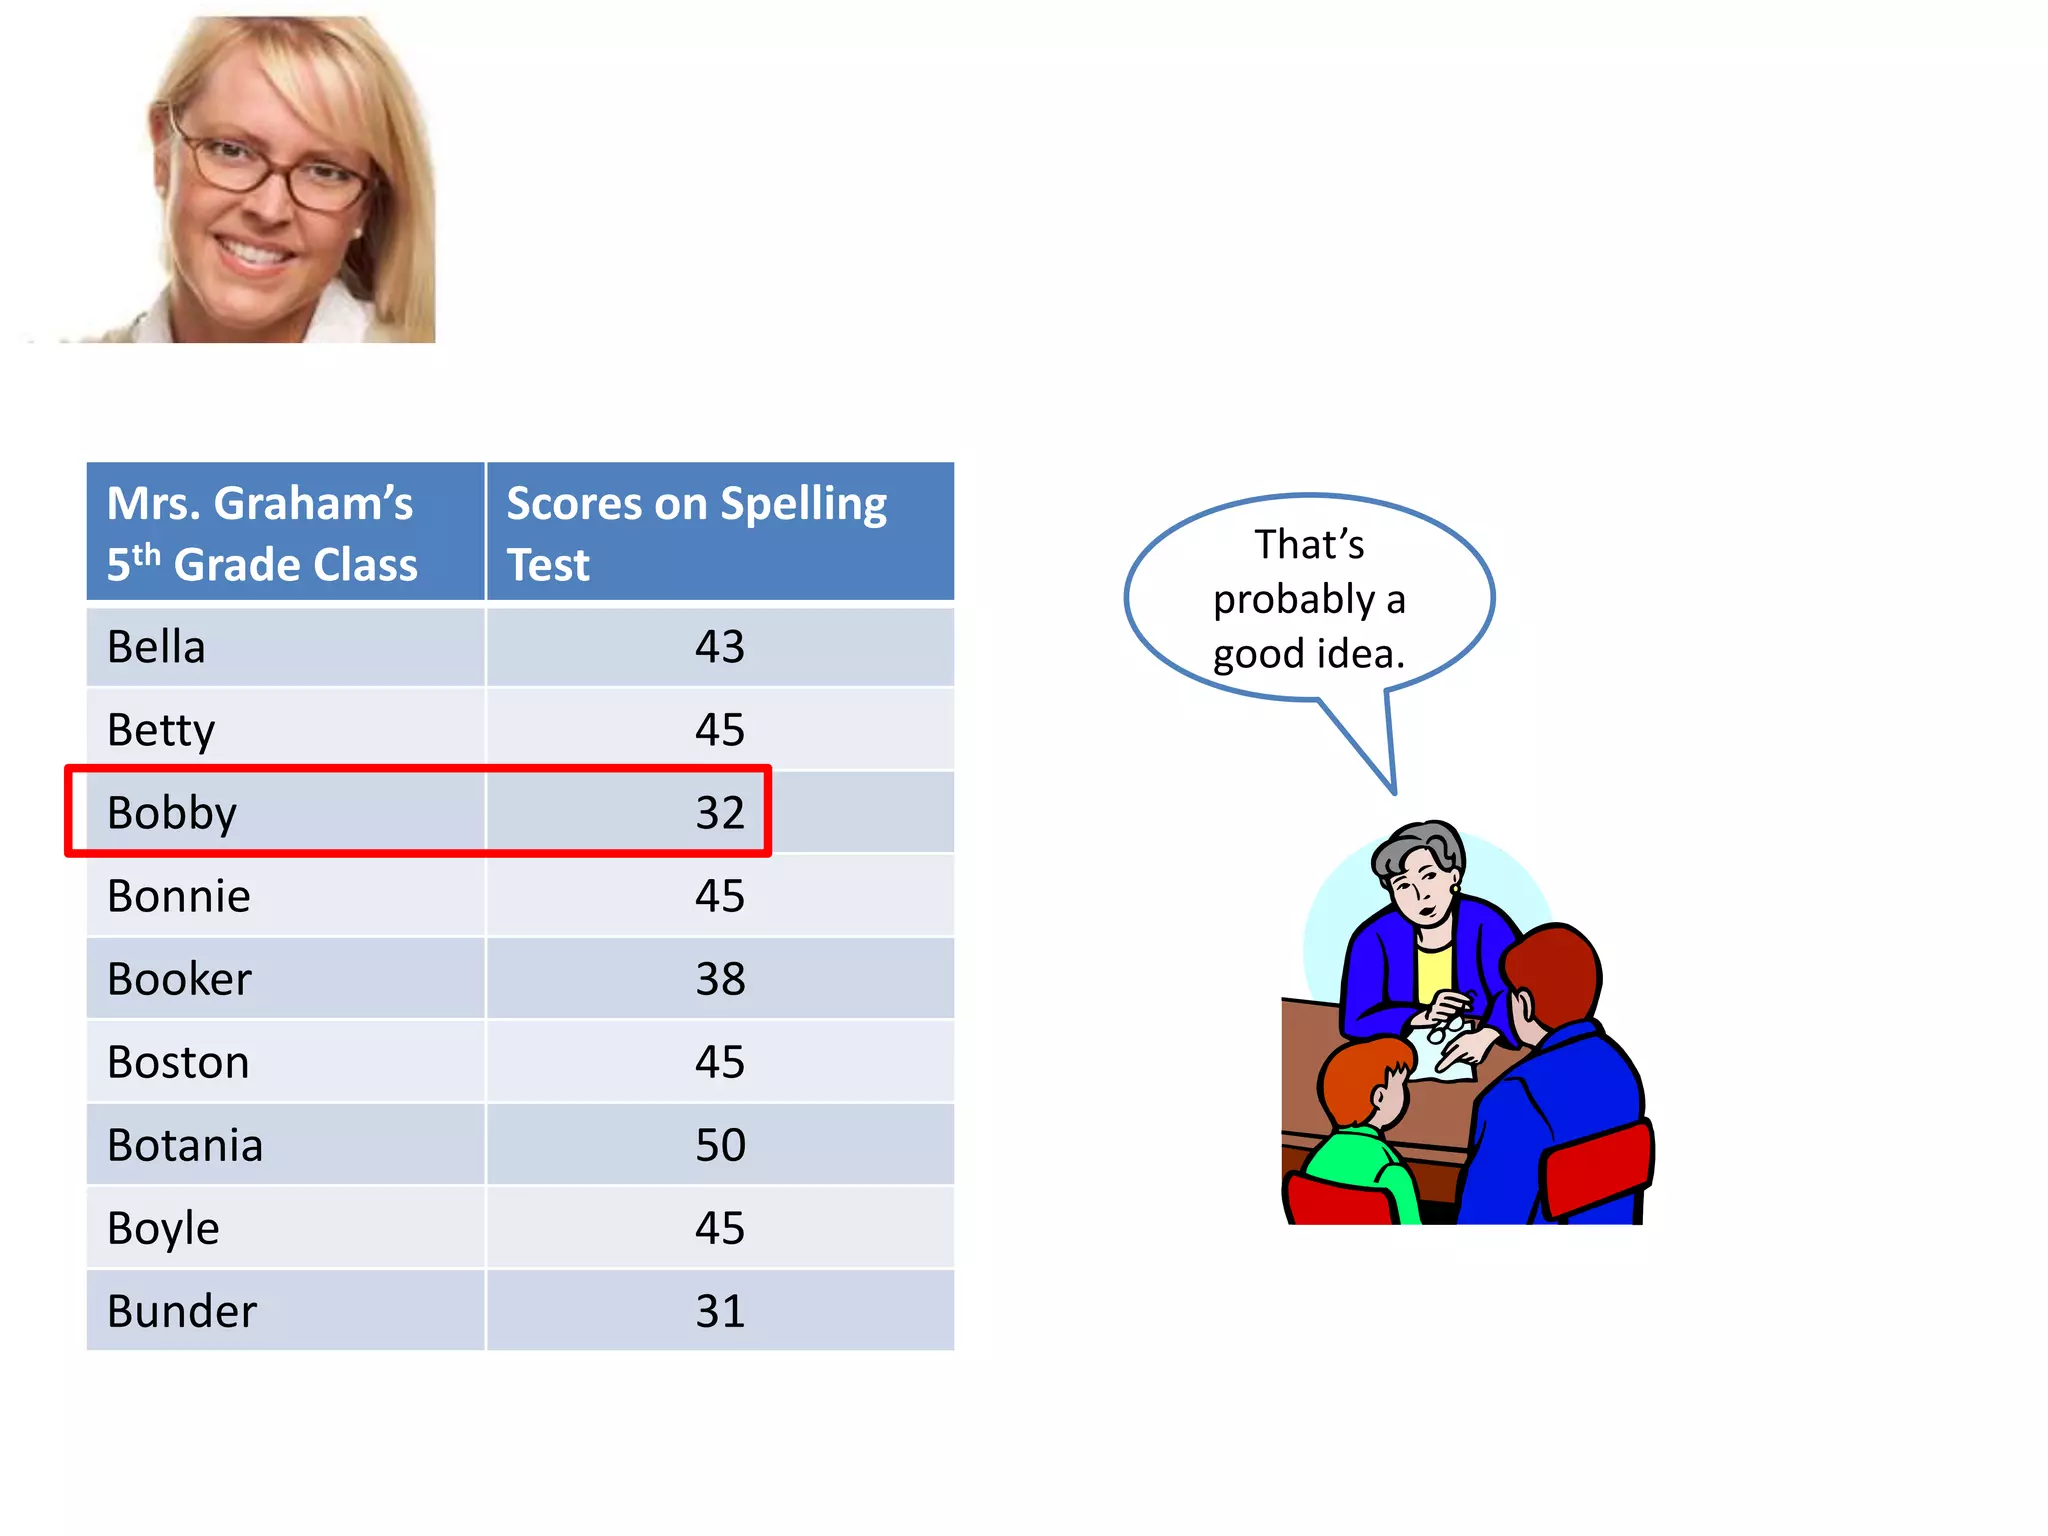

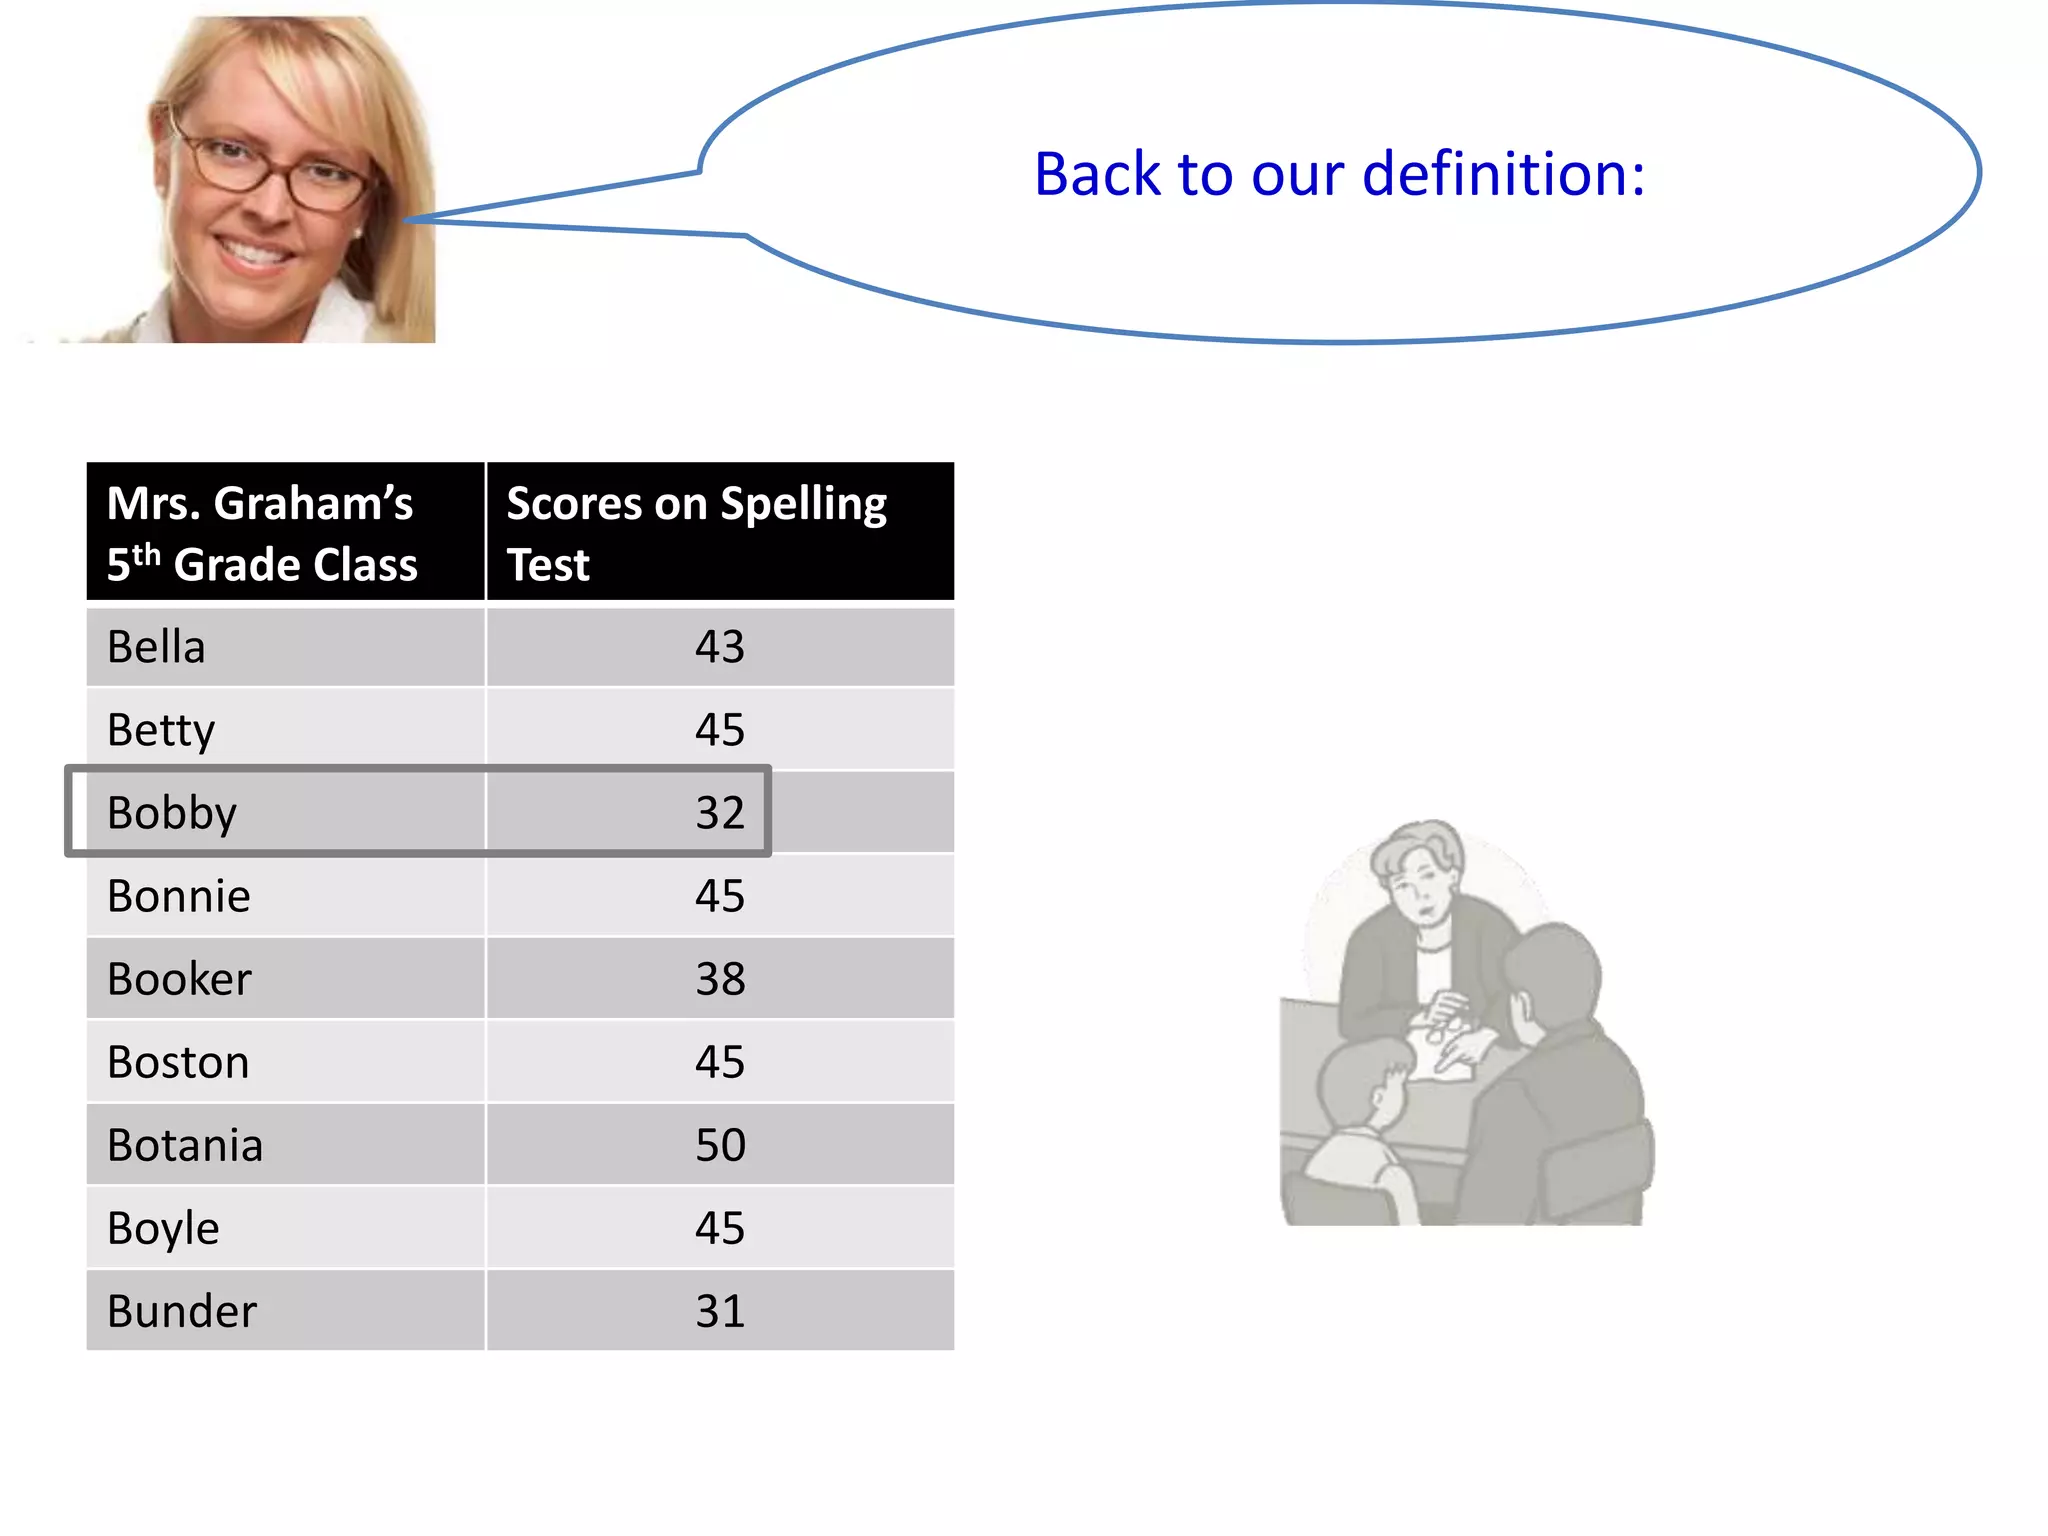
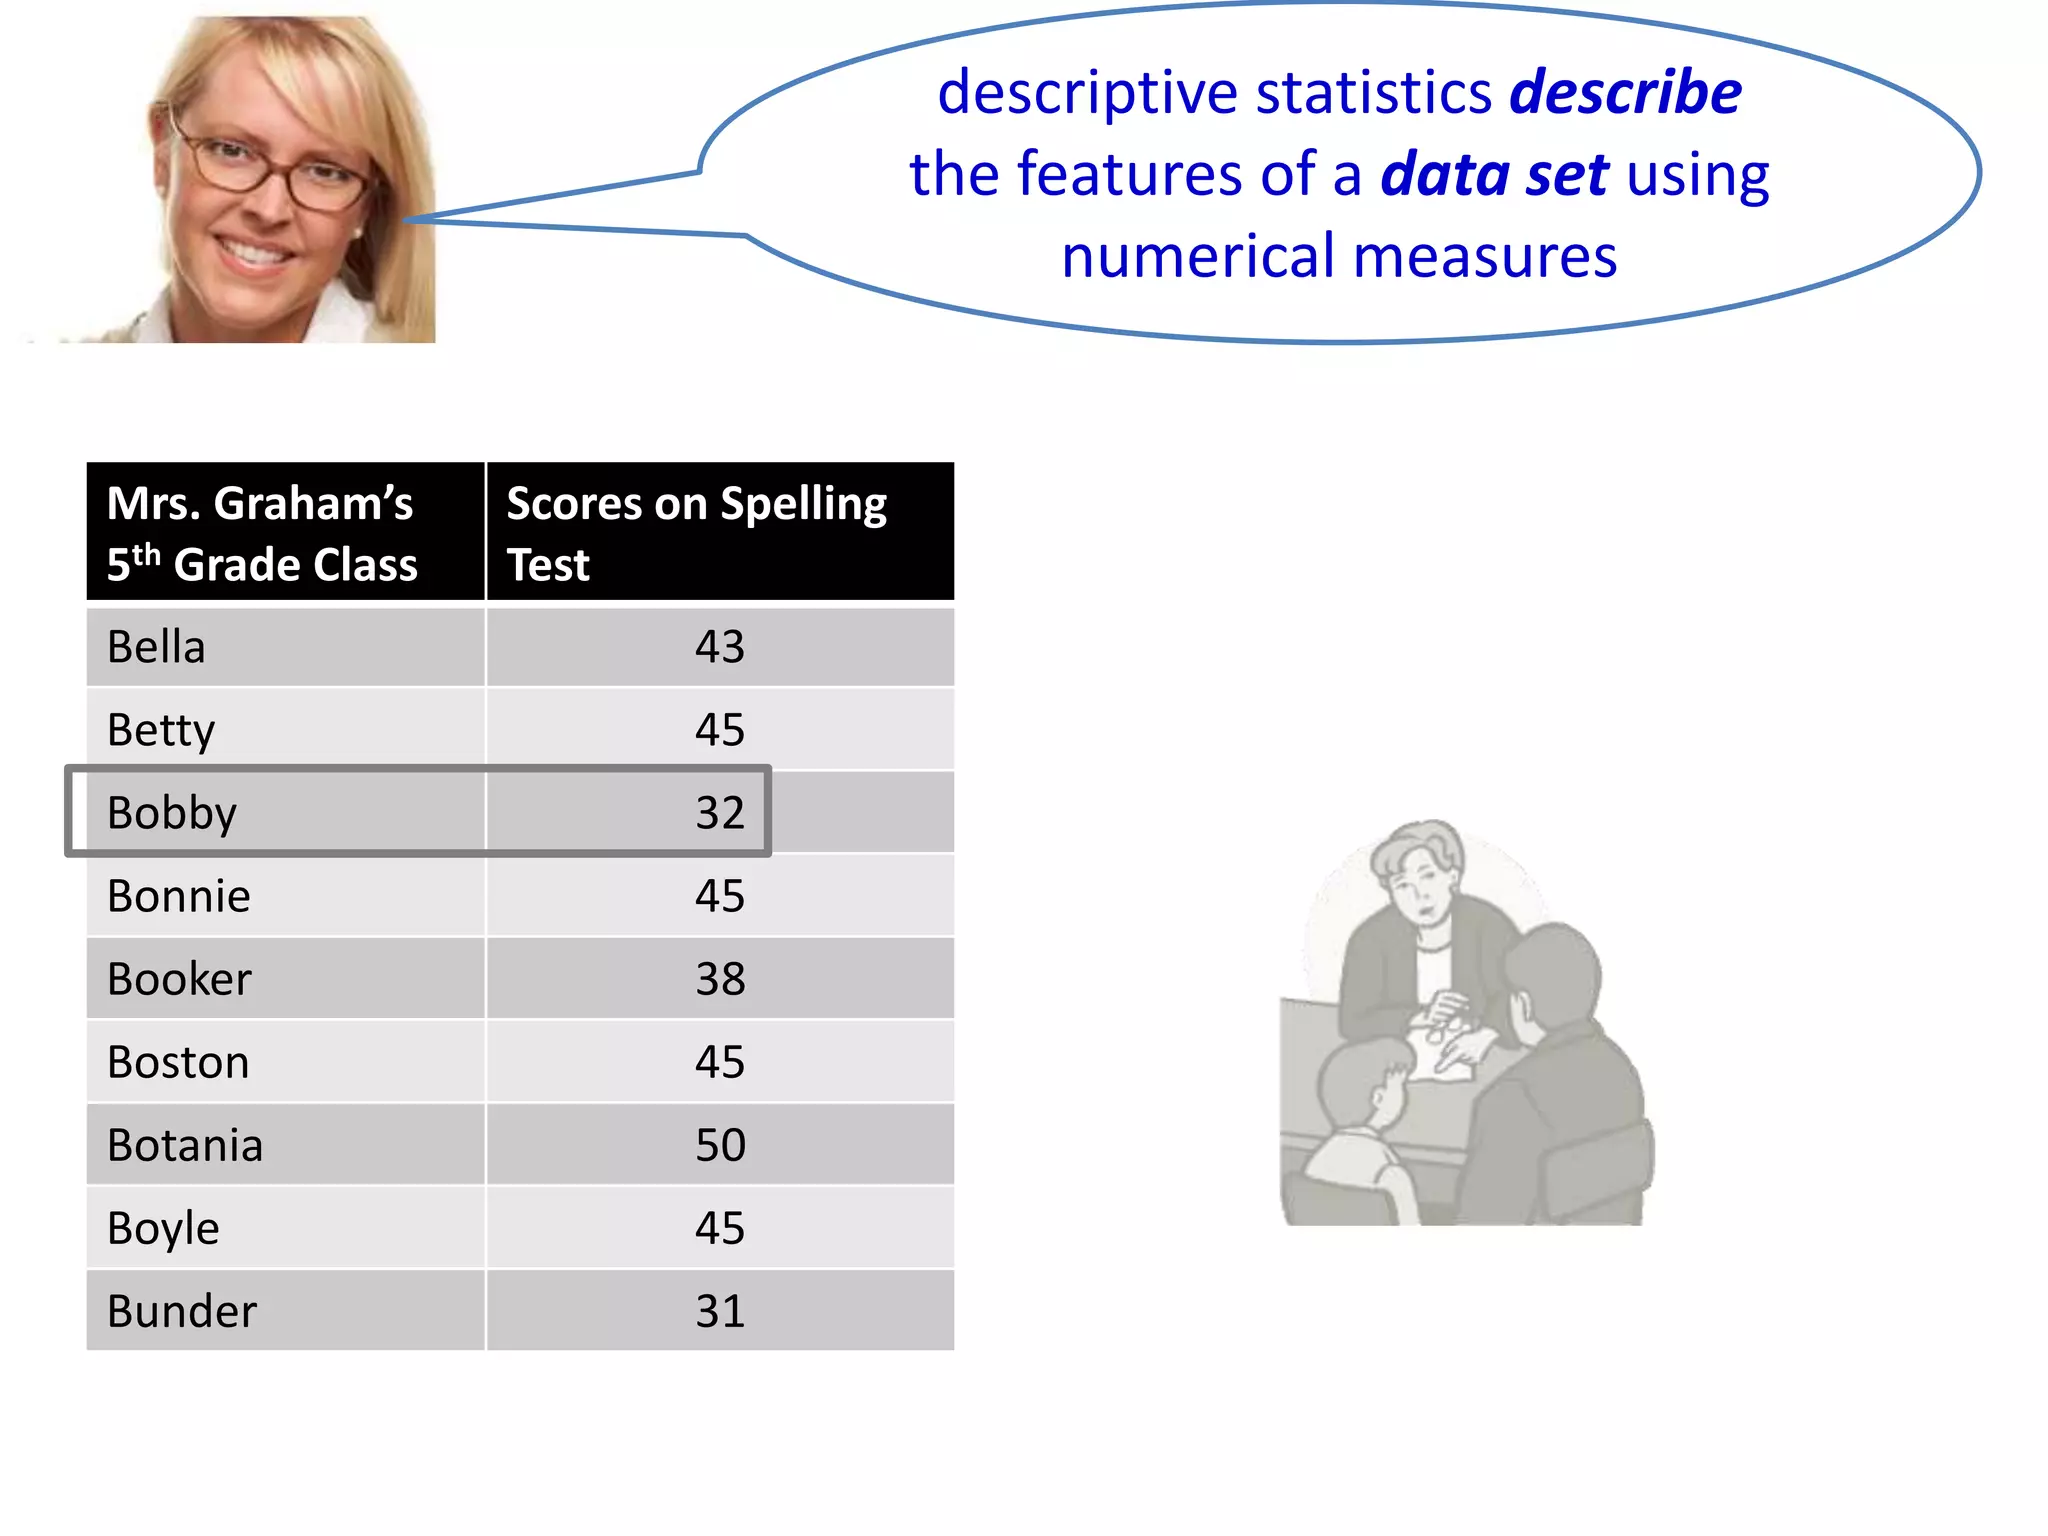
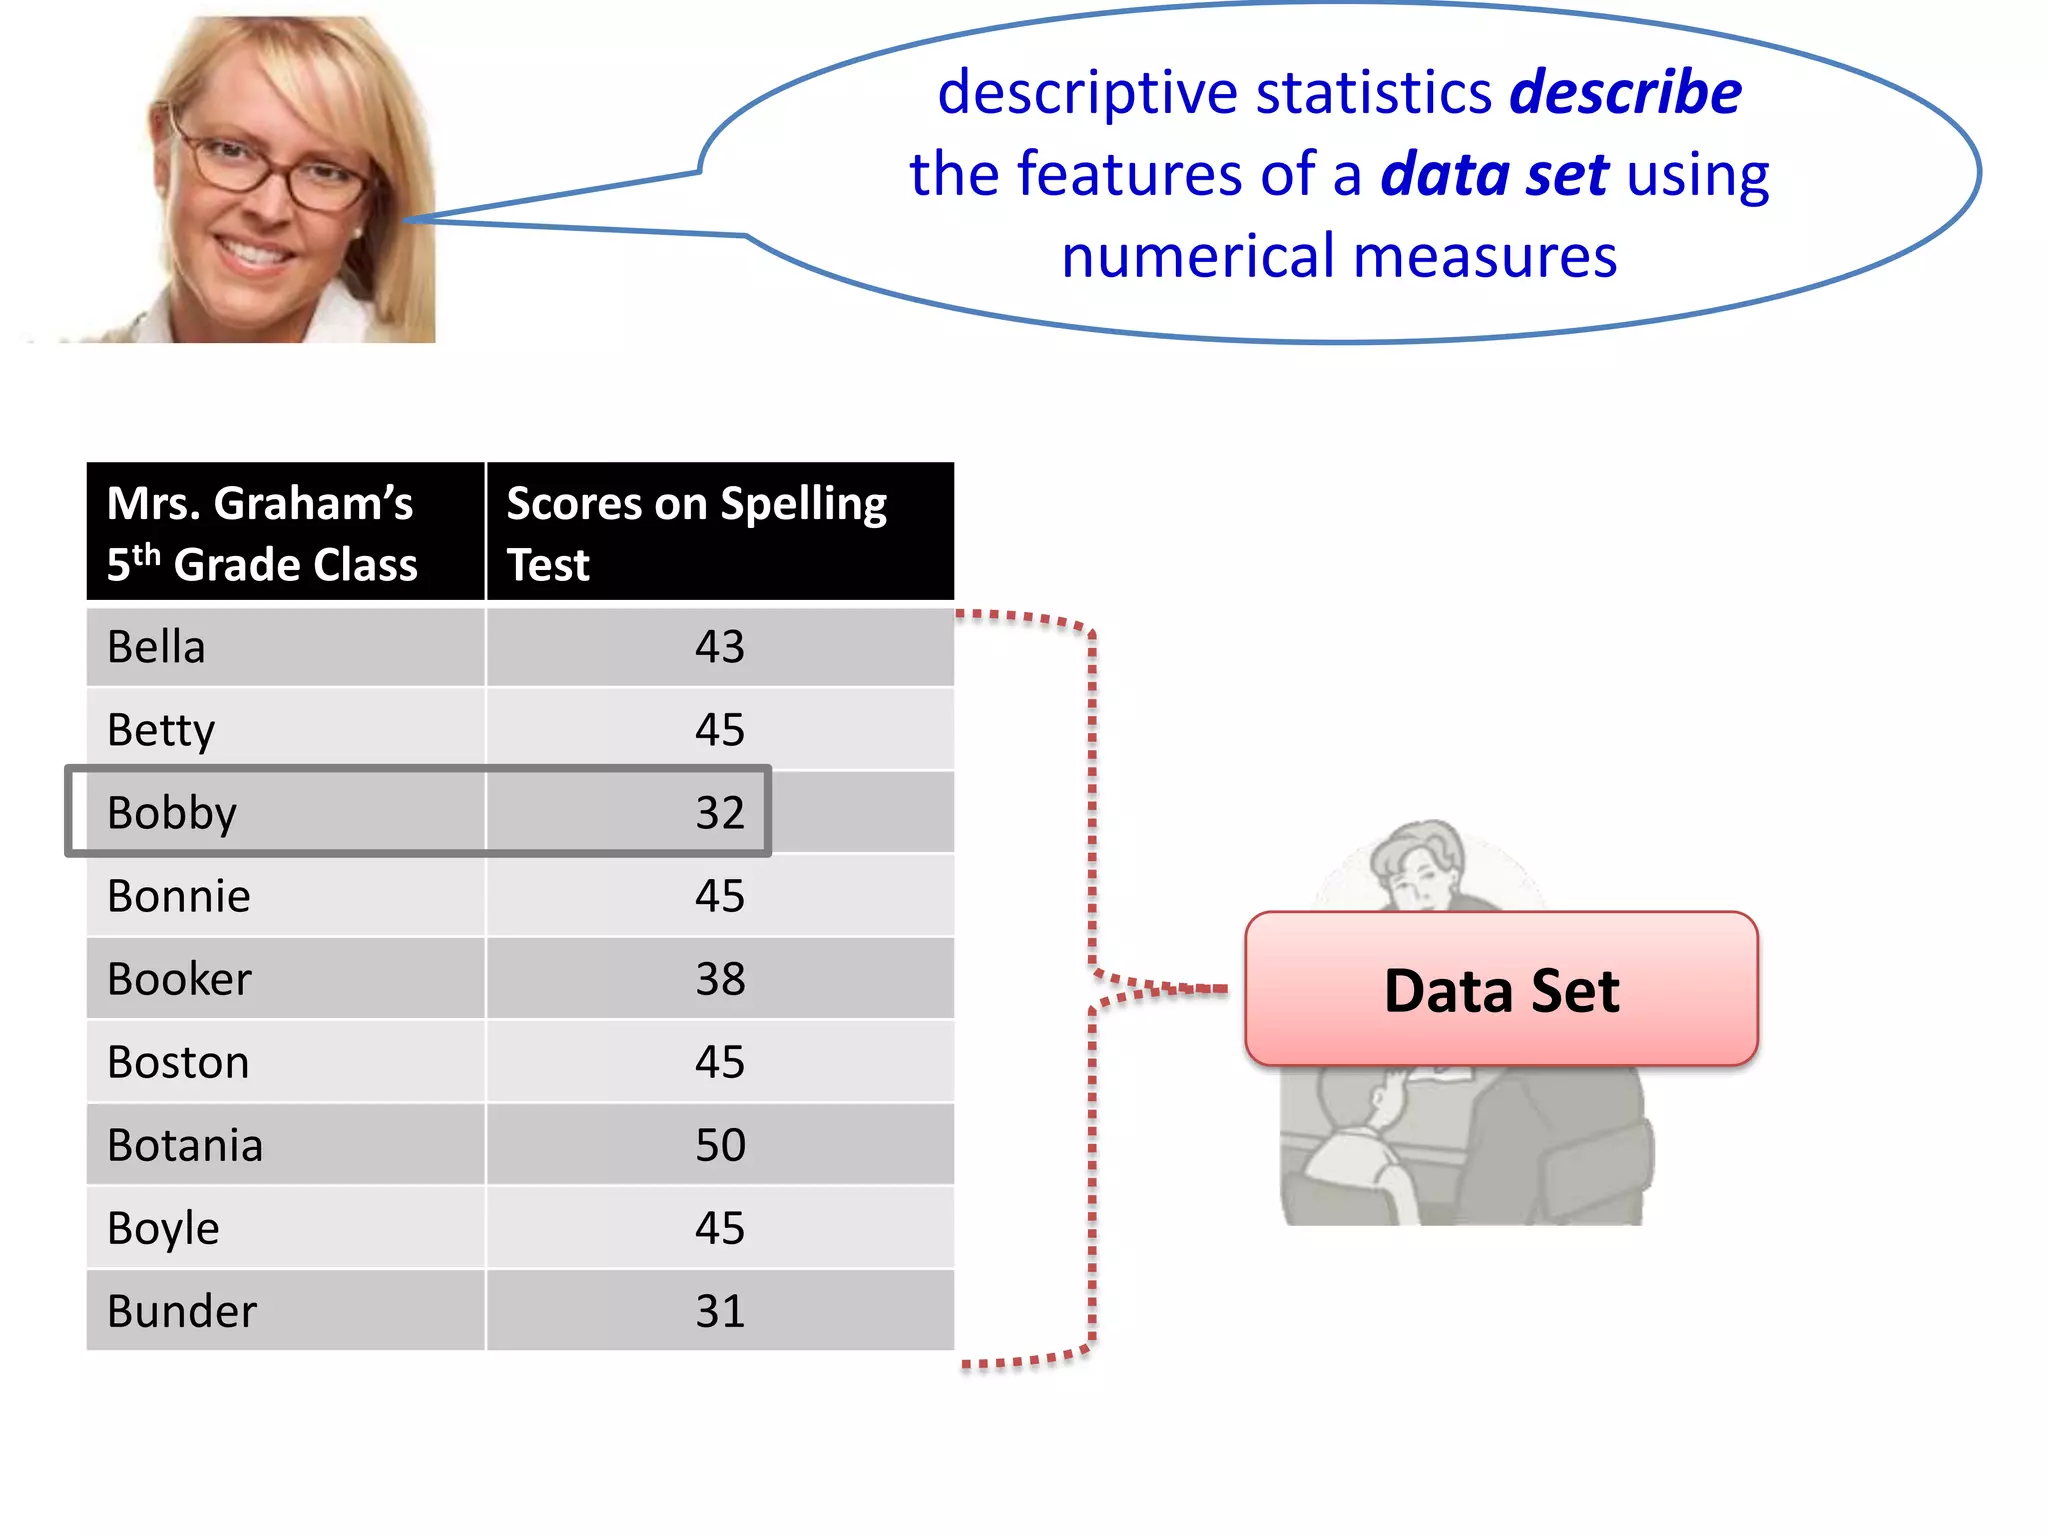
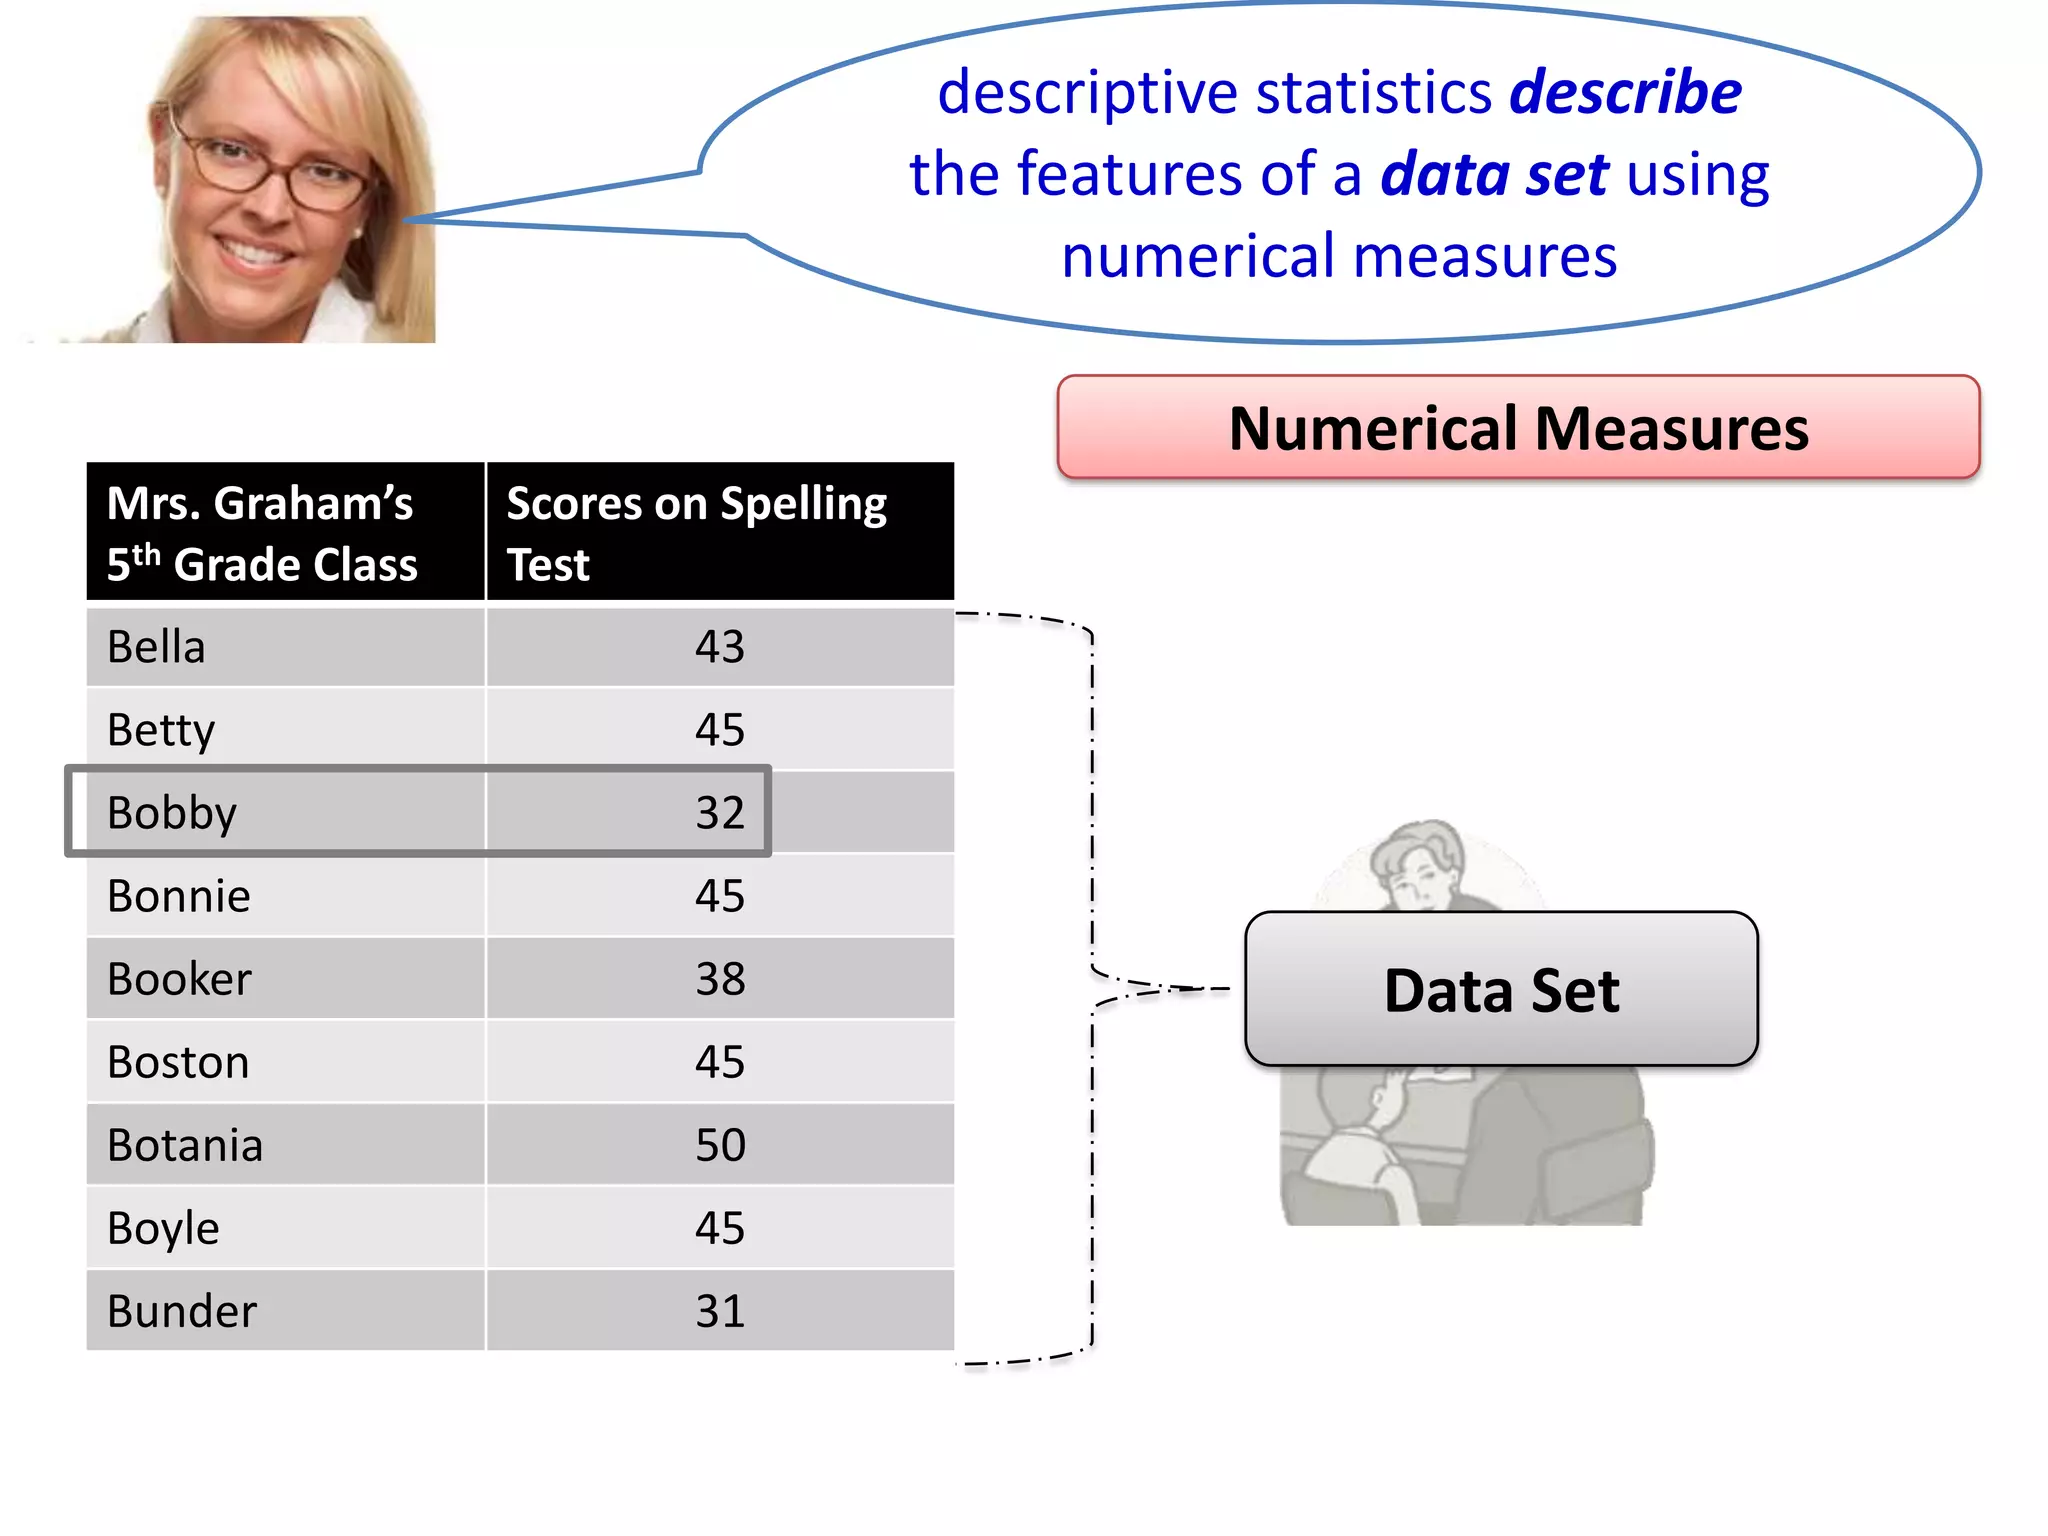
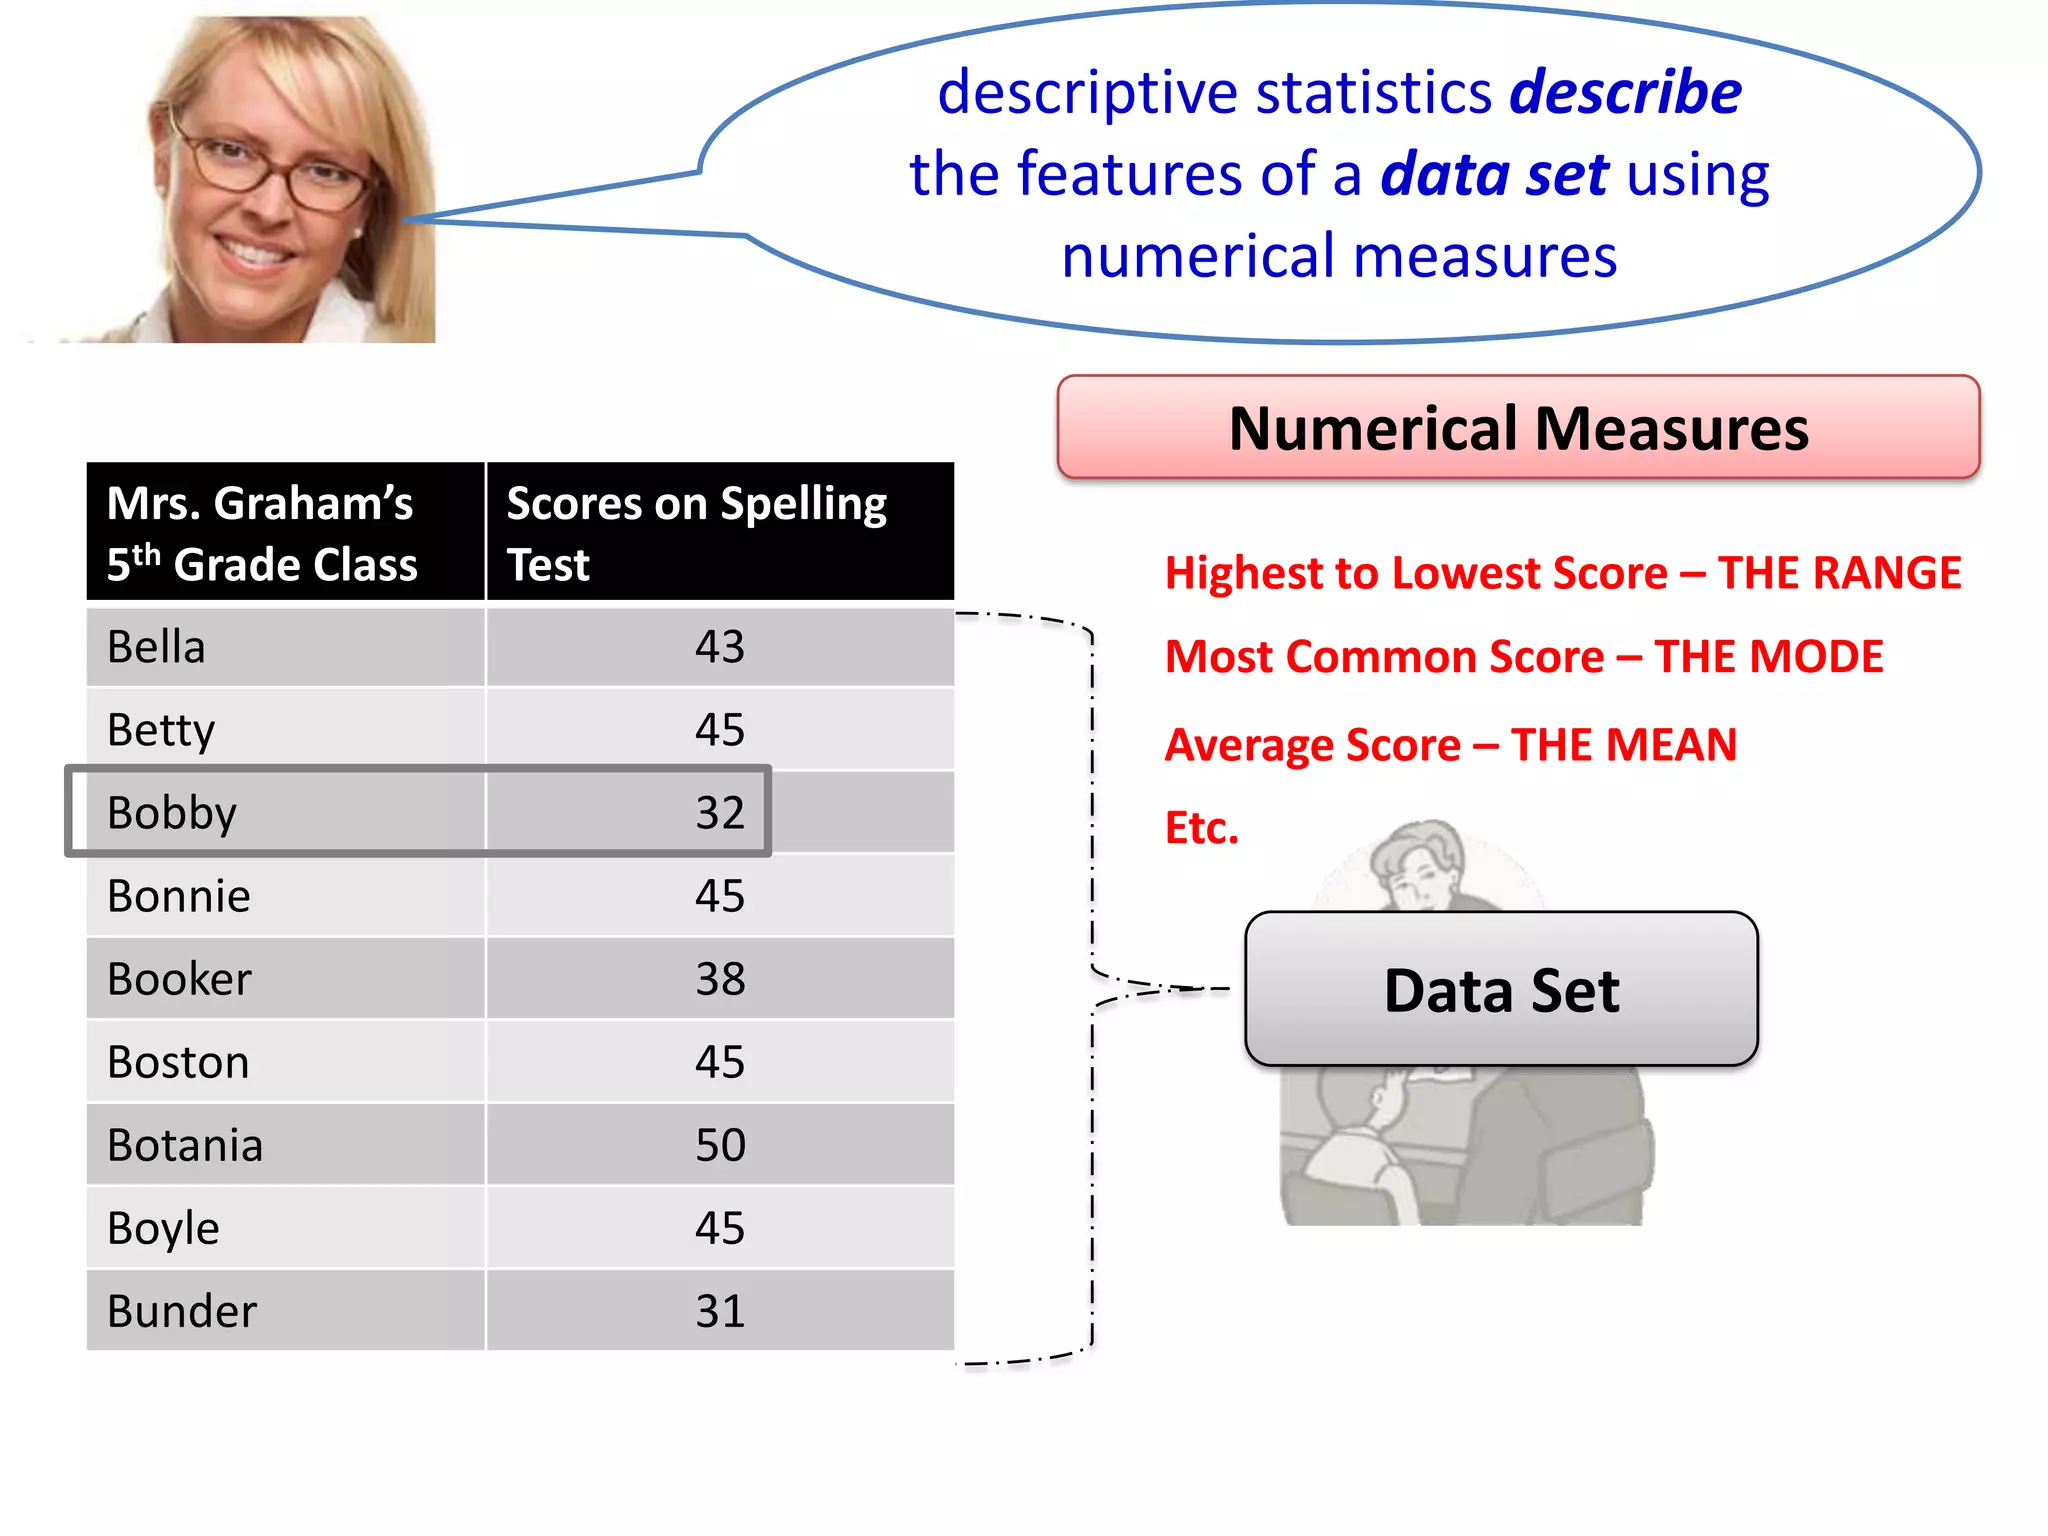

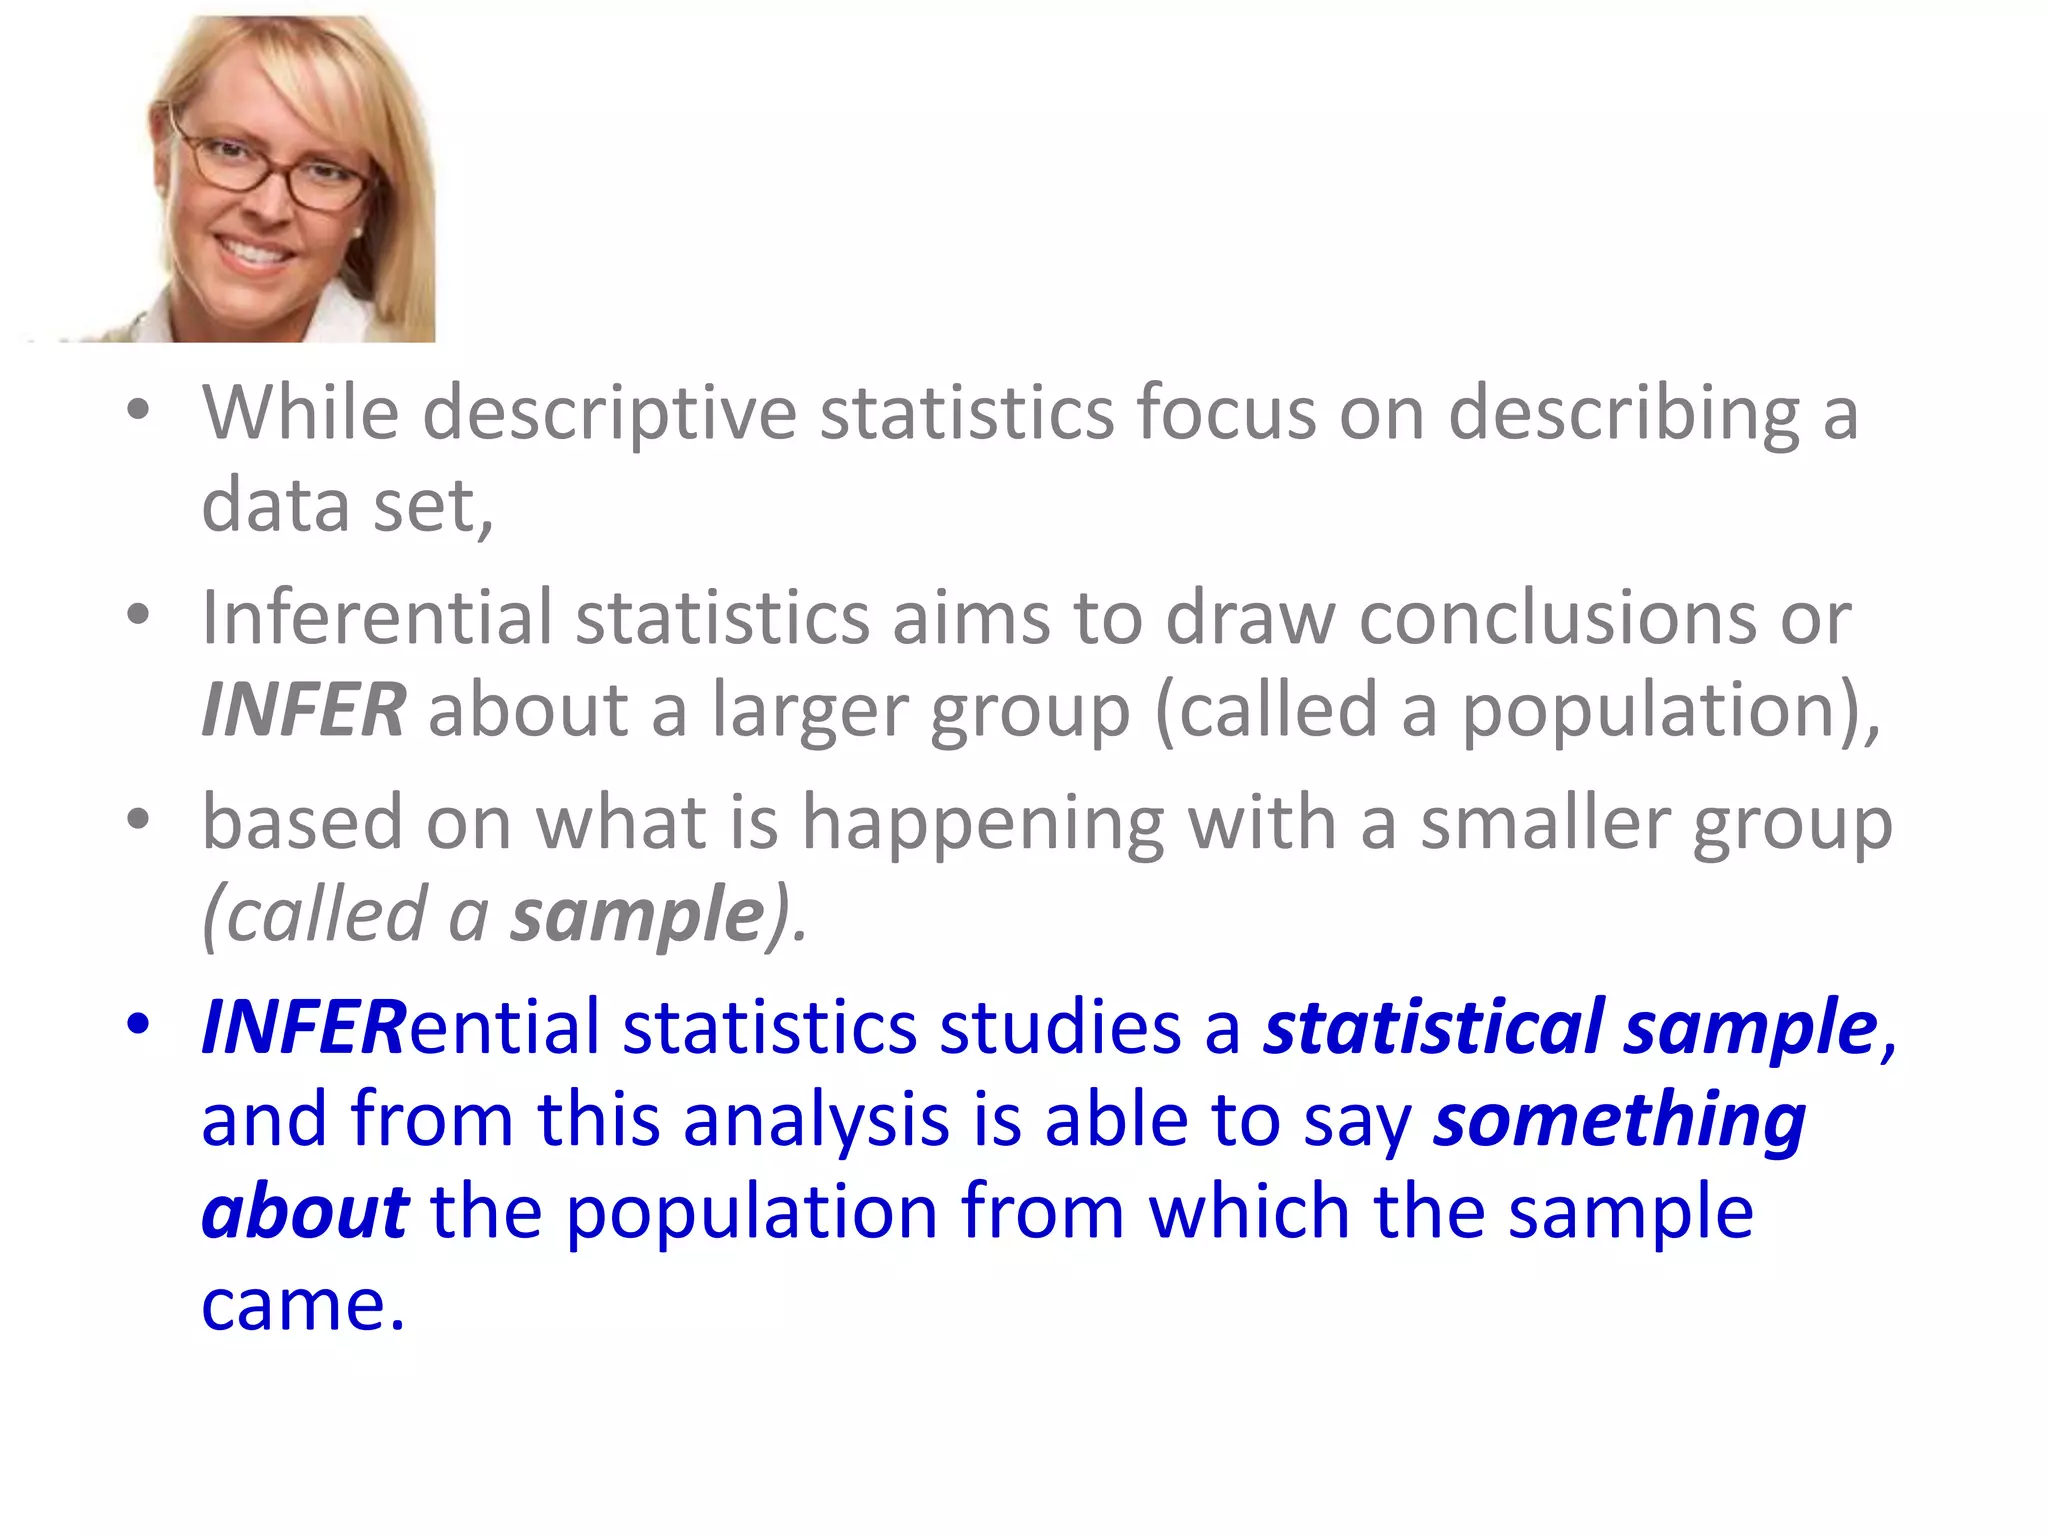

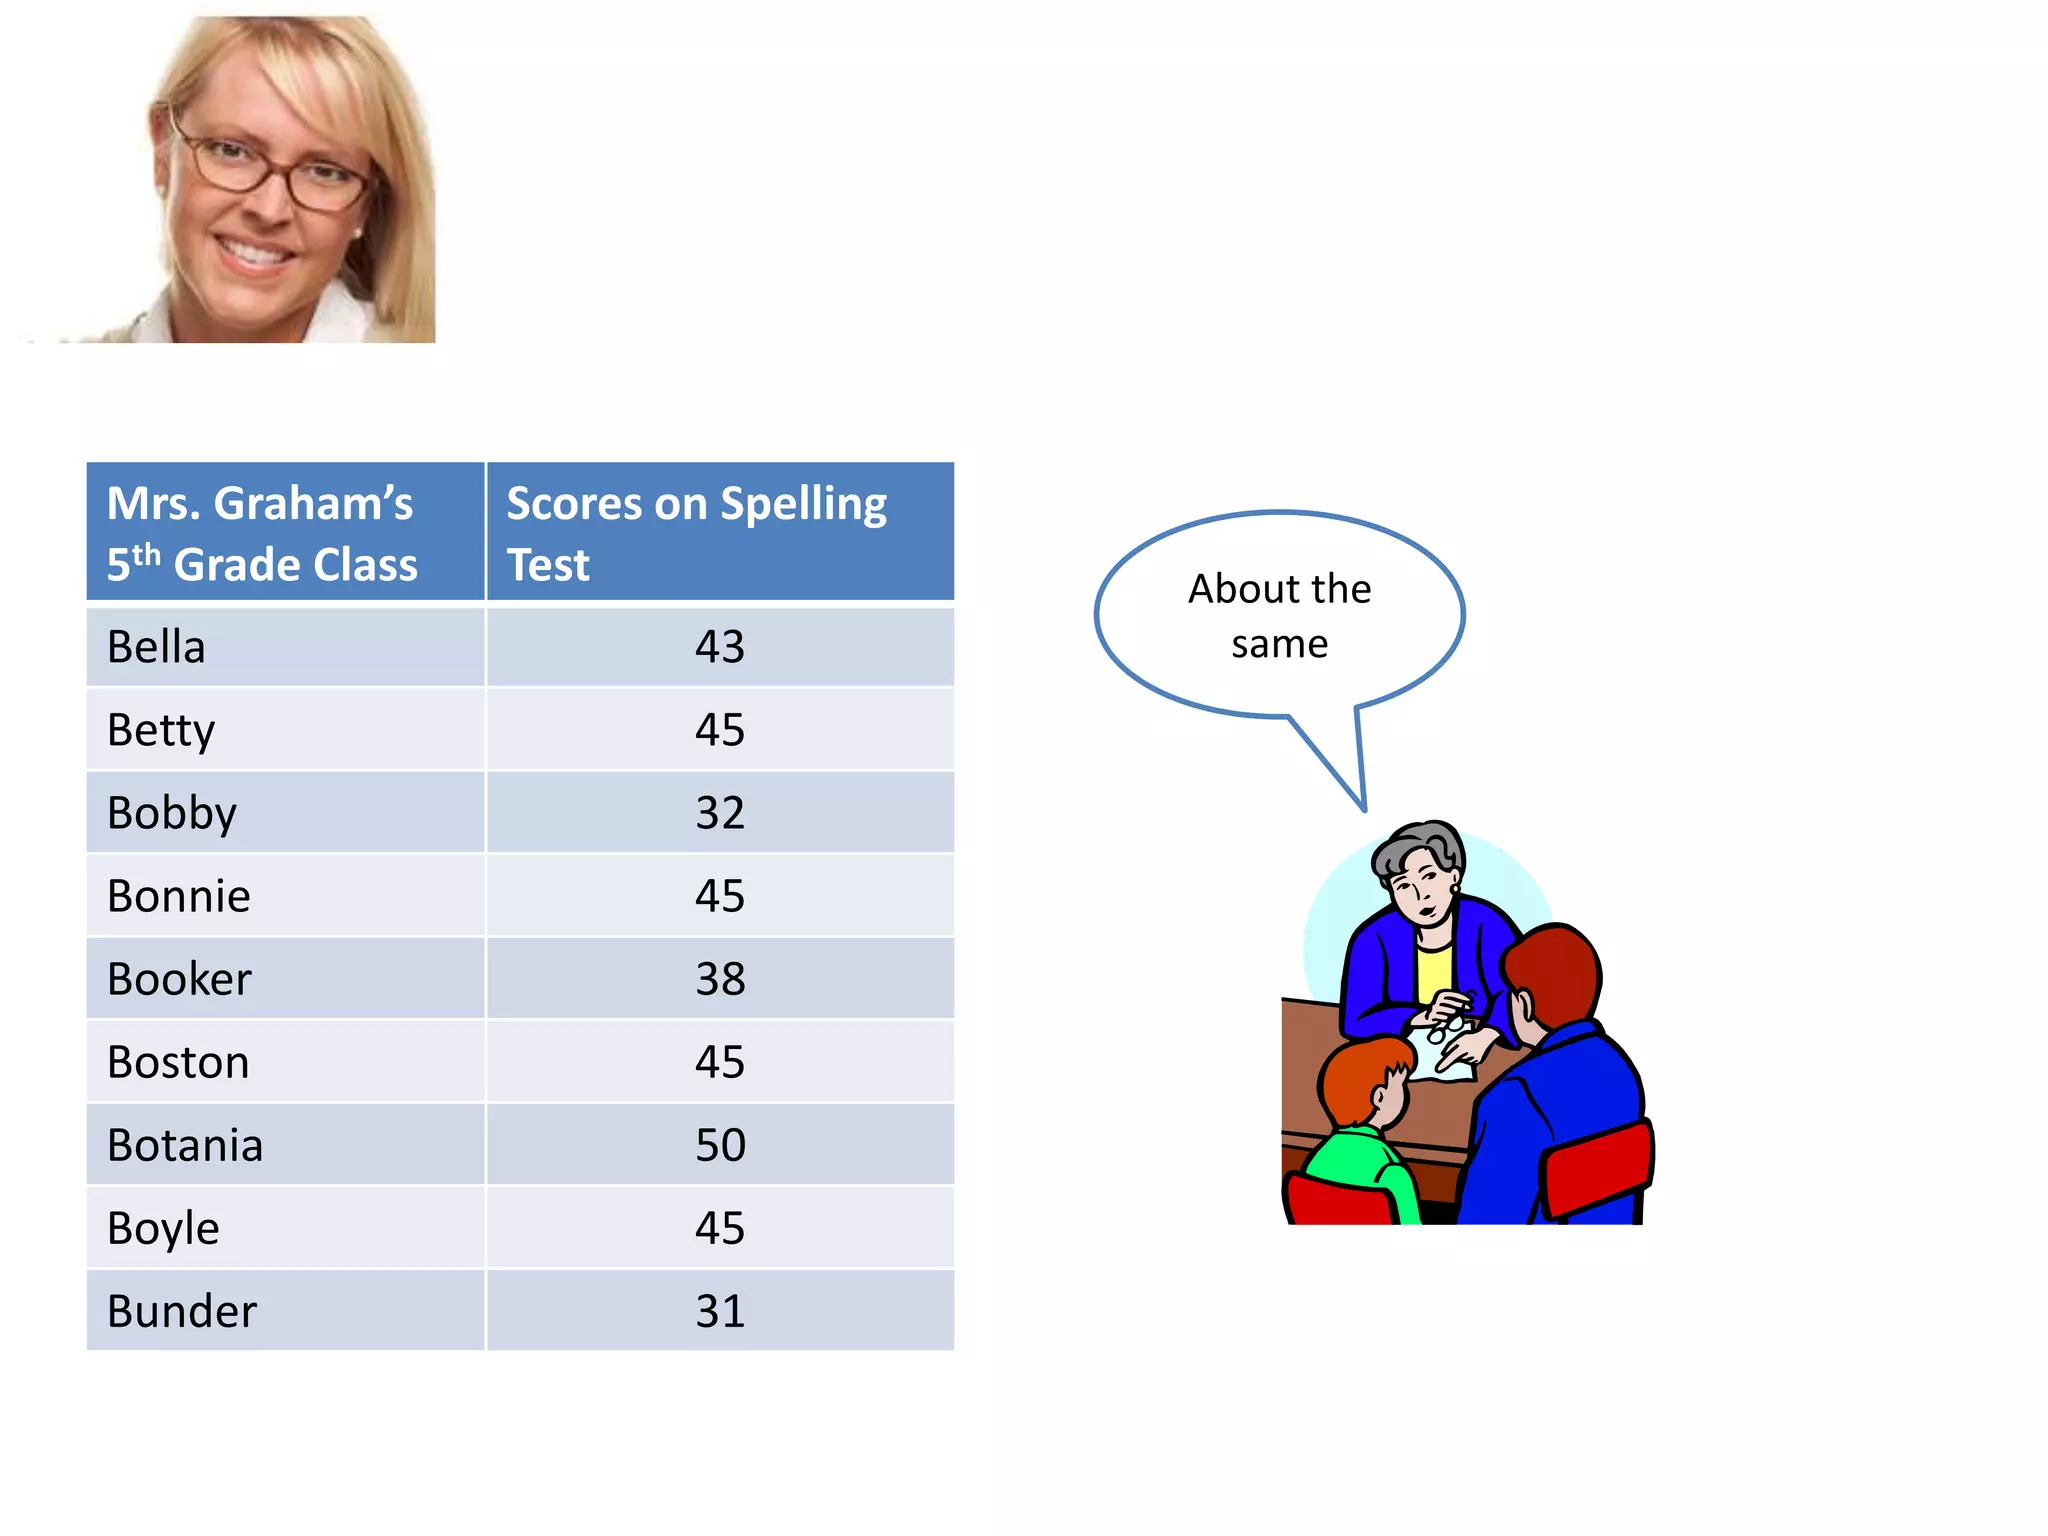


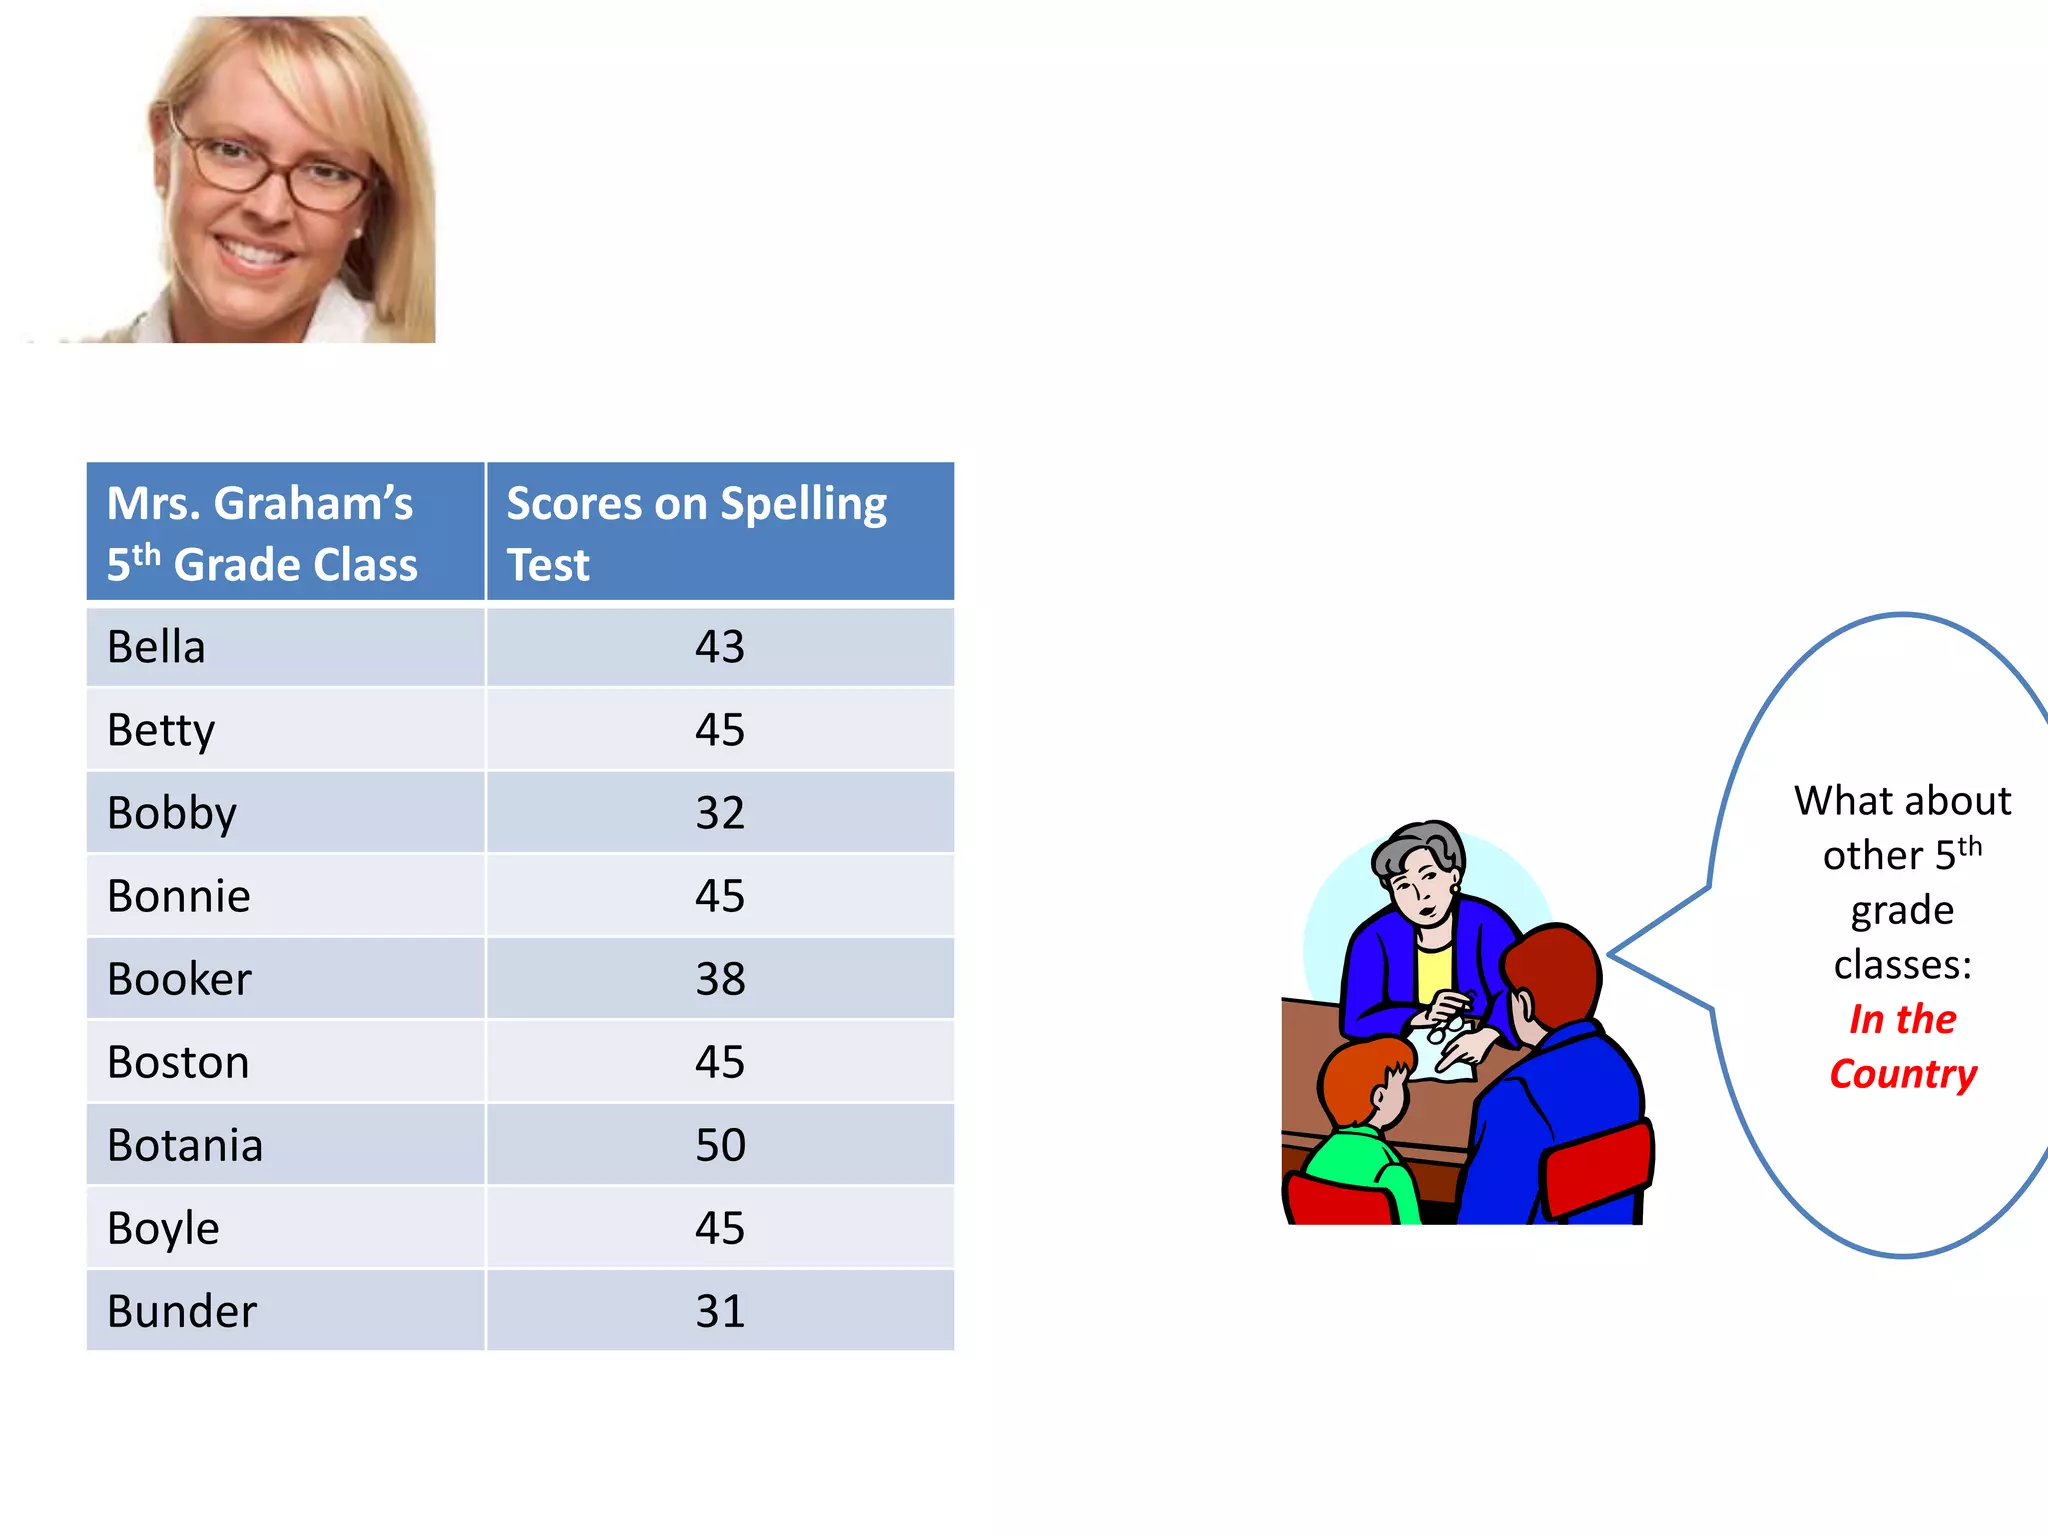

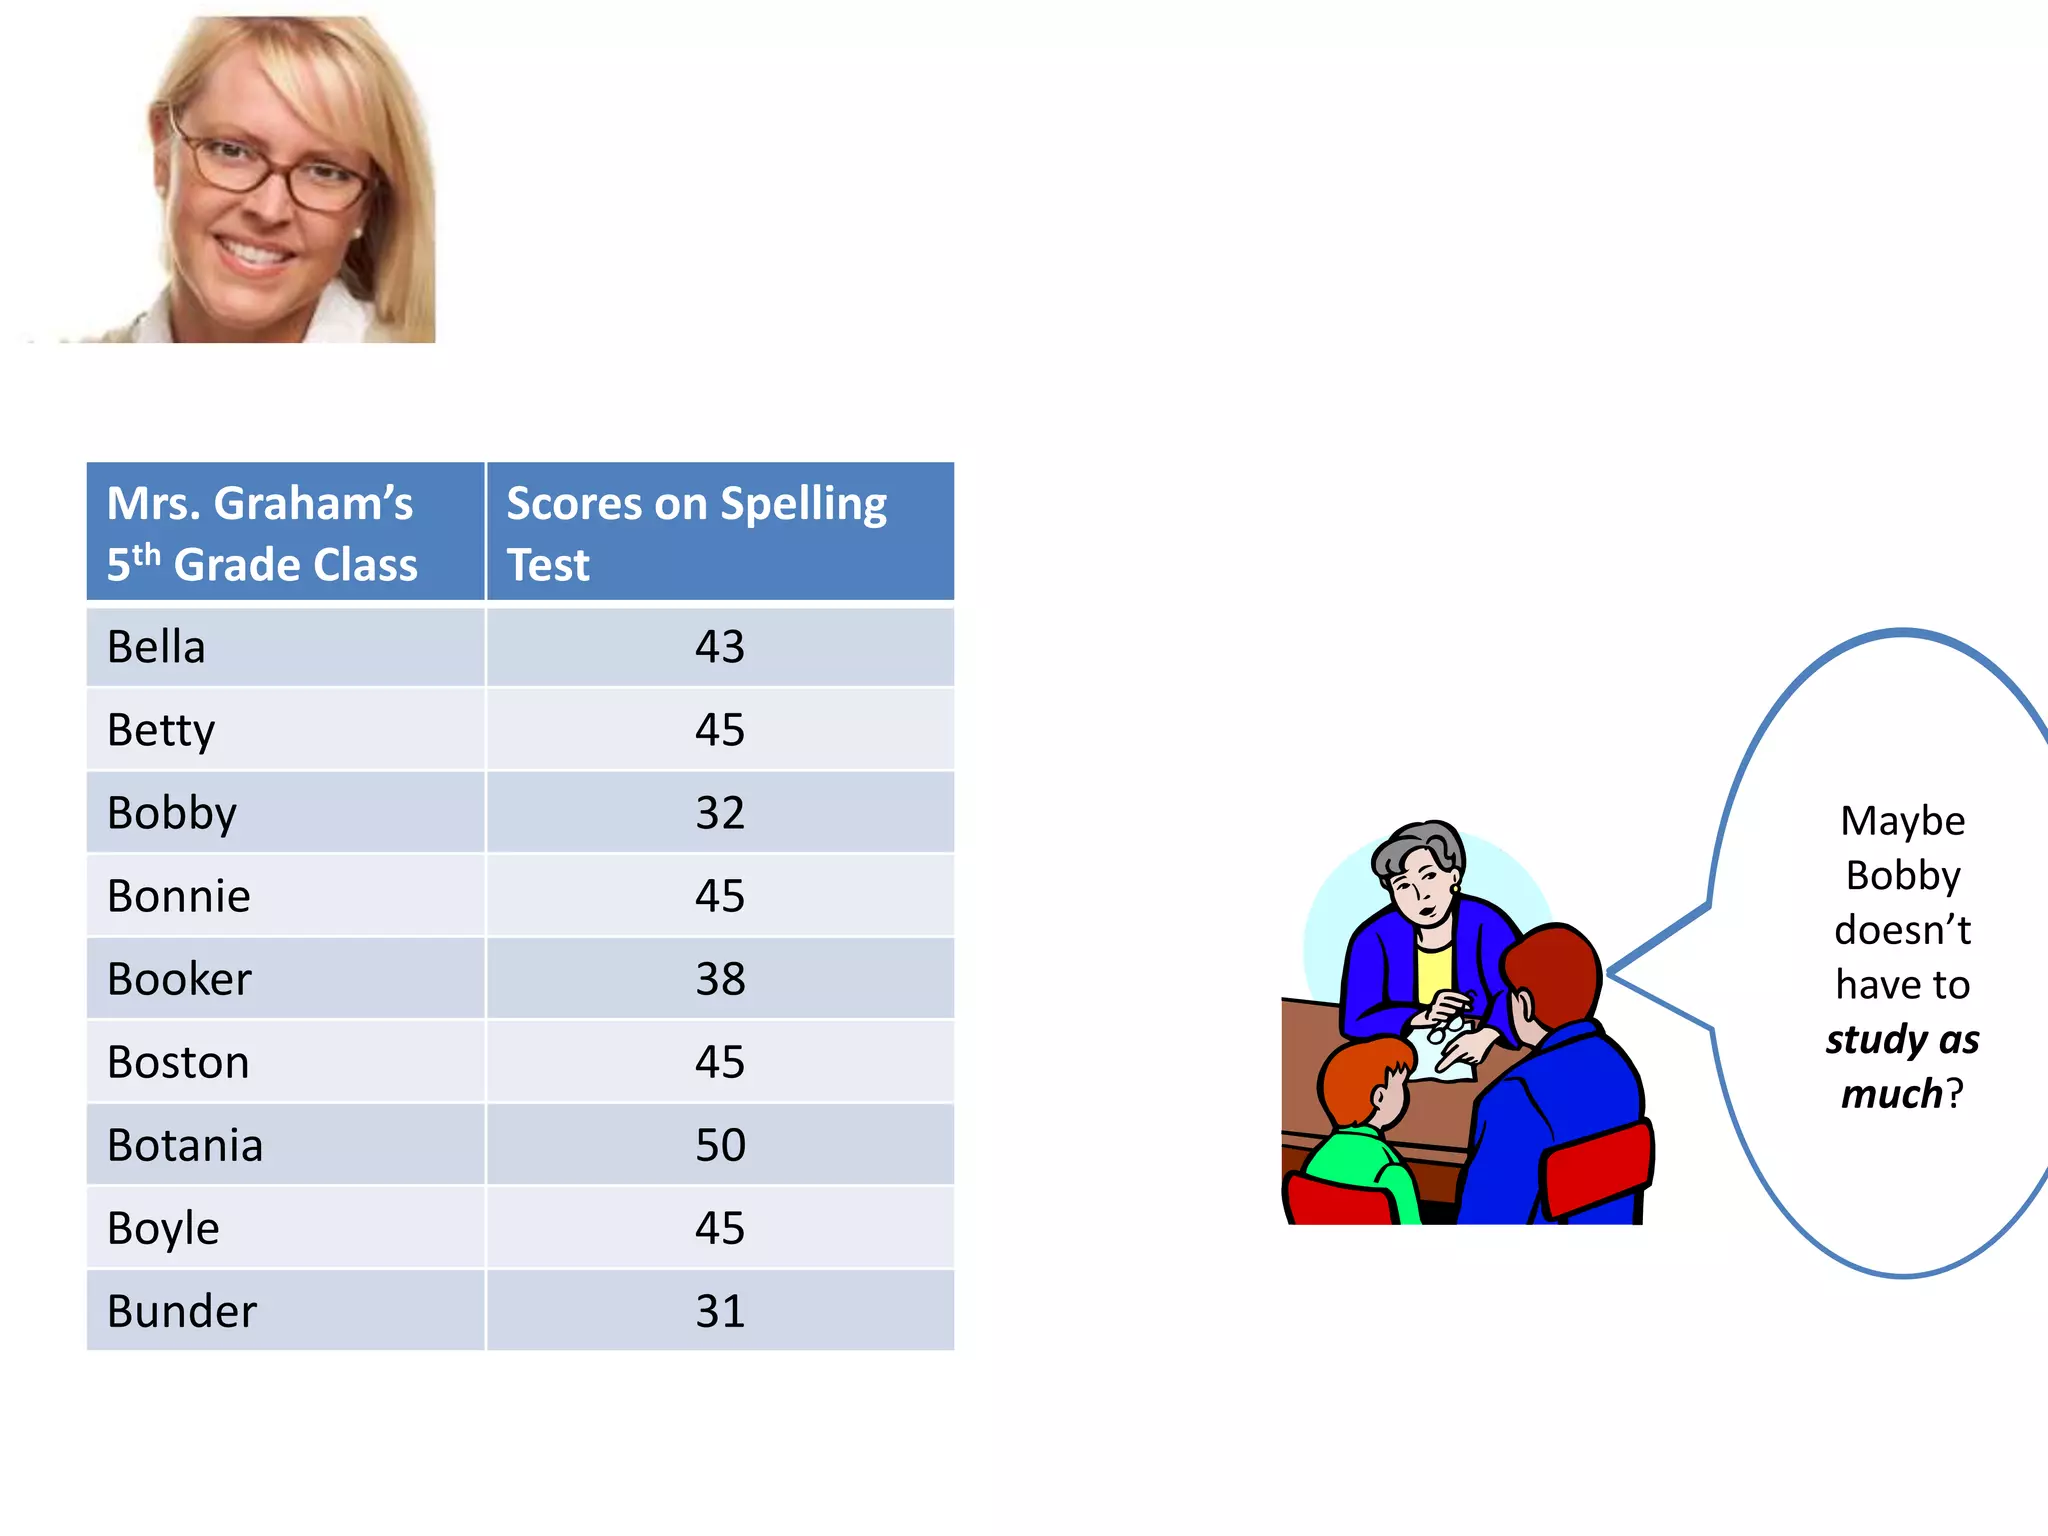


The document discusses descriptive and inferential statistics. Descriptive statistics describe the features of a data set using numerical measures like the range, mode, and mean. Inferential statistics draw conclusions about a larger population based on analyzing a sample, allowing inferences to be made about the population. The example shows a teacher using descriptive statistics to answer a parent's questions about their child's spelling test scores and the class data. The parent then asks inferential questions comparing the class to other groups, allowing the teacher to infer how the sample class compares more broadly.