Downloaded 74 times


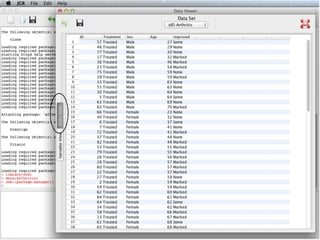
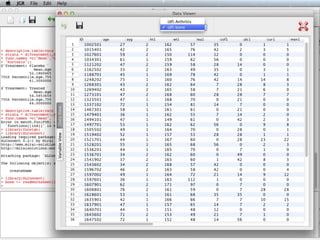
![Data Viewer for
overview of dataset
then
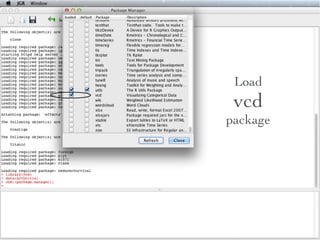
library(vcd) [then hit enter]](https://image.slidesharecdn.com/20121029deducer-121020211504-phpapp02/85/Introduction-to-Deducer-21-320.jpg)
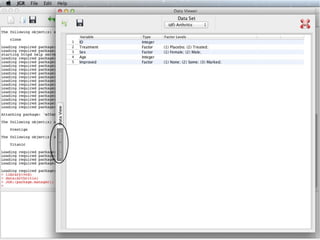
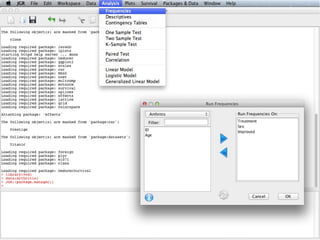
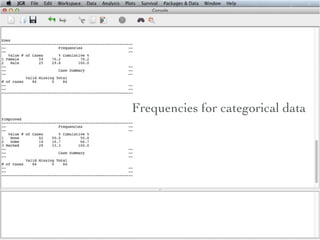
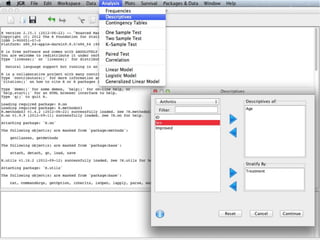
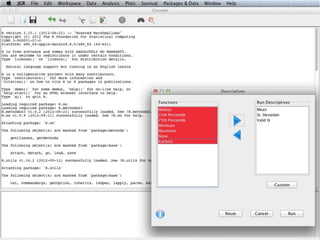
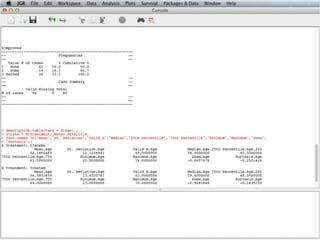

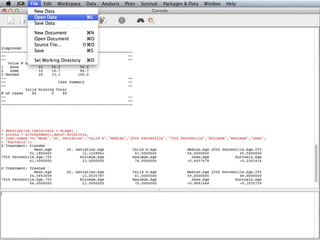

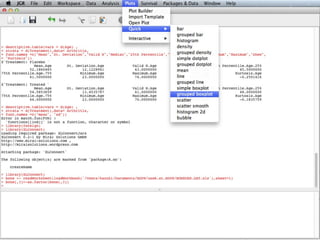
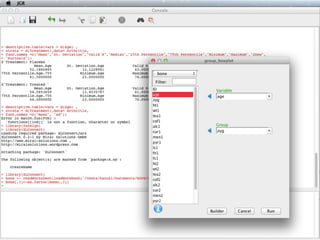
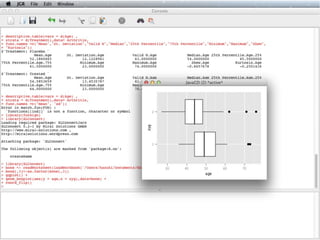
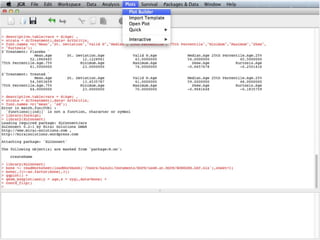
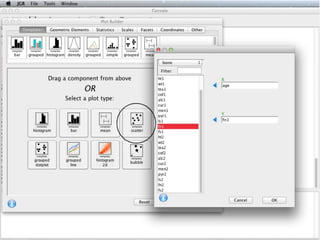
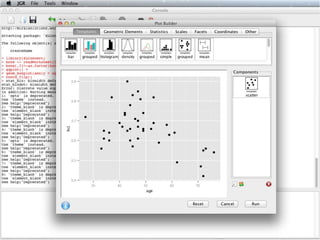
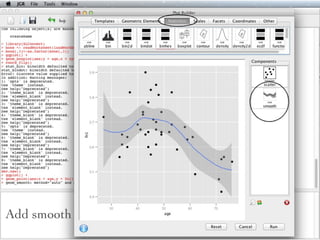
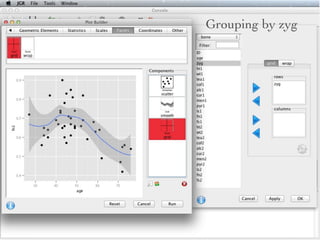
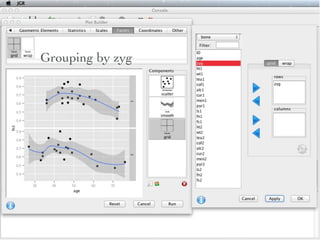
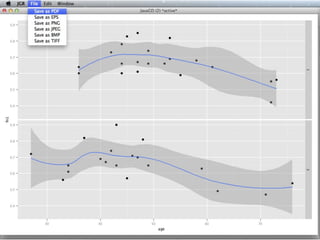


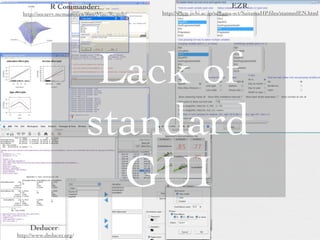
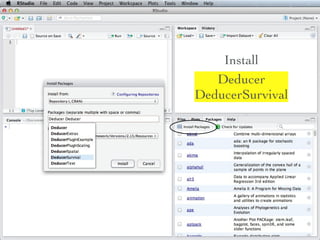
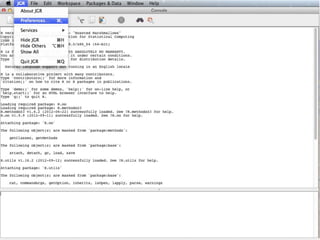
This document provides an introduction to using the Deducer graphical user interface (GUI) for R. It discusses loading and installing the Deducer and DeducerSurvival packages, exploring a sample dataset using the GUI's data viewer and generating frequency tables and graphs. Instructions are given on reading Excel data, converting variables to factors, and using the GUI to summarize categorical and continuous variables and add smoothing to graphs.