Downloaded 42 times


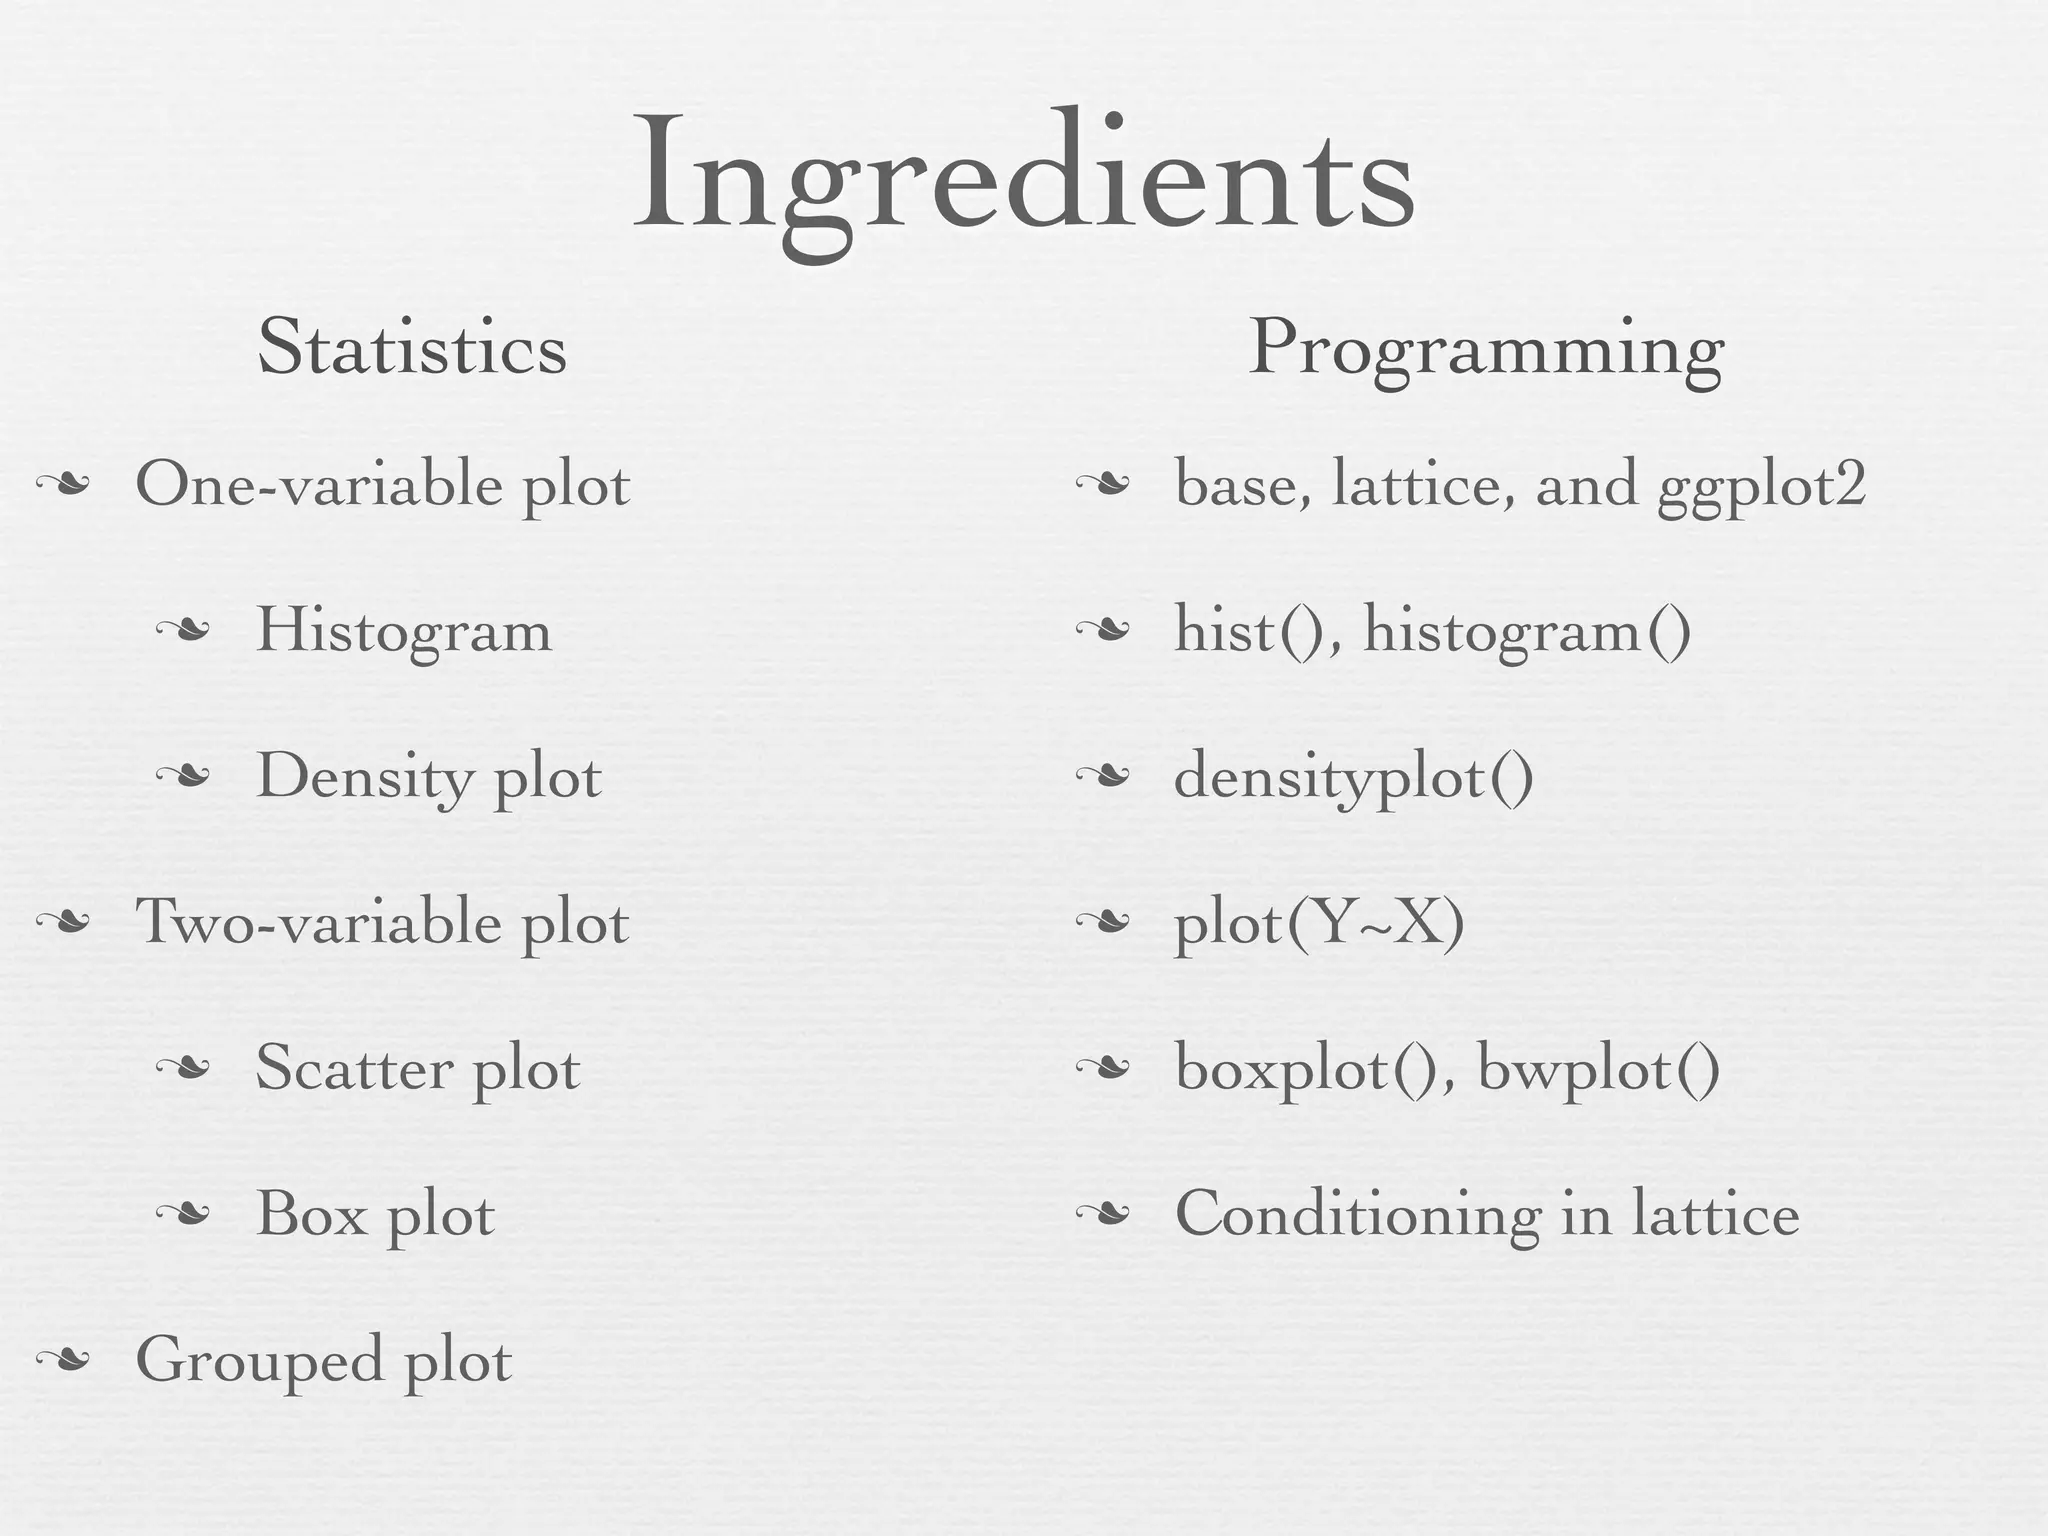
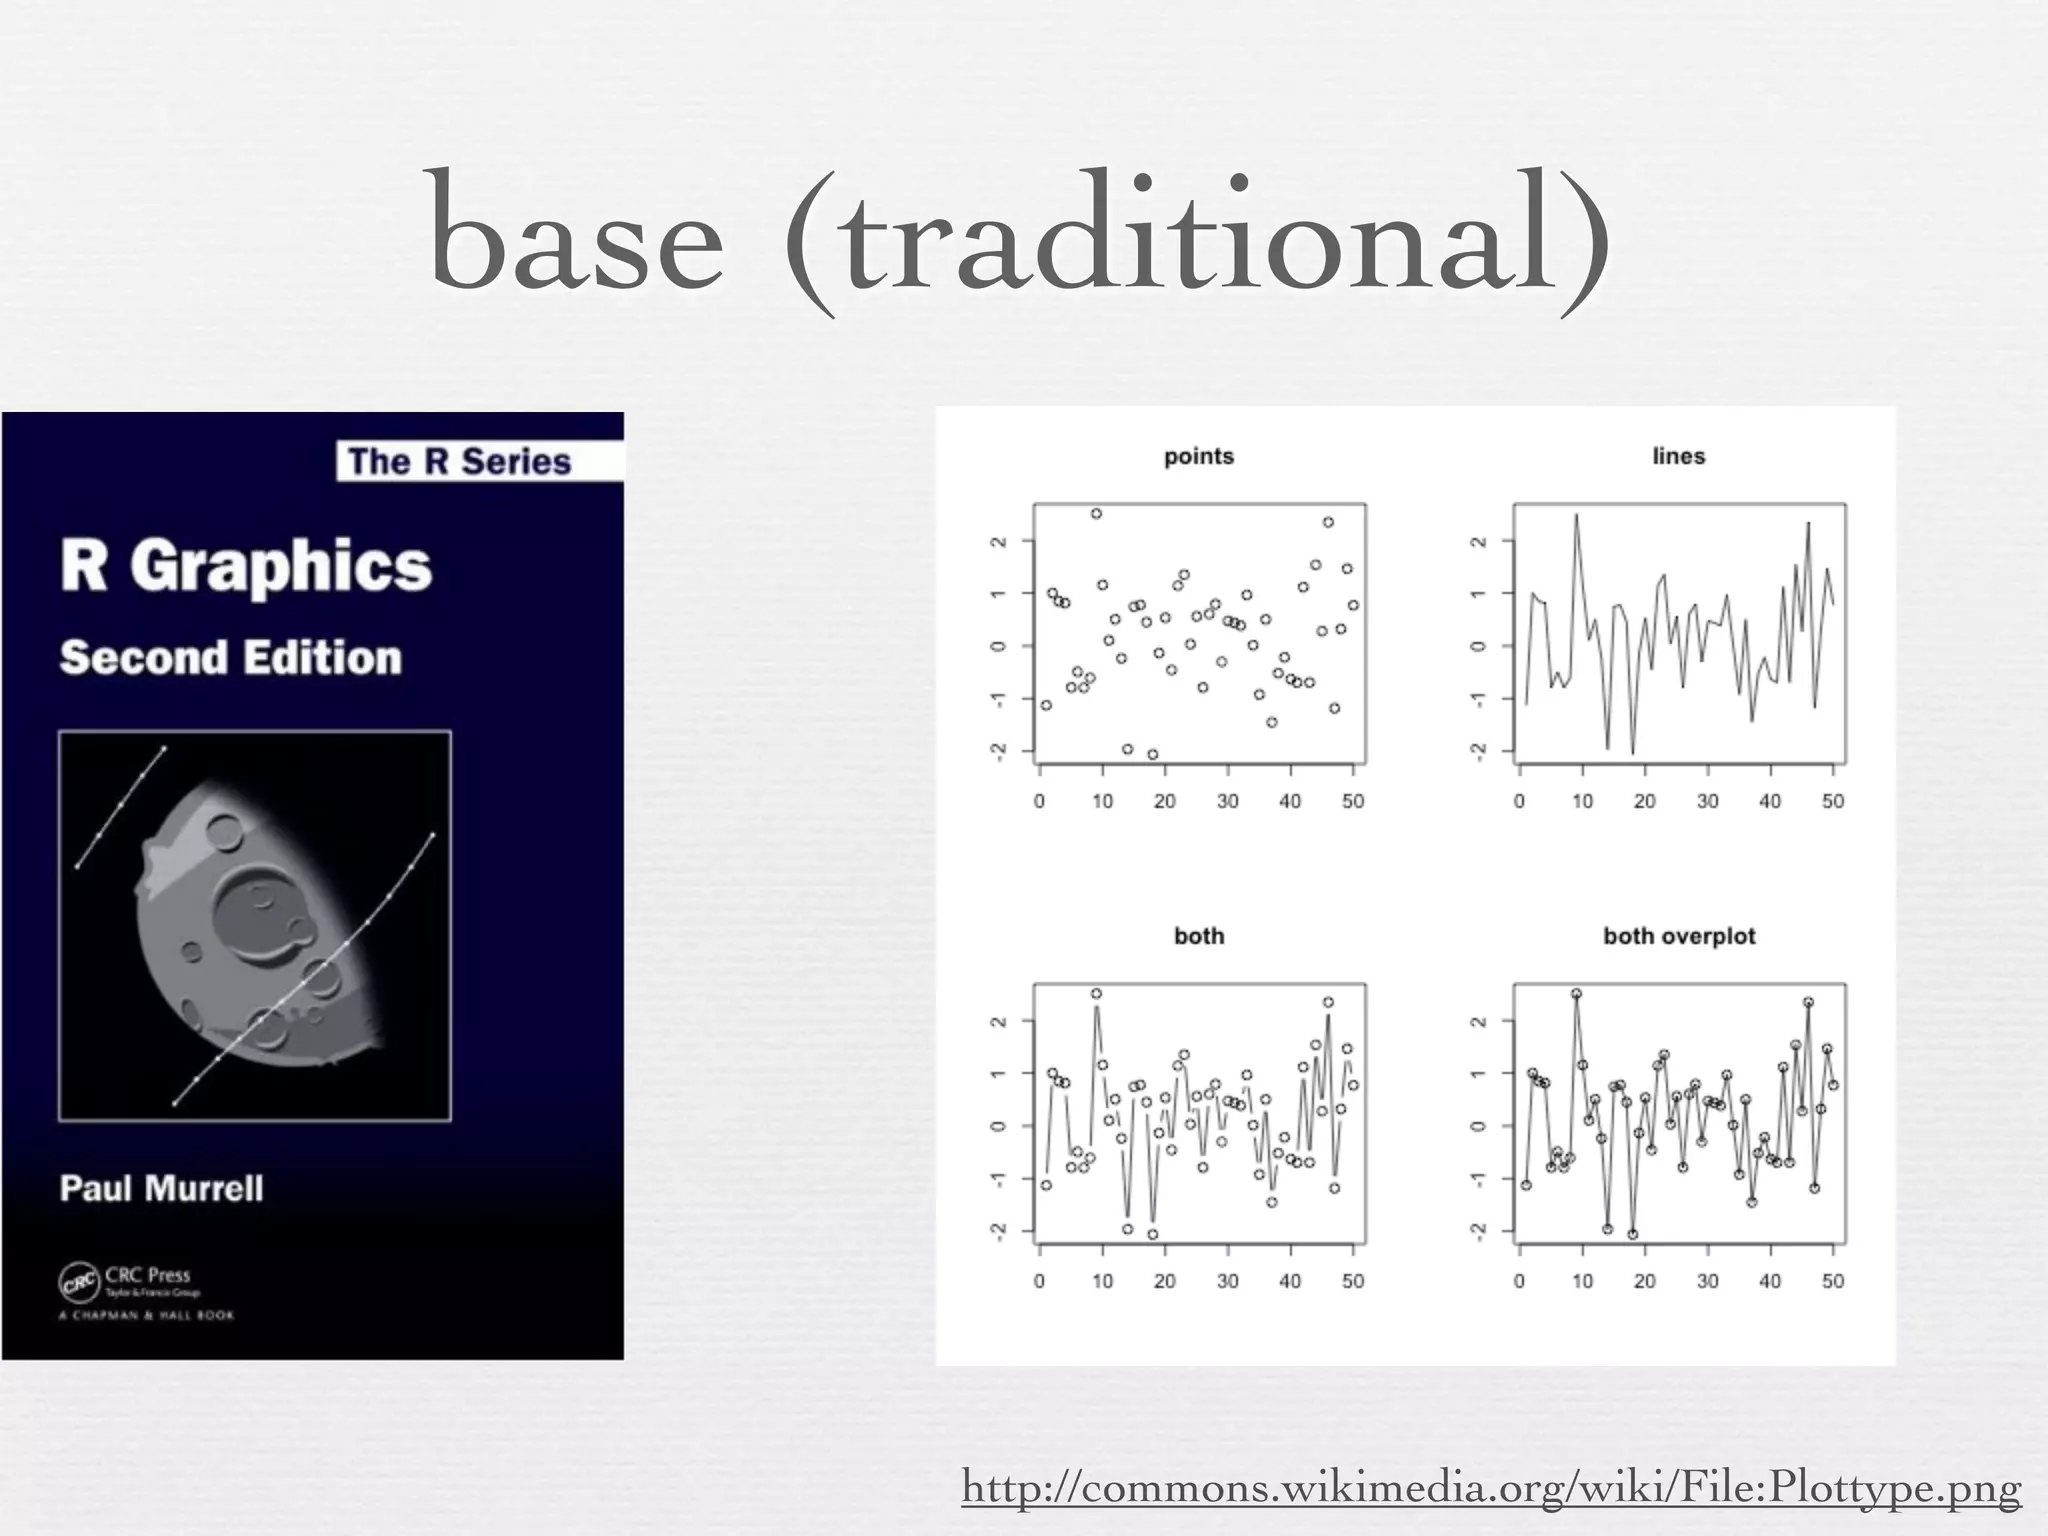
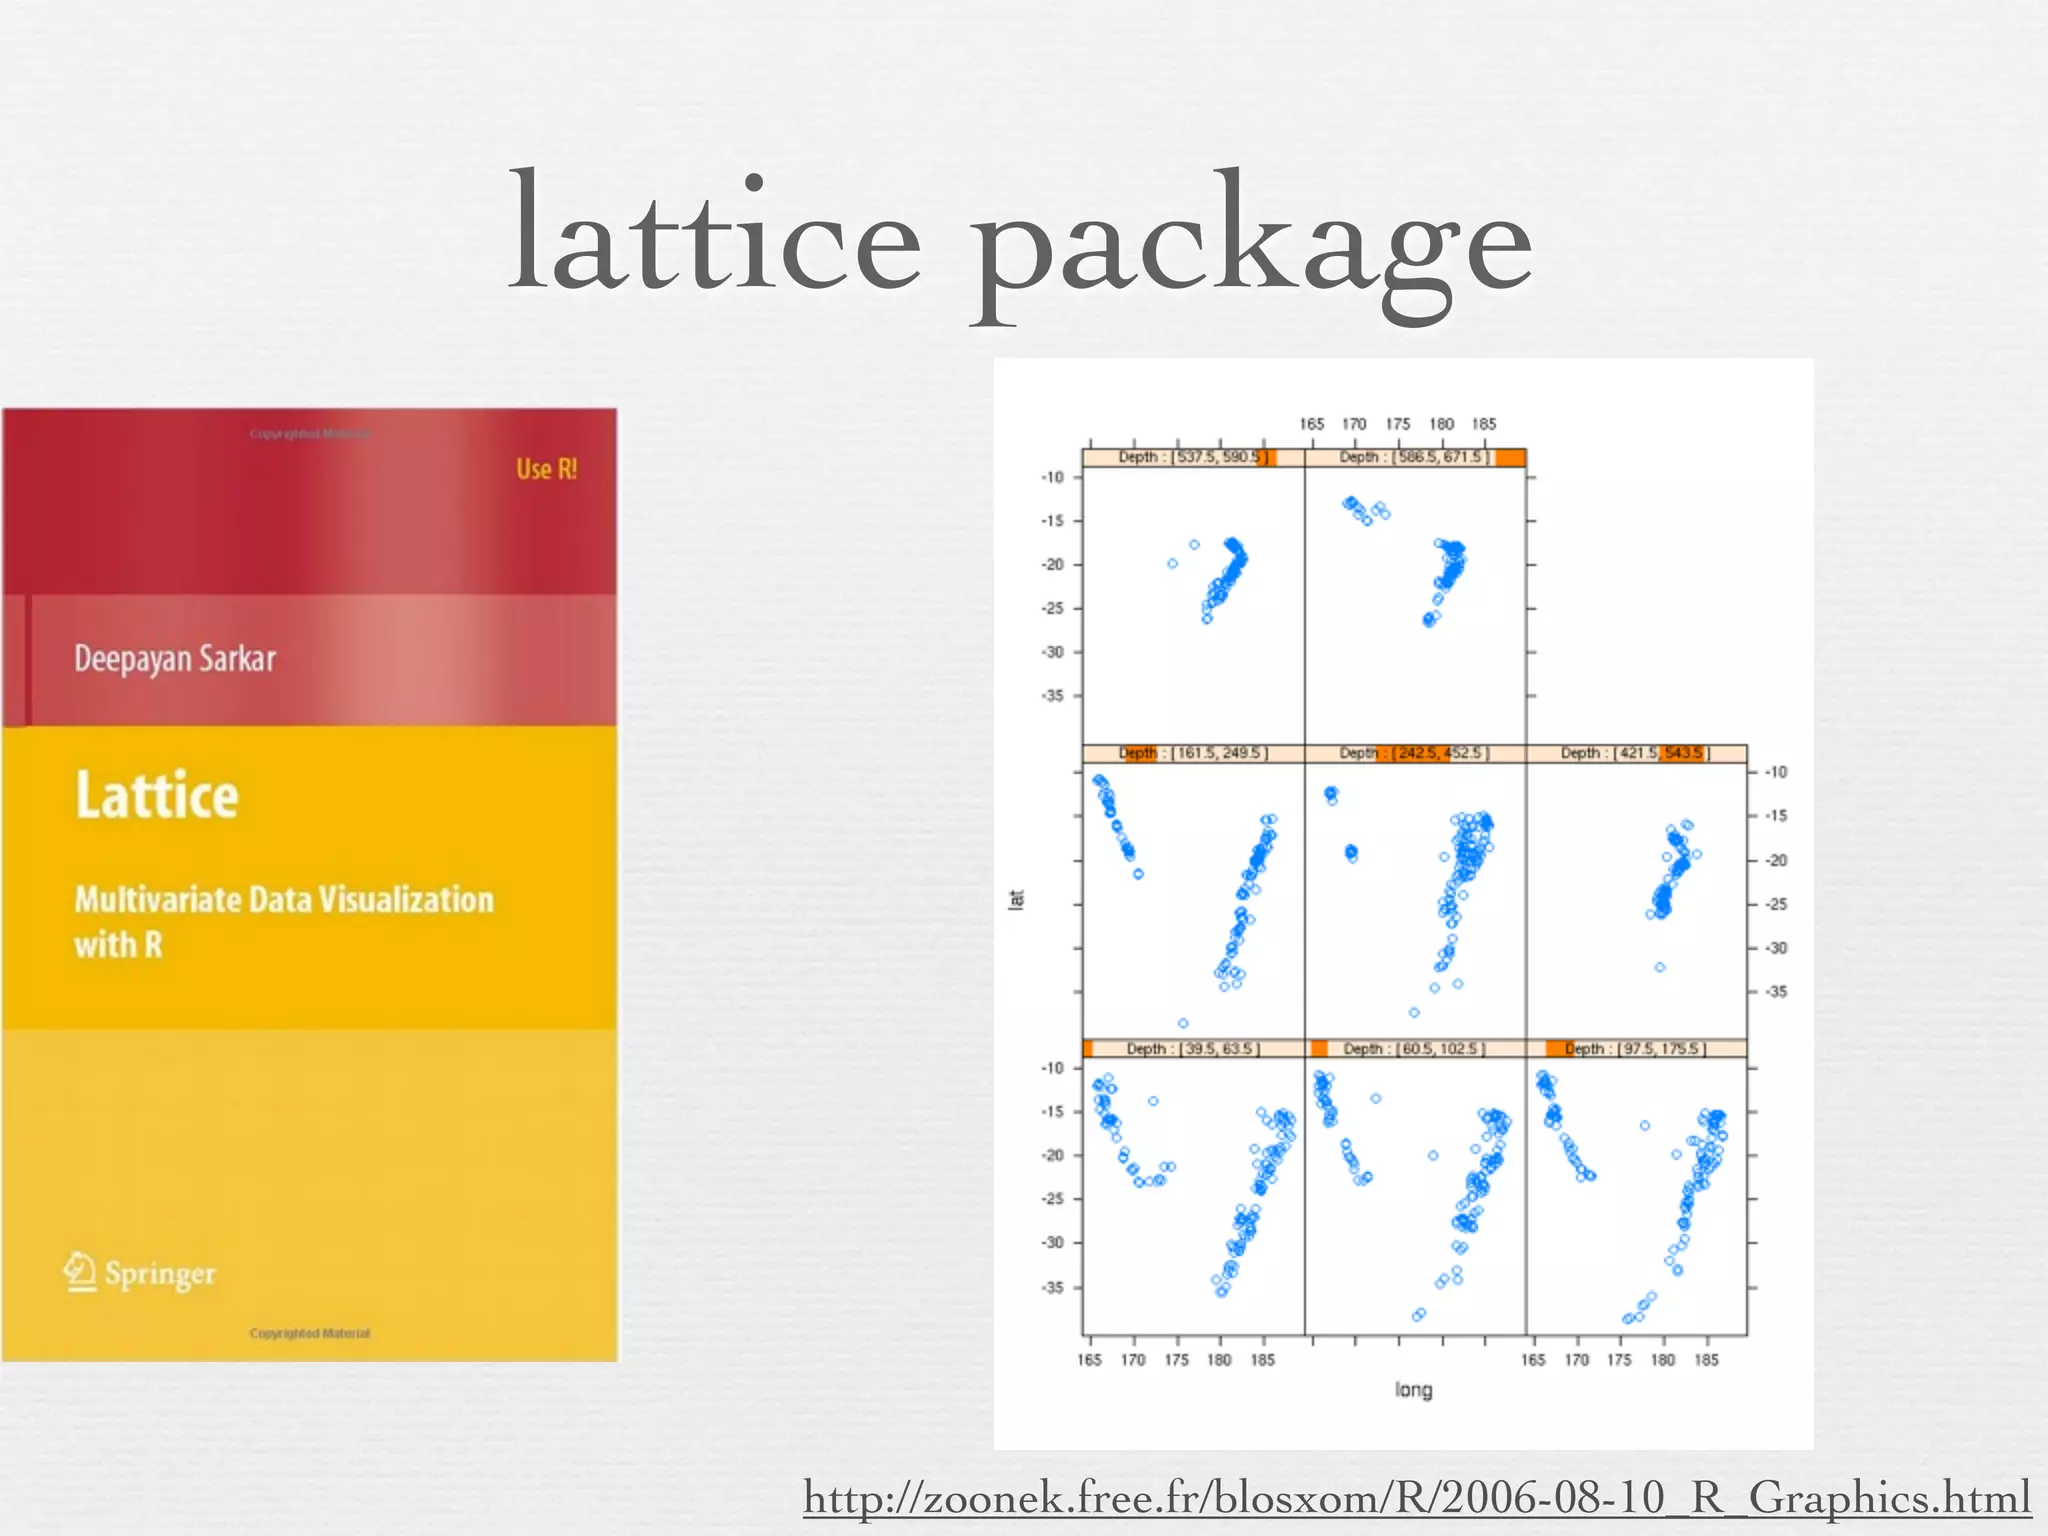
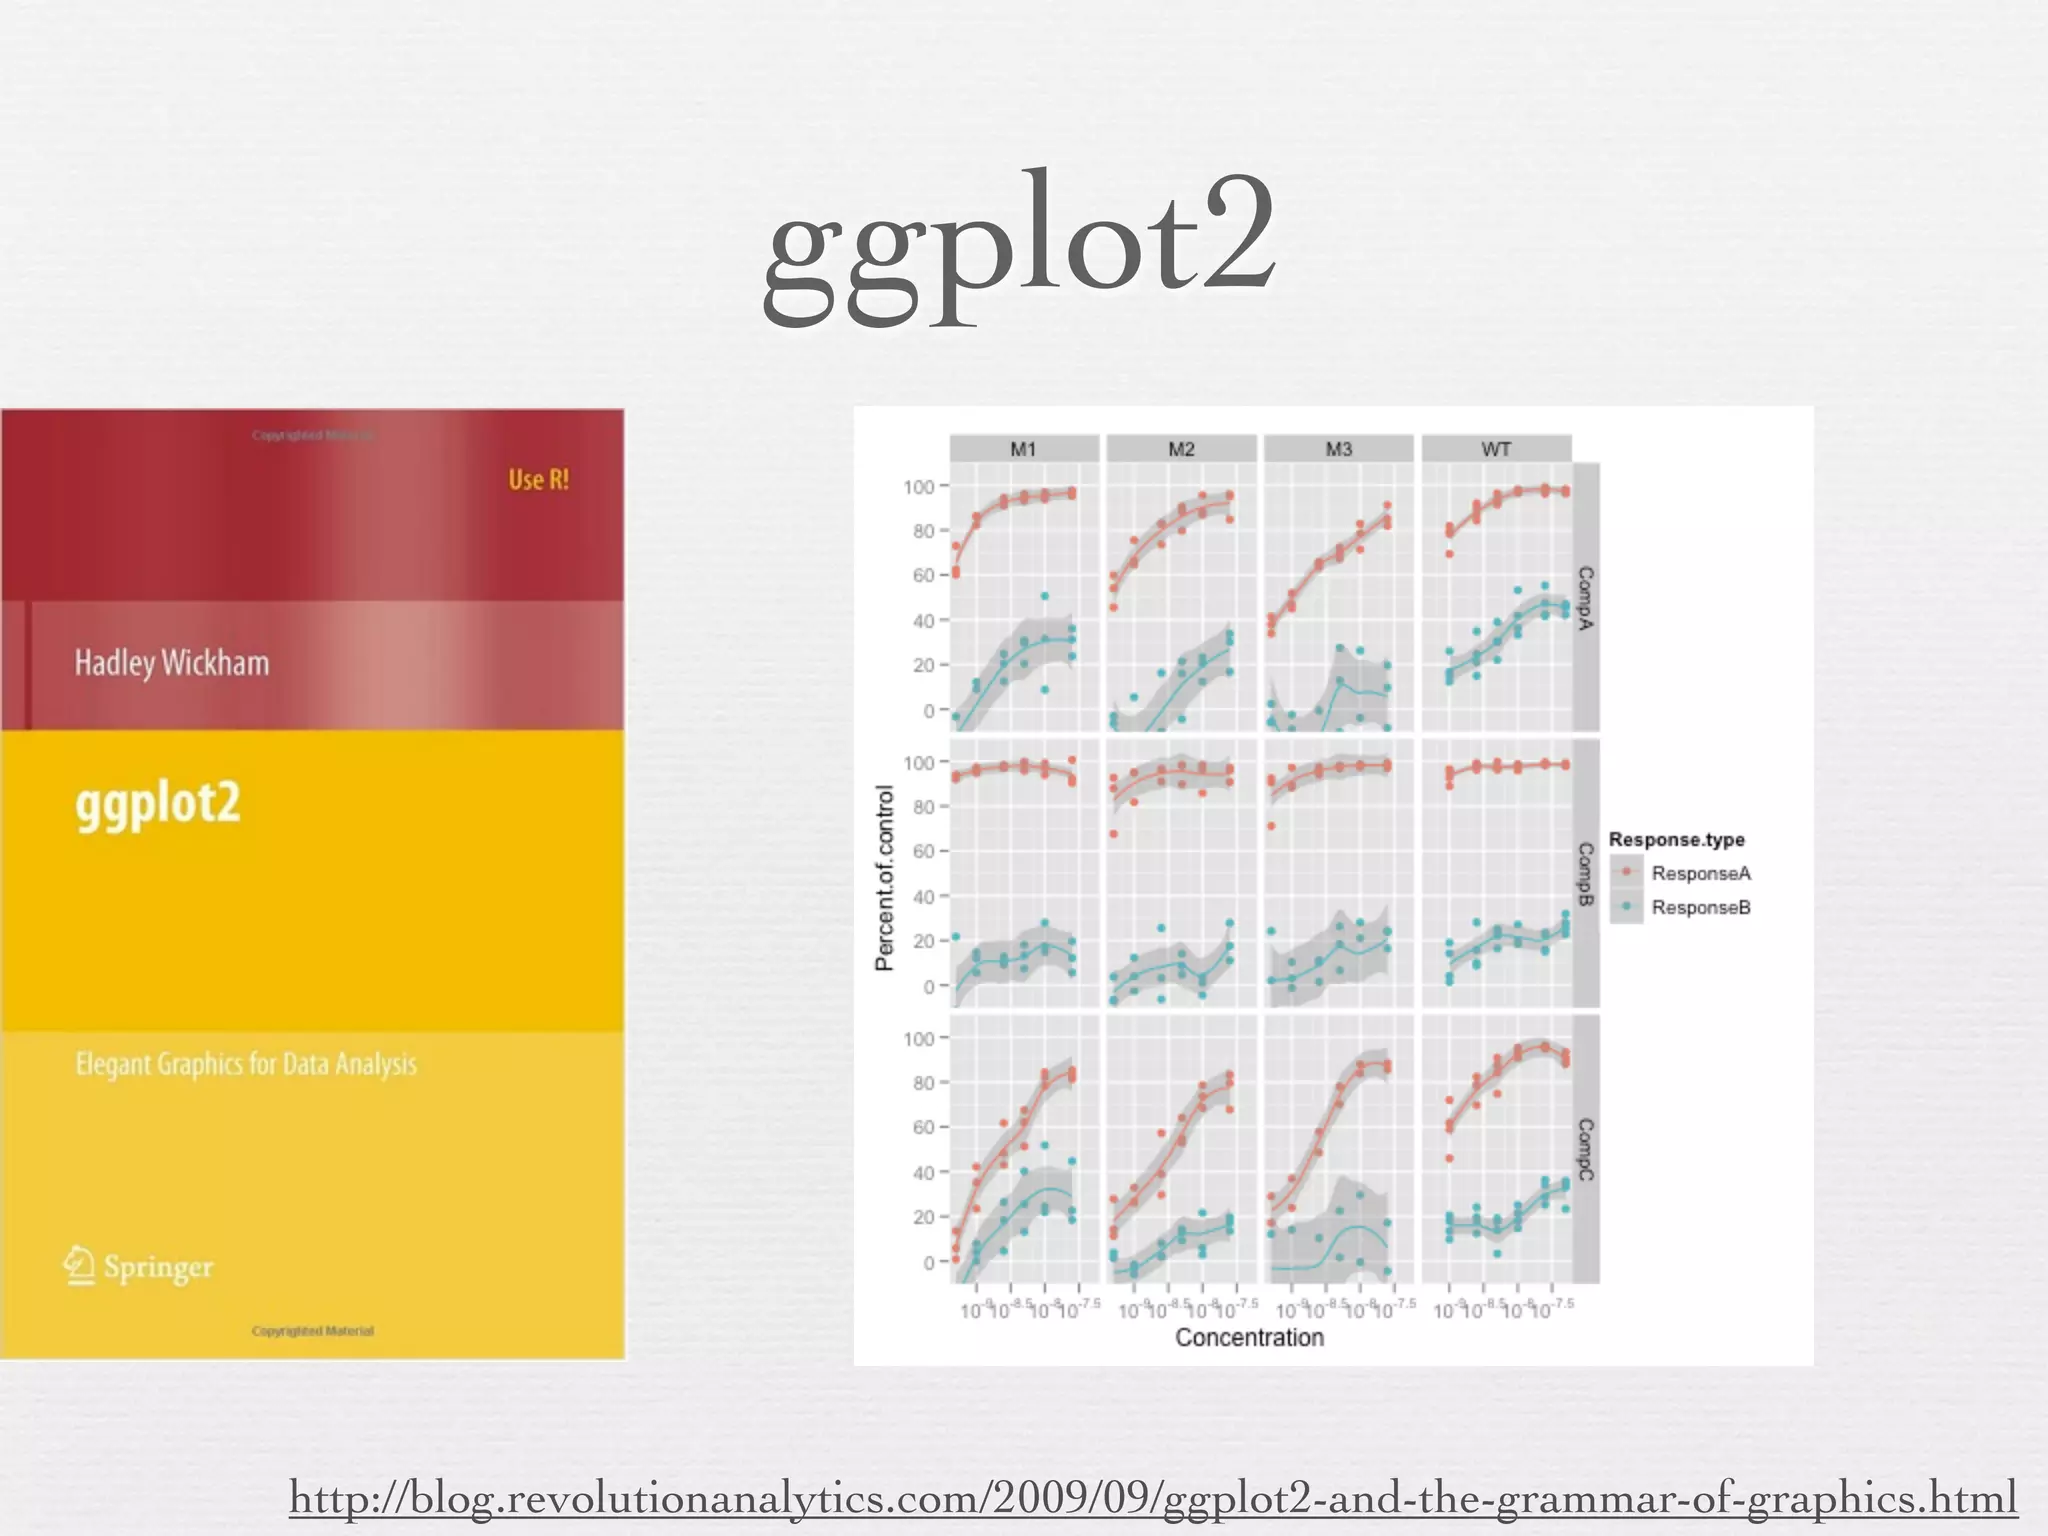

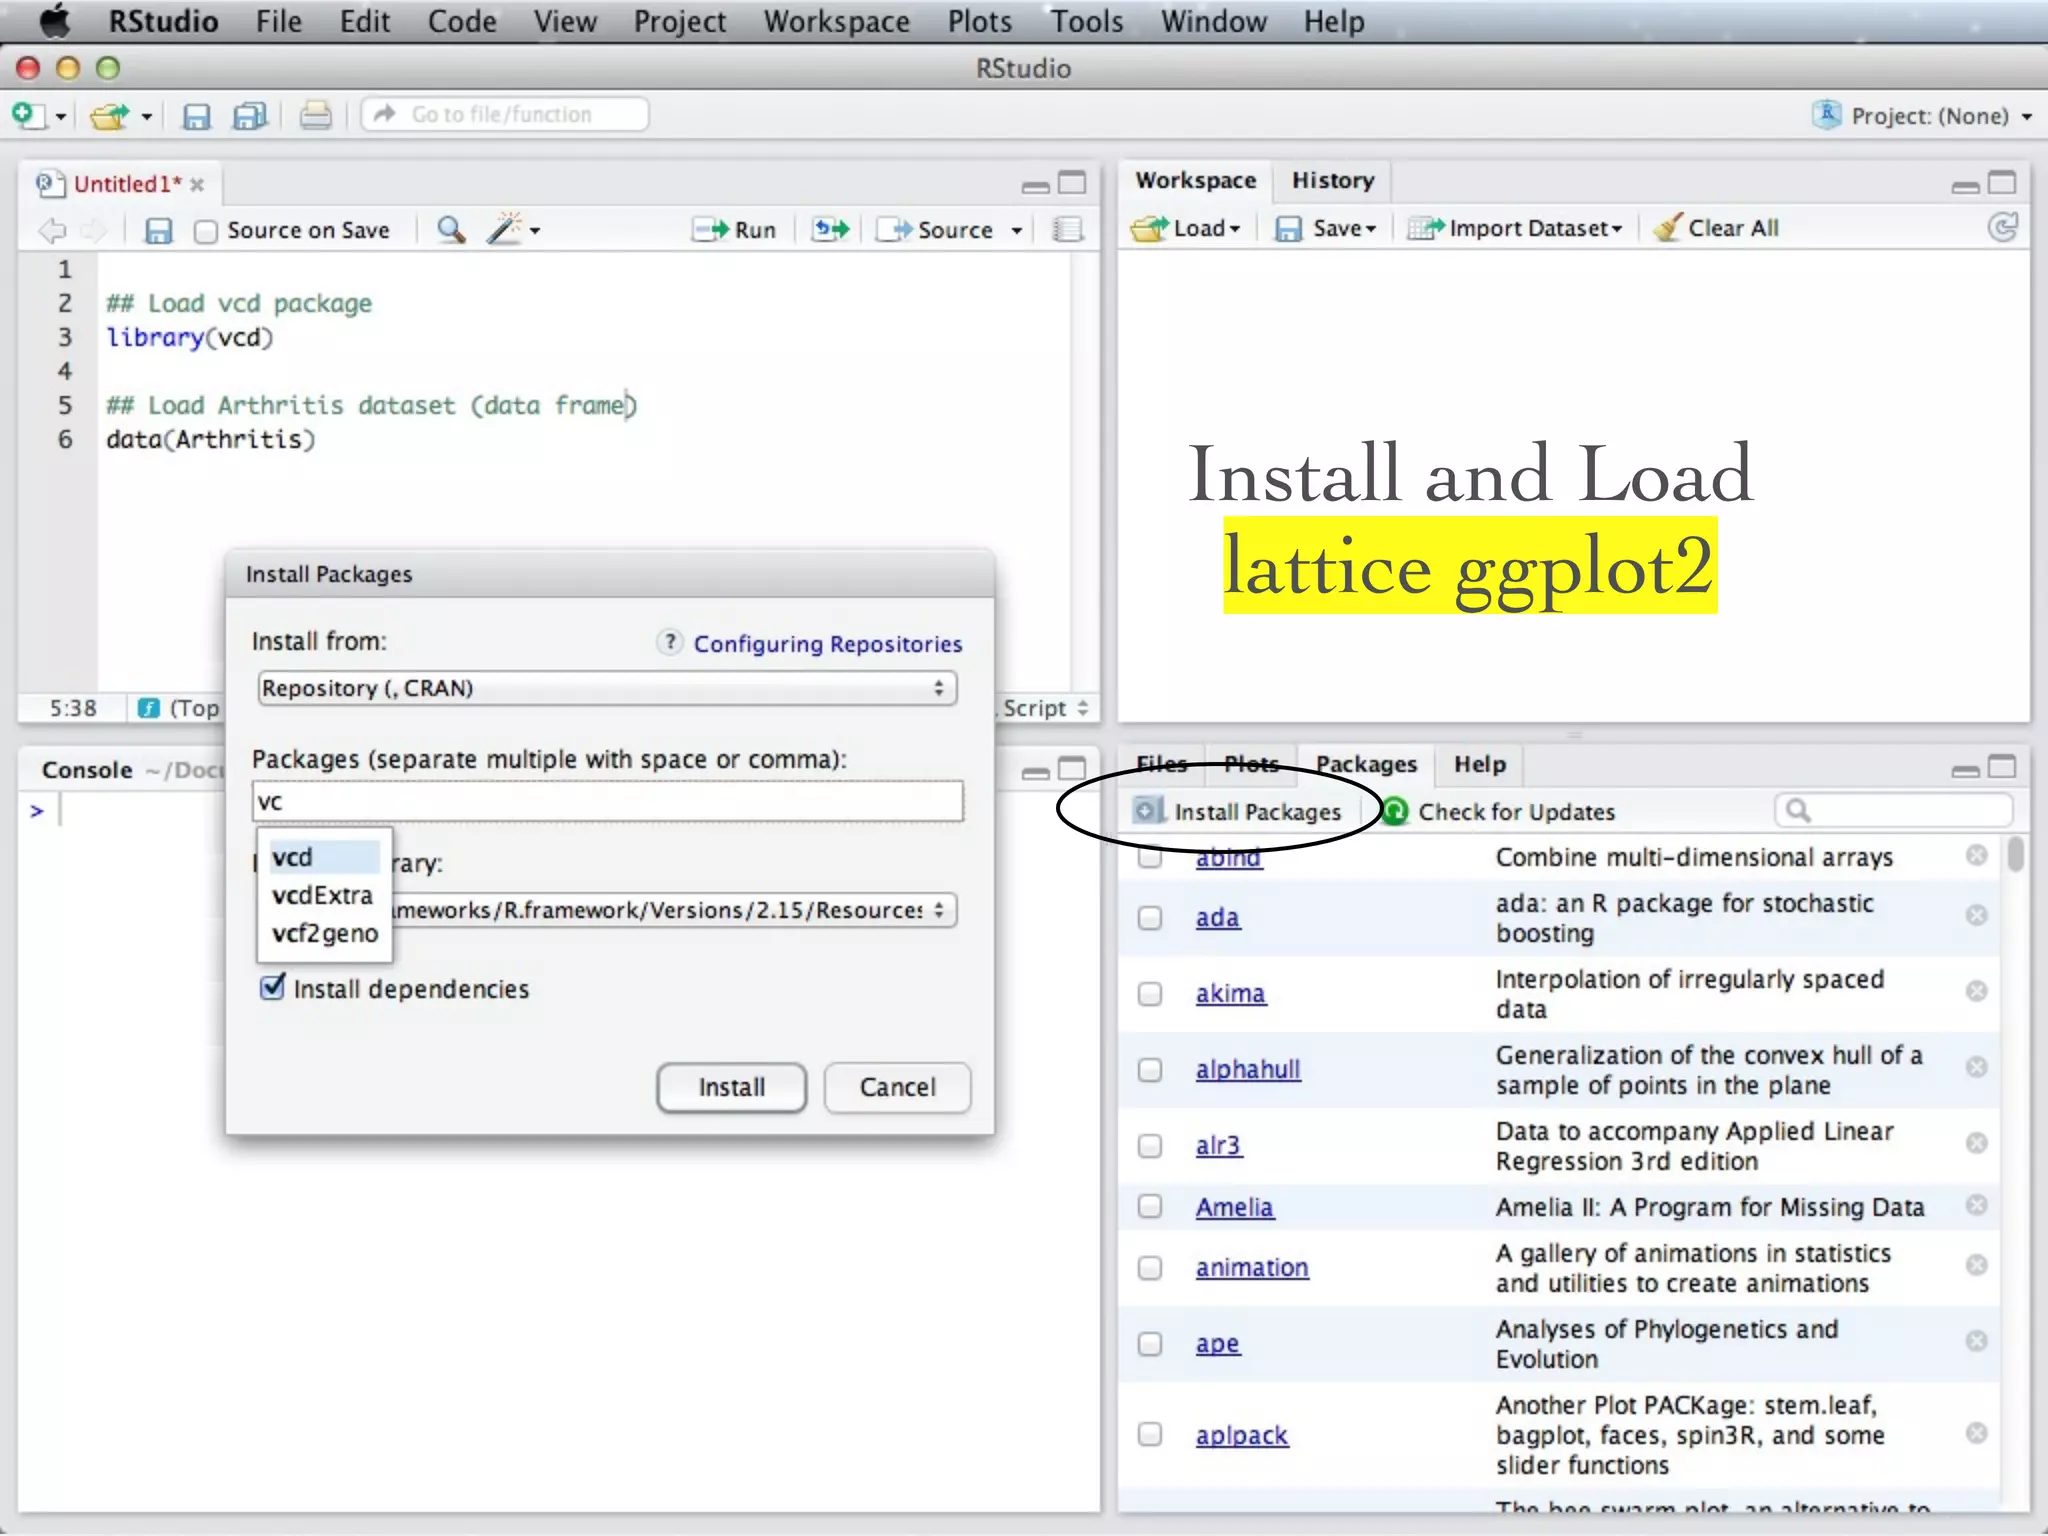
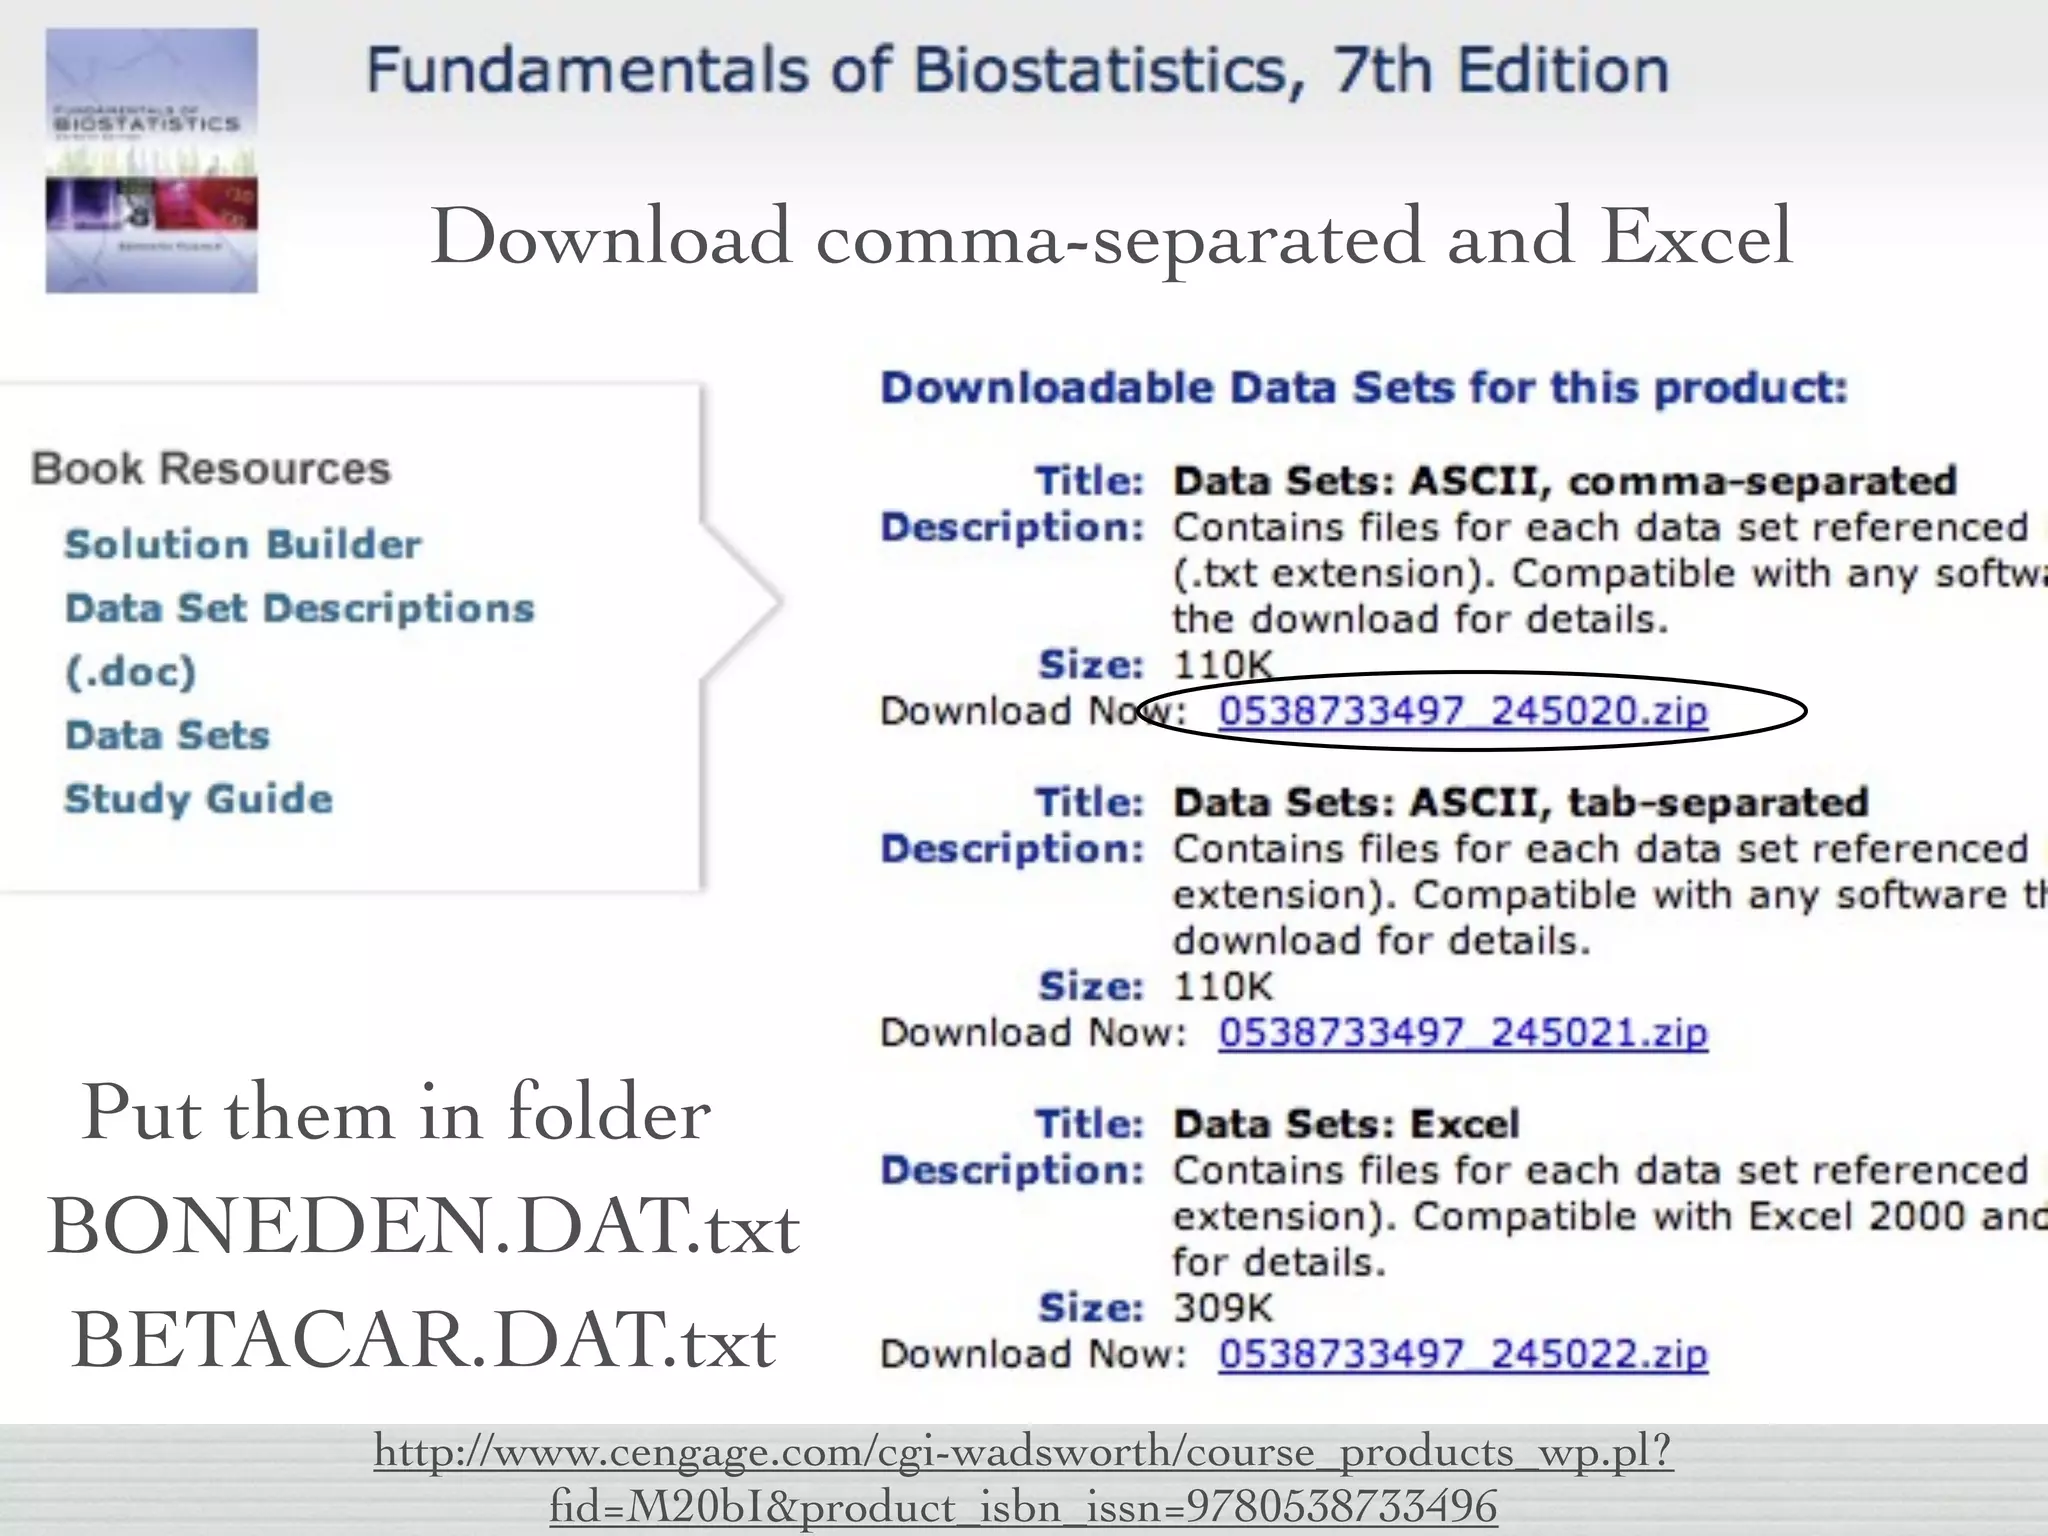
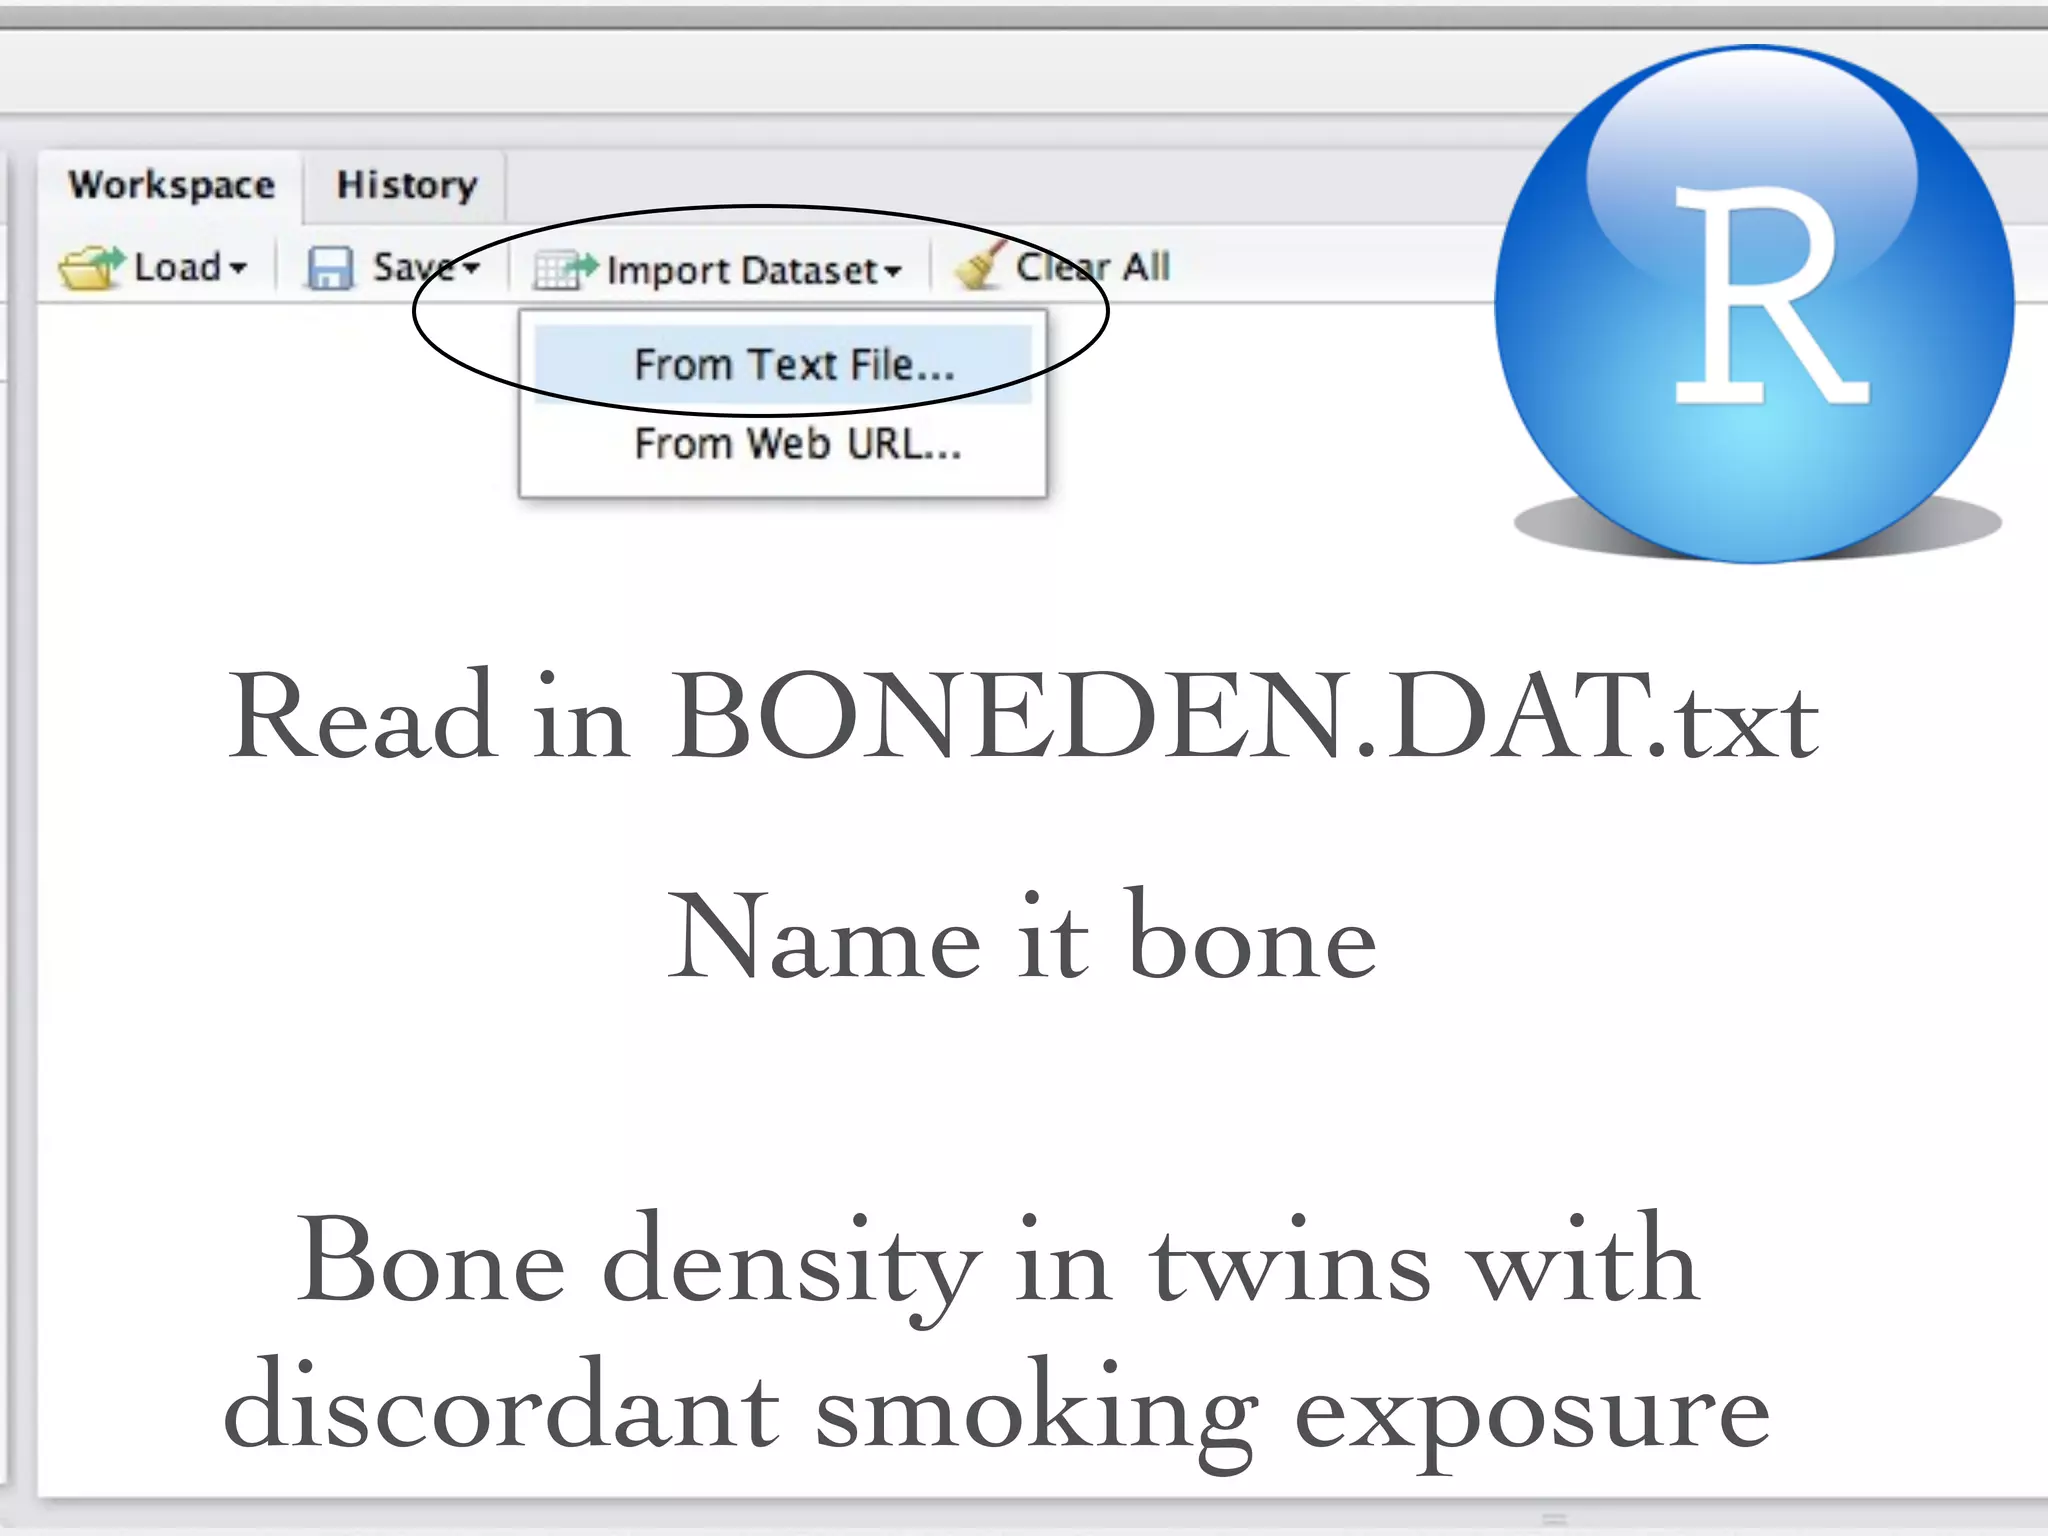
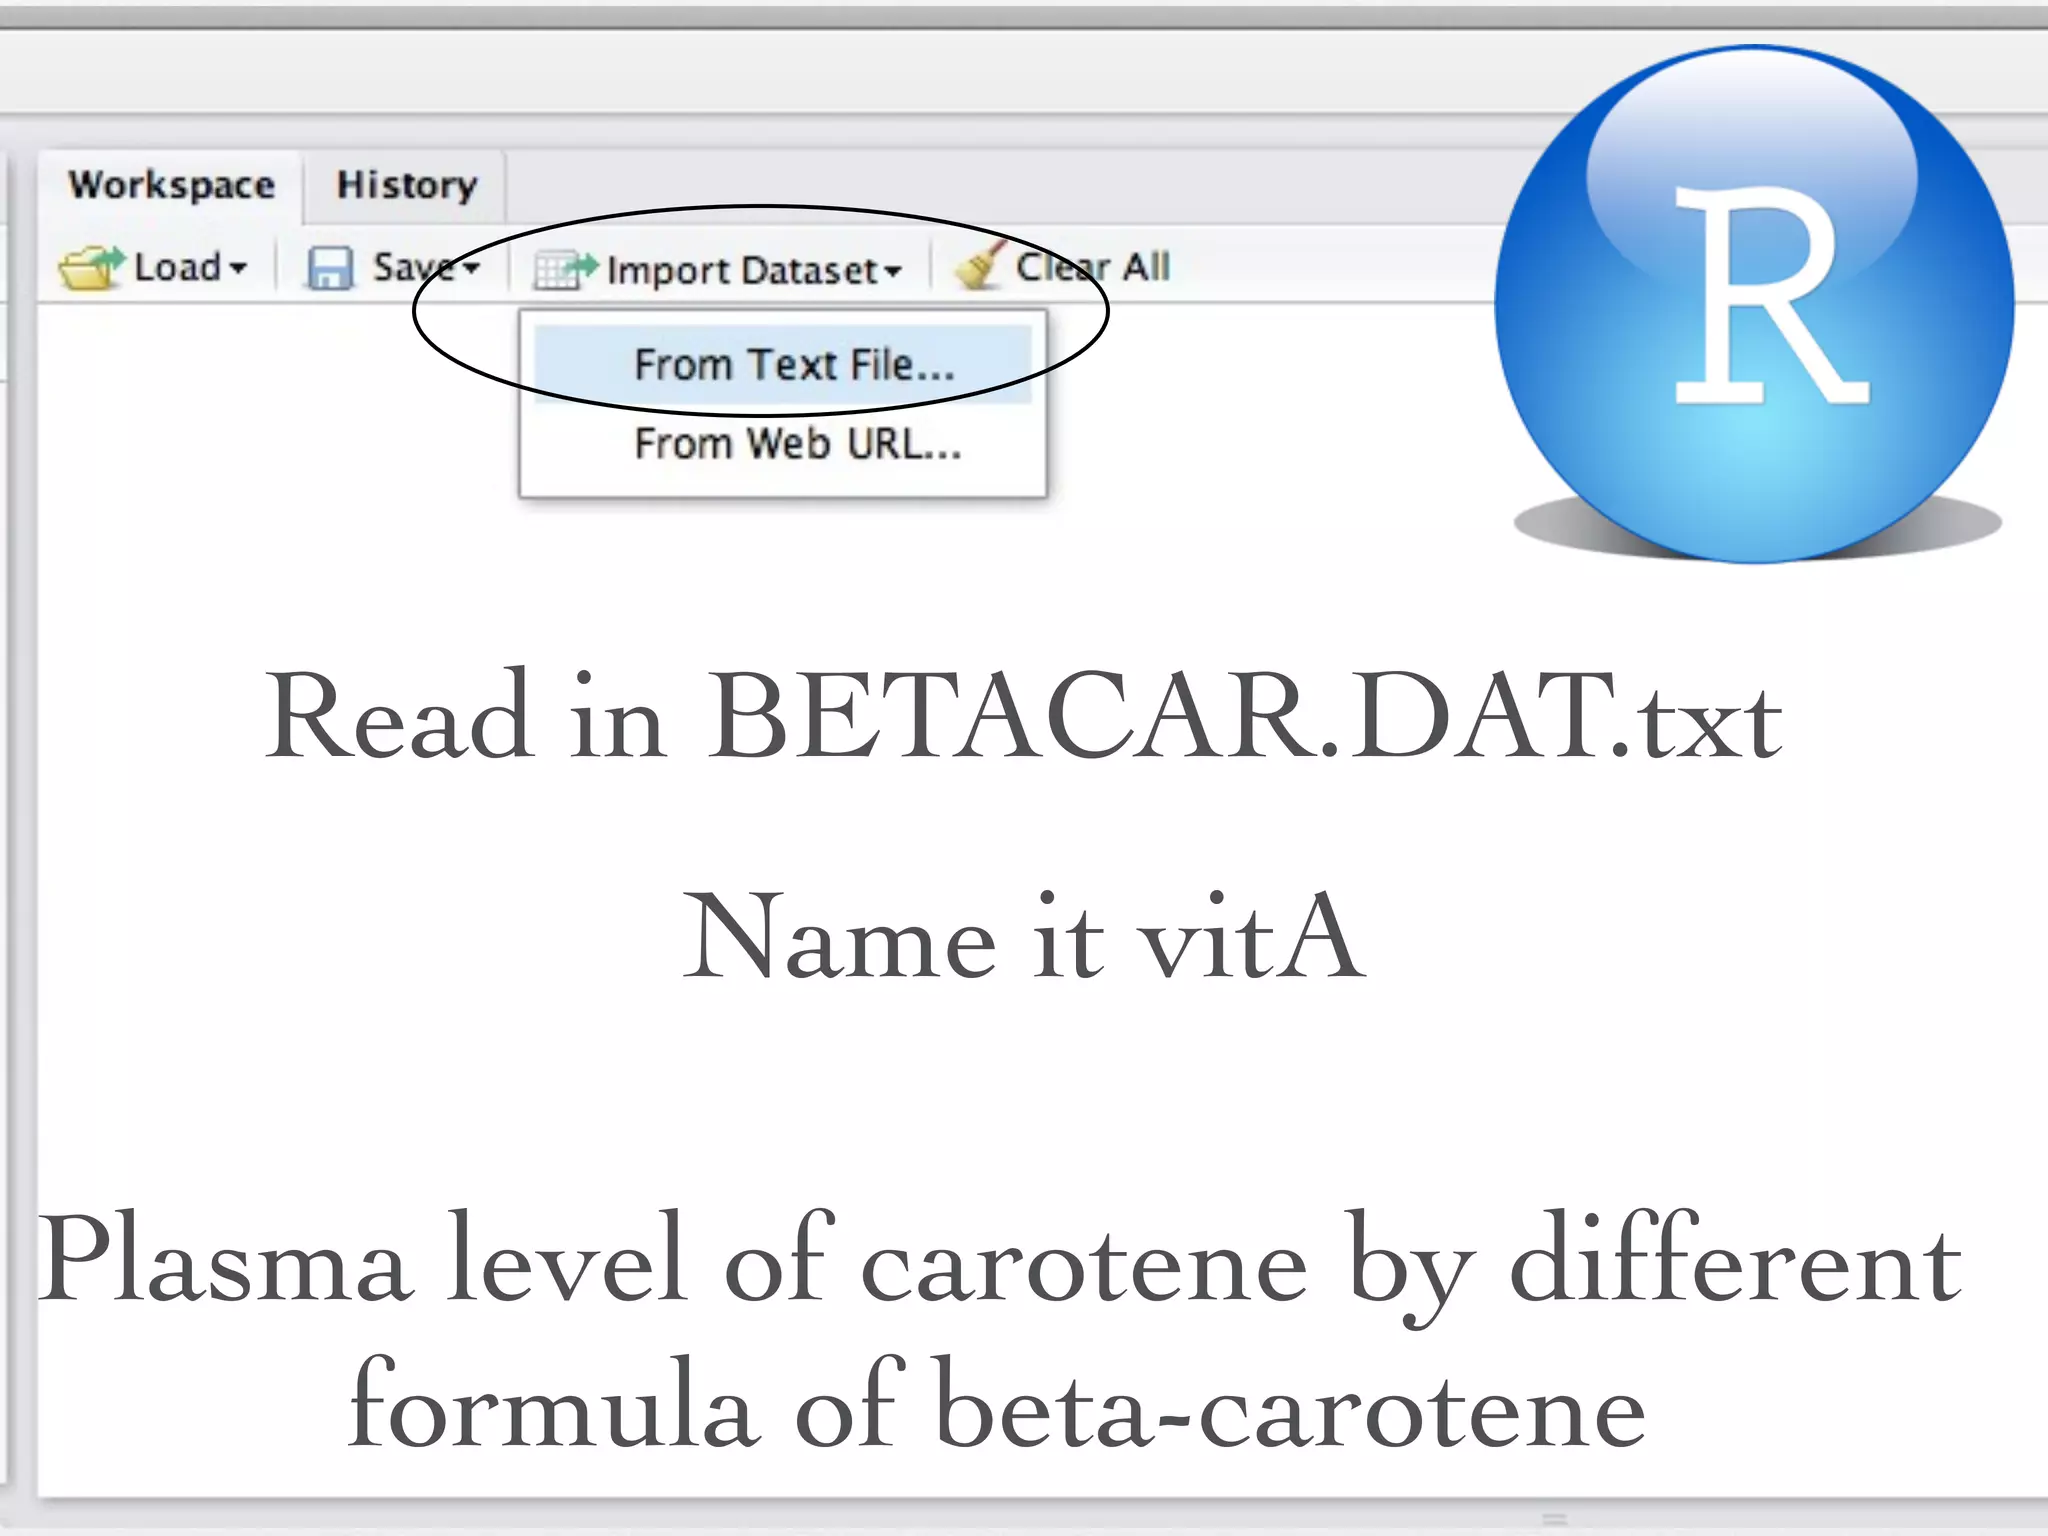


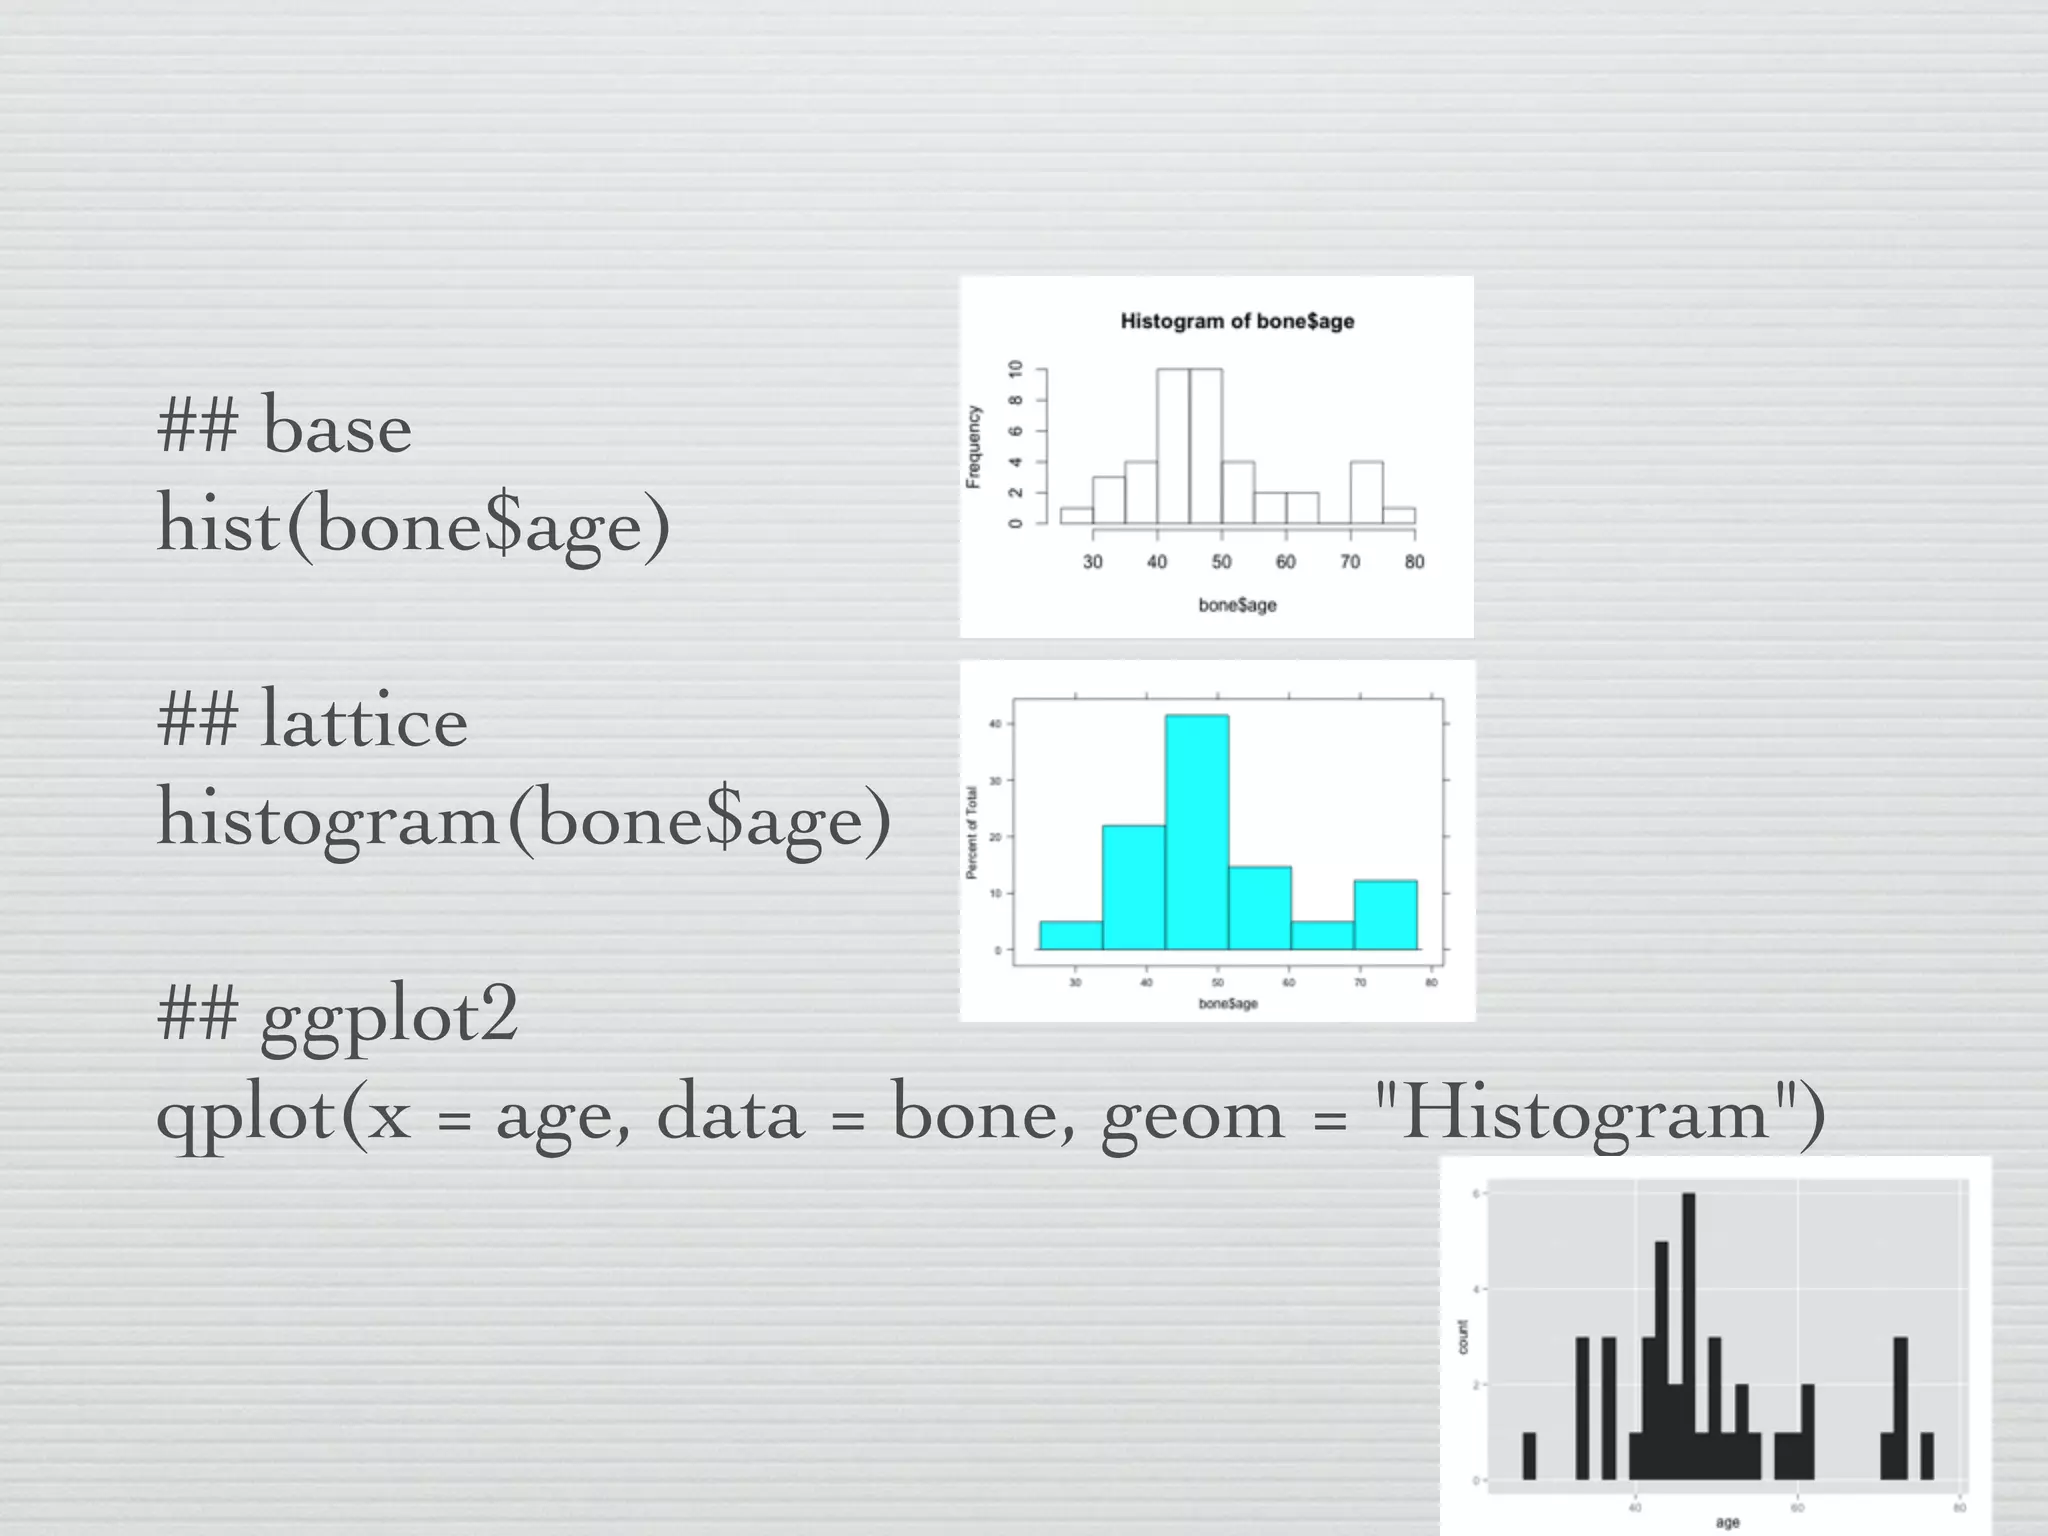

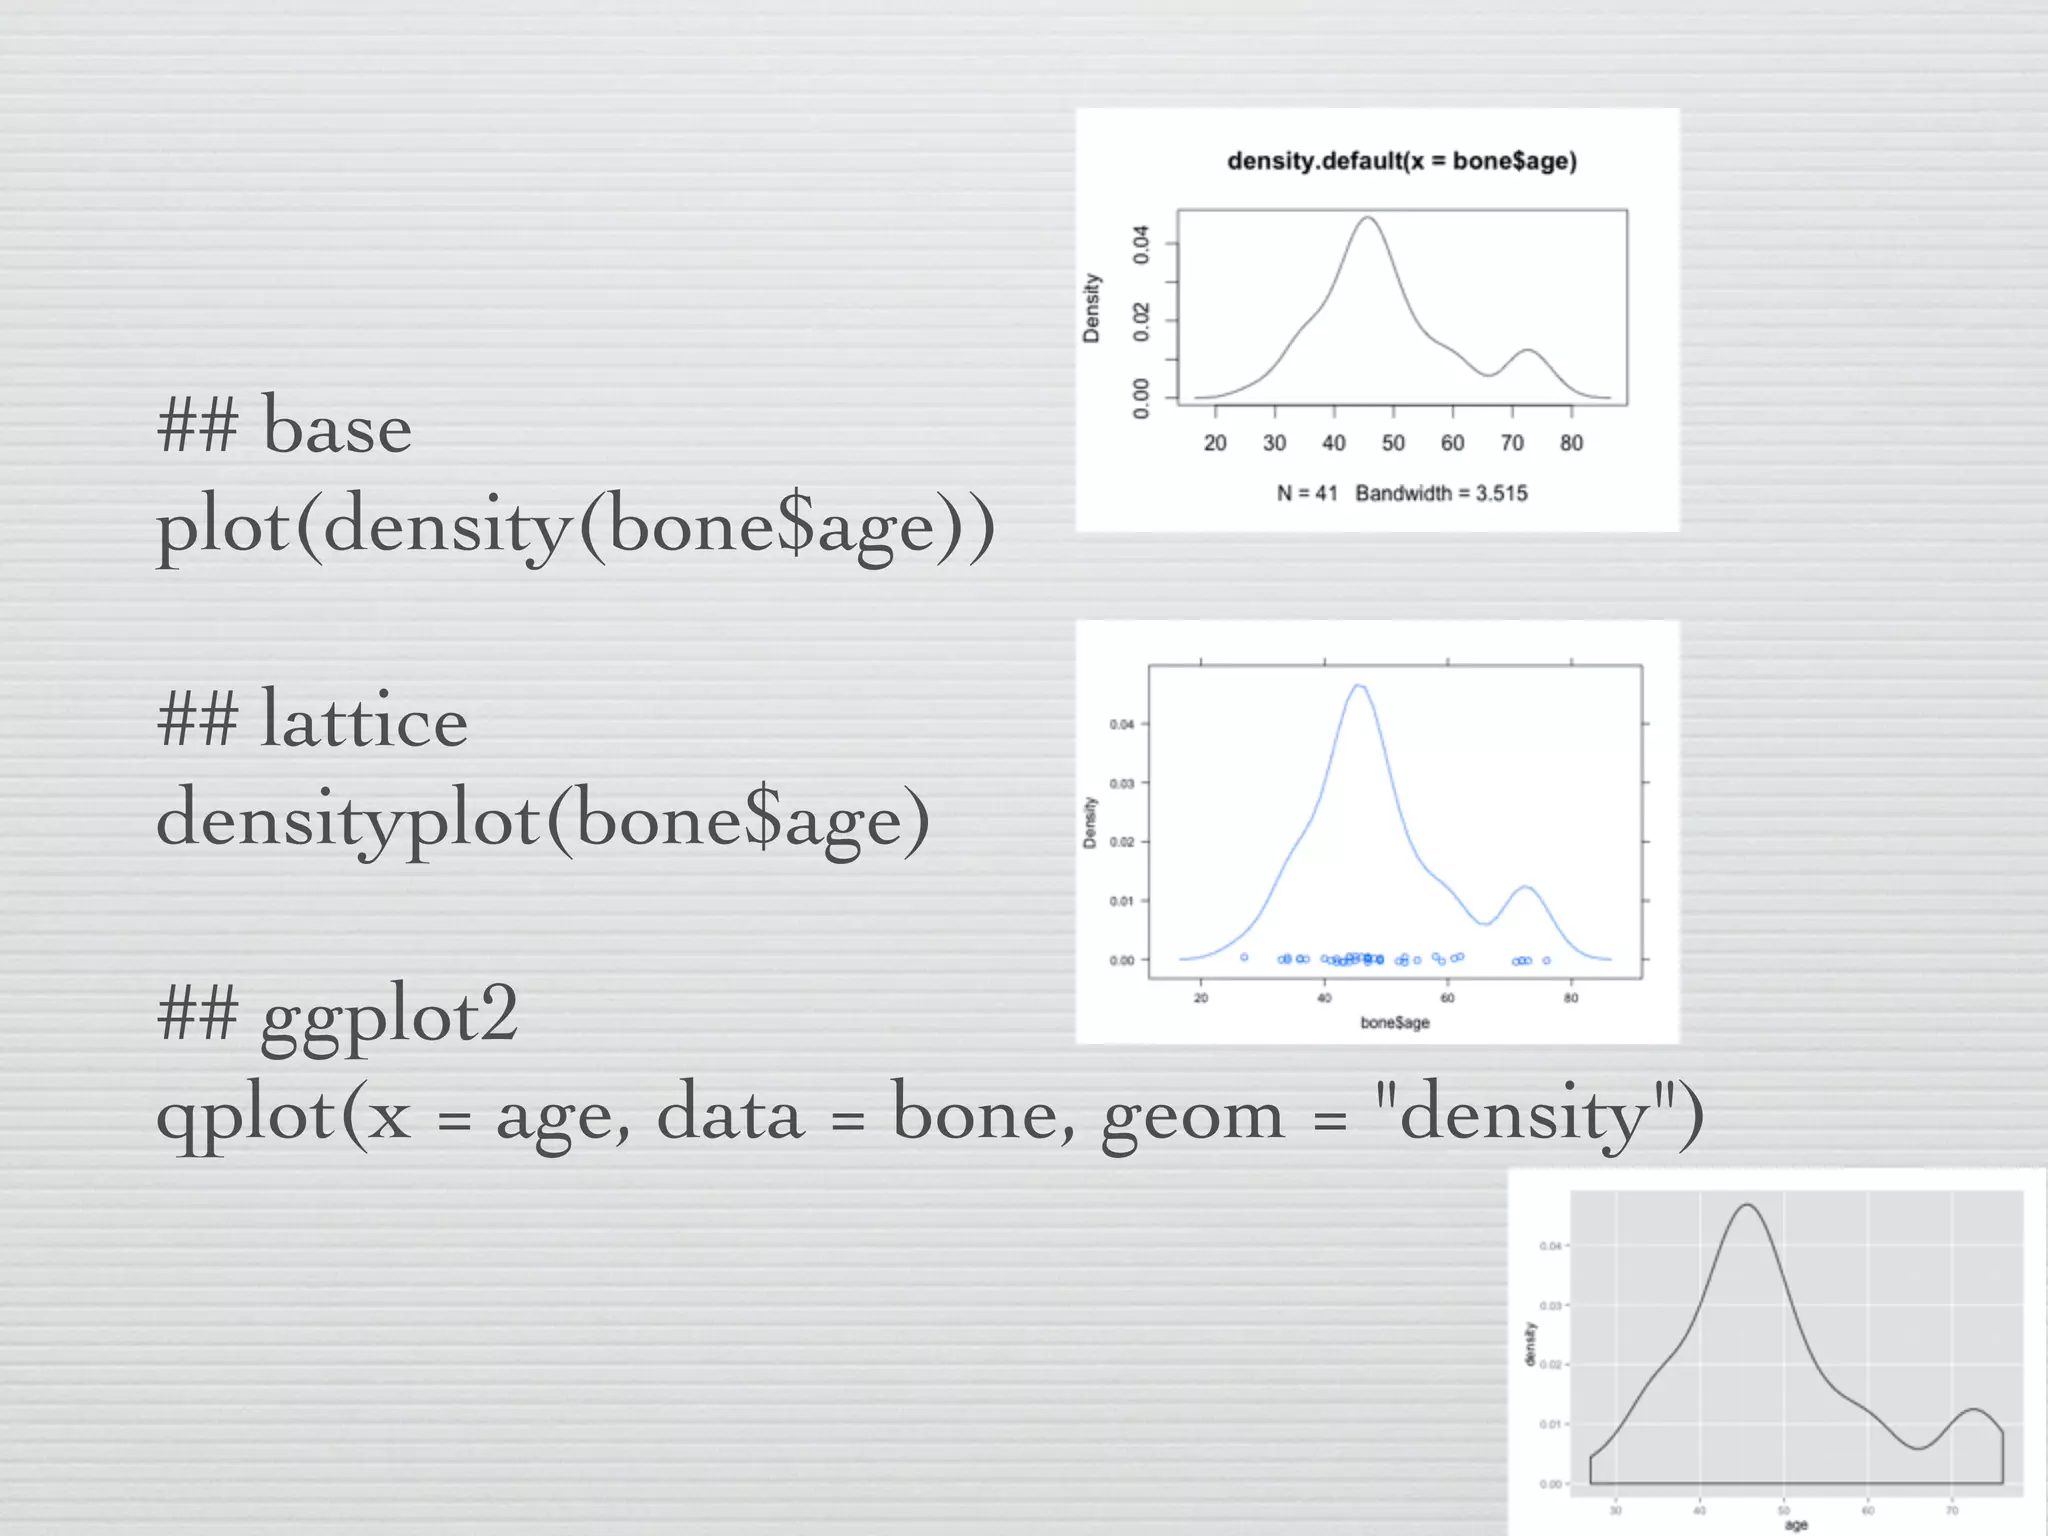

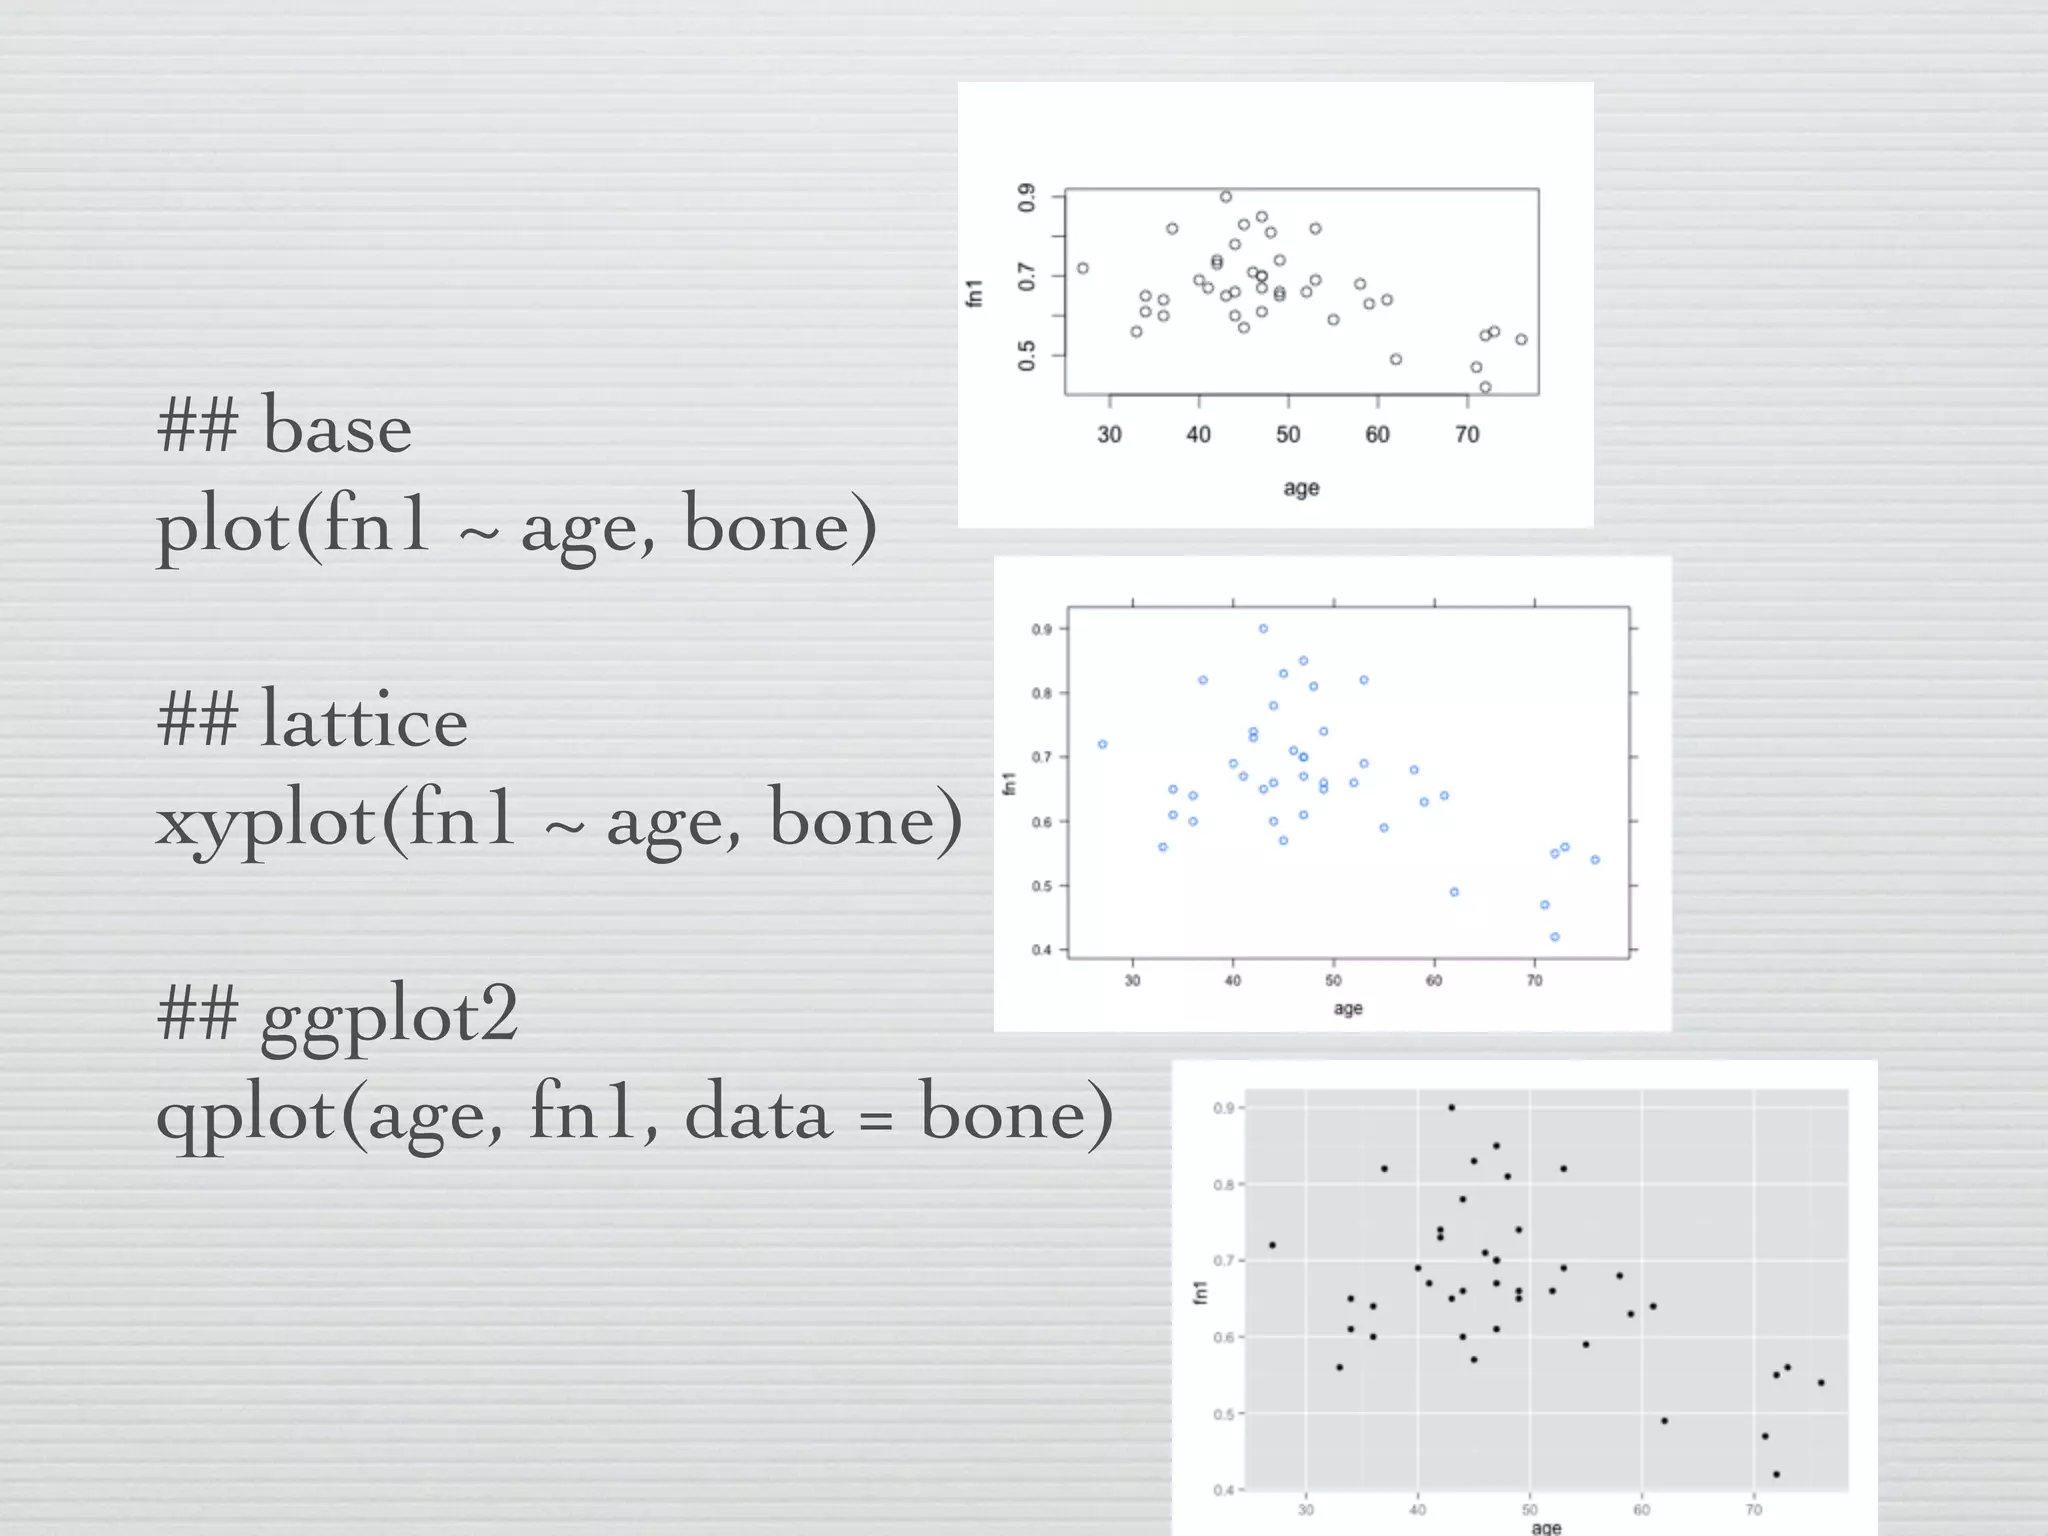

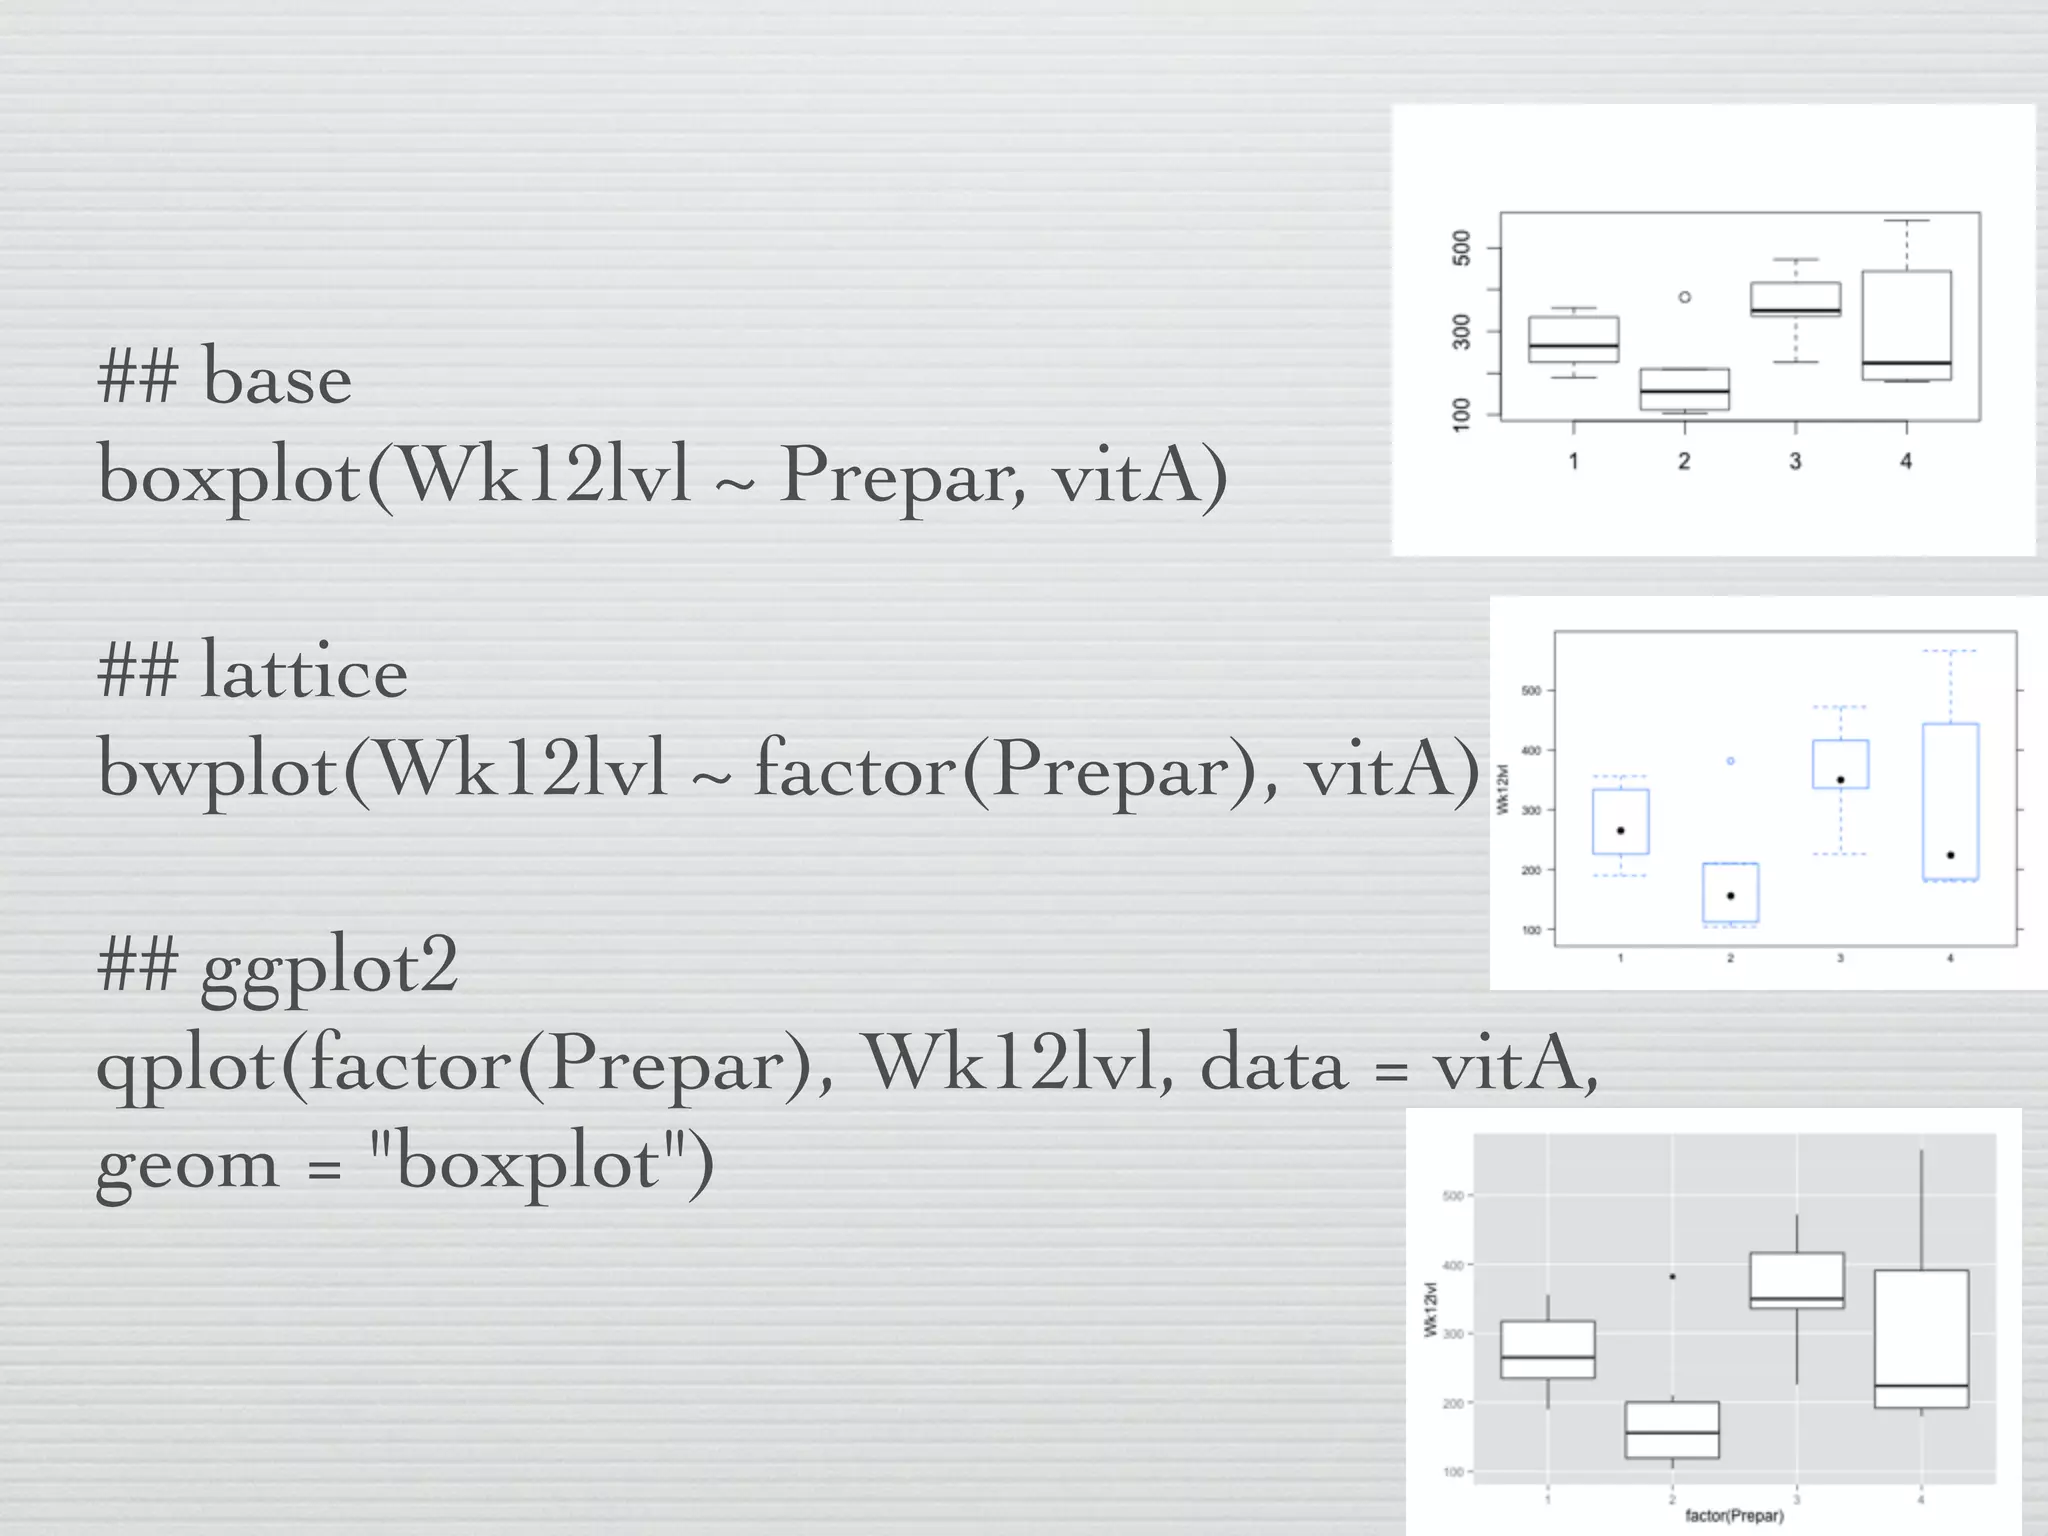

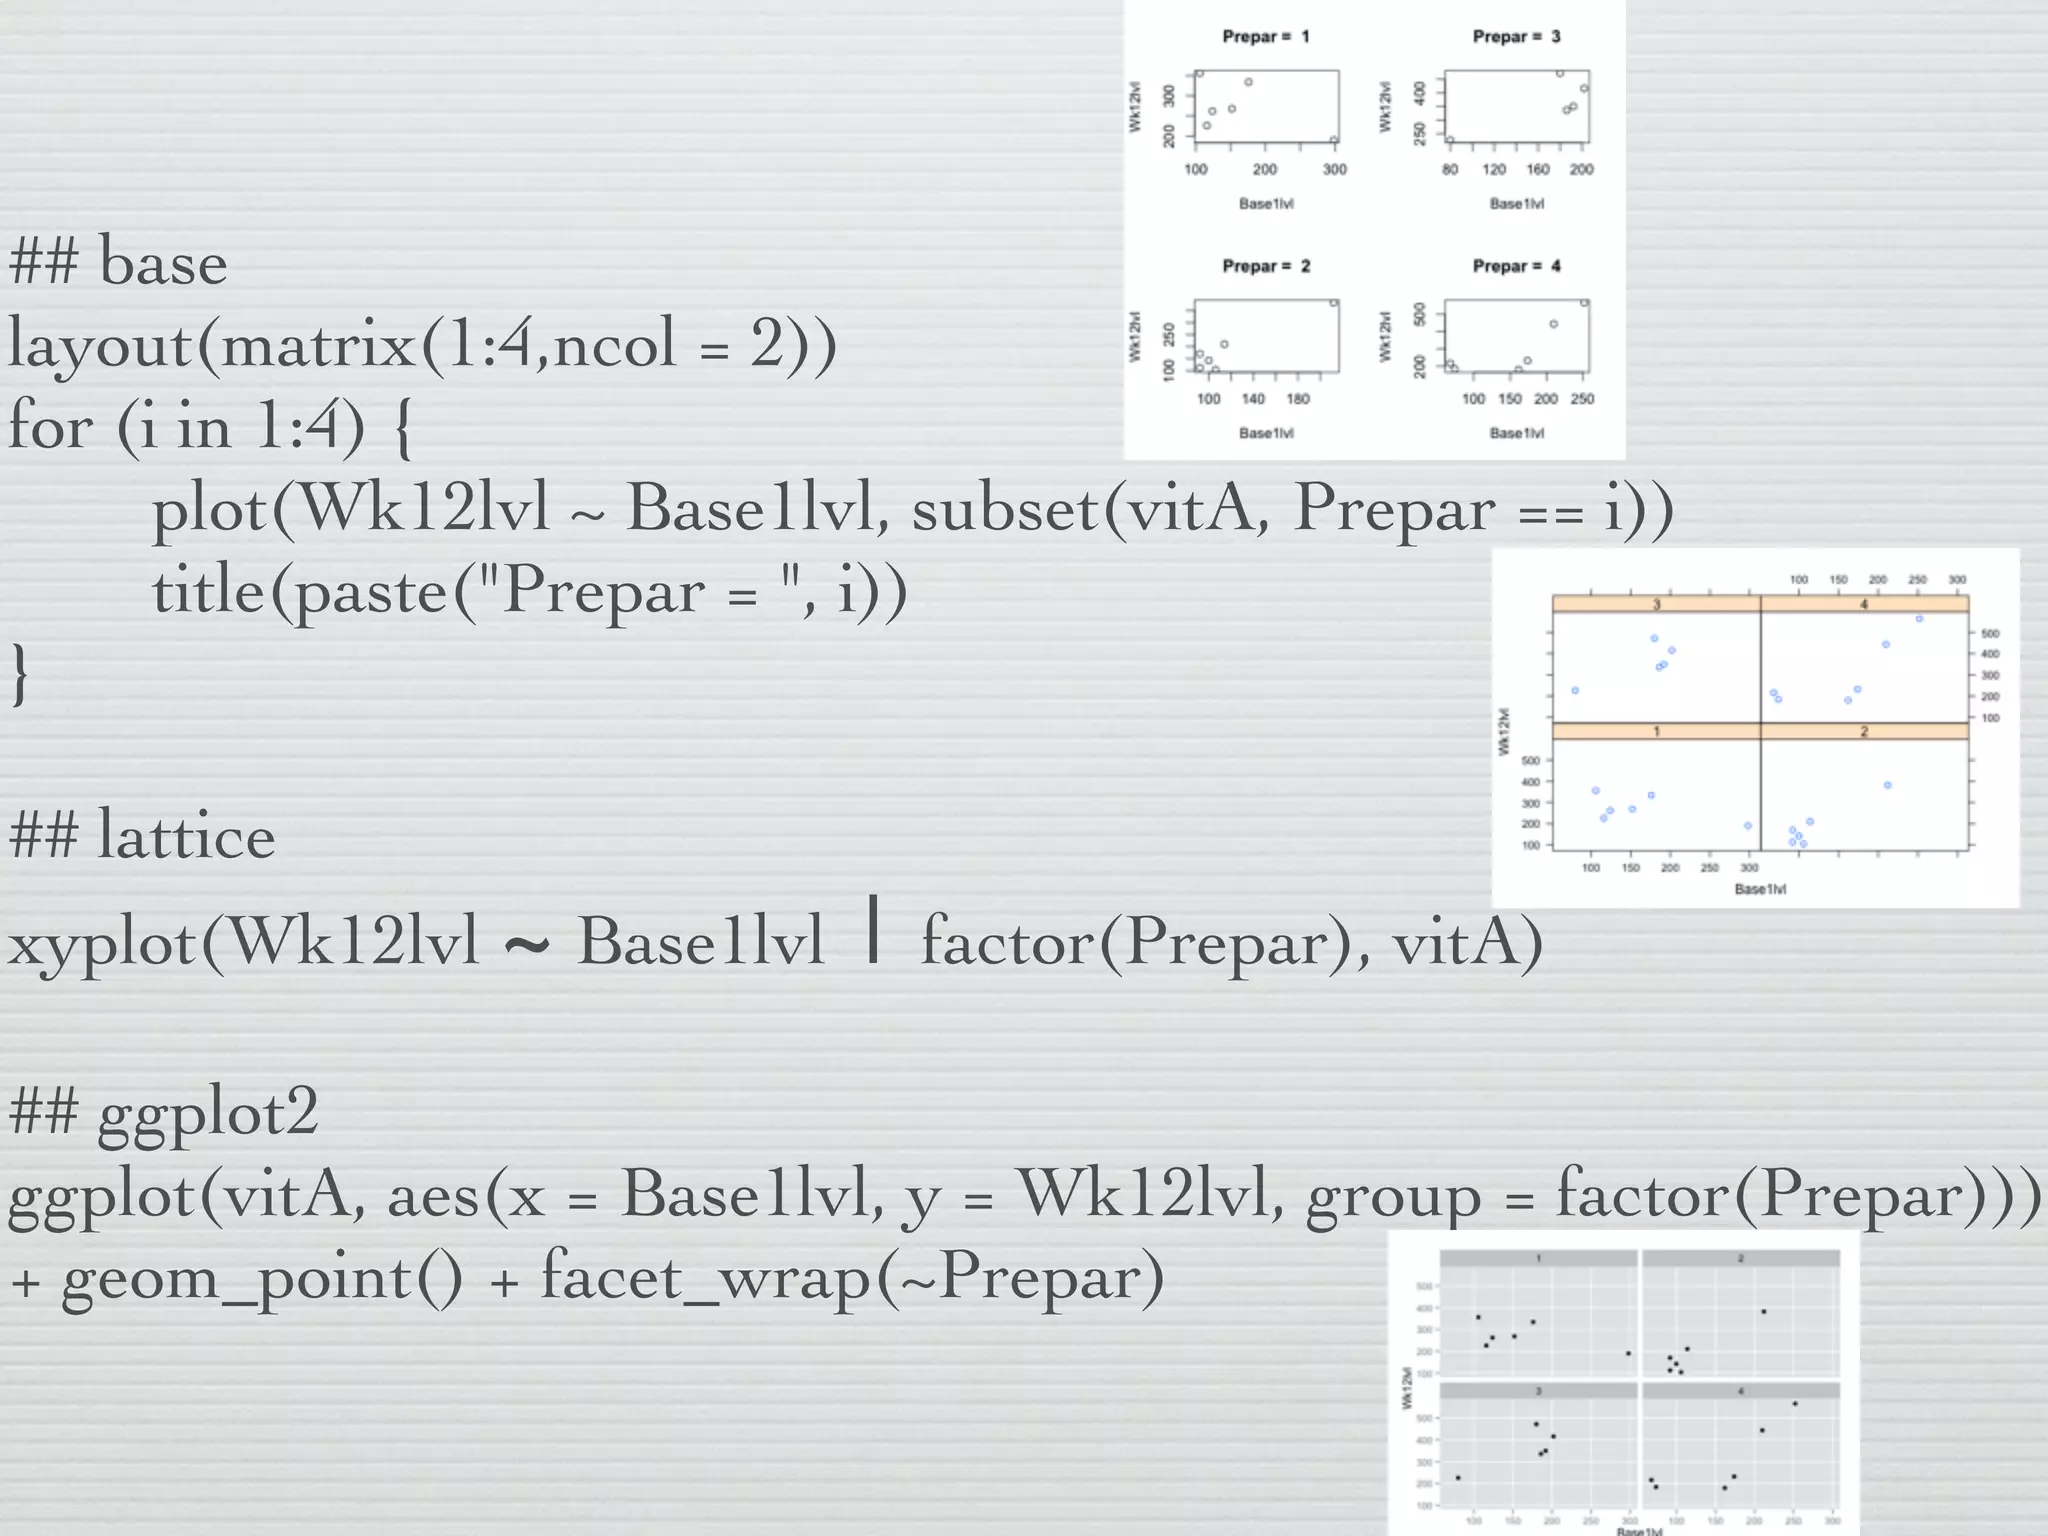


This document discusses basic graphing in R using the base, lattice, and ggplot2 packages. It demonstrates how to create histograms, density plots, scatter plots, box plots, and grouped plots using each graphing system. Examples are provided using the BONEDEN.DAT and BETACAR.DAT datasets to illustrate different types of one-variable and two-variable plots.