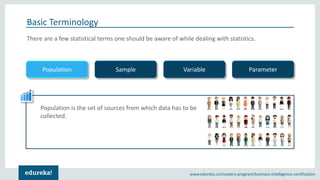
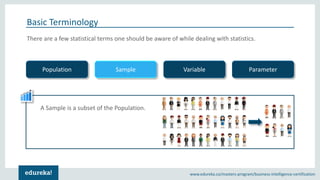
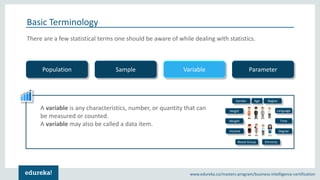
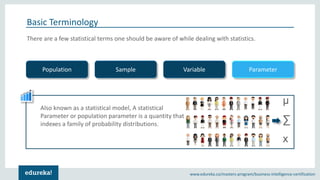
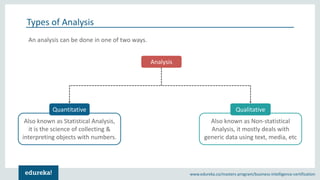
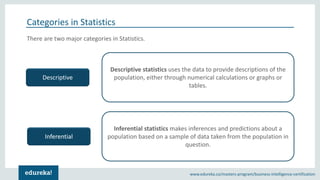
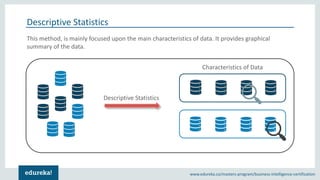
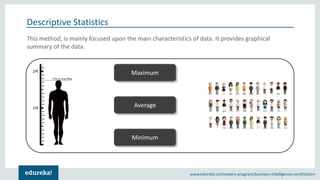
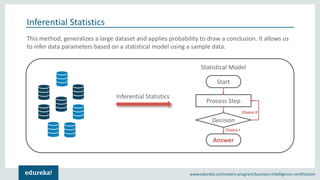
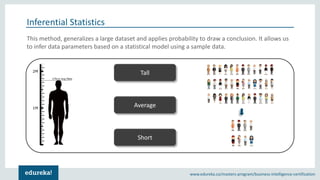
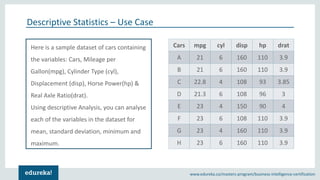
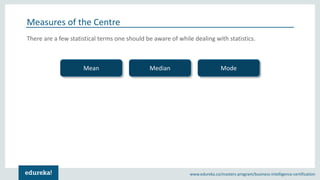
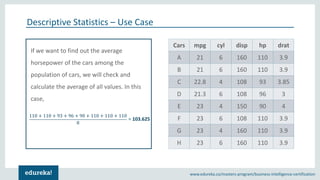
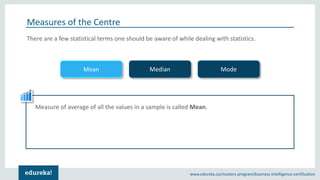
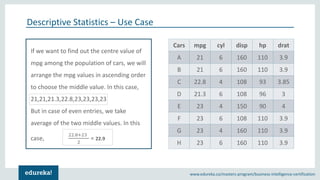
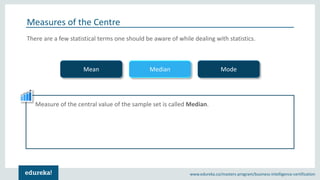
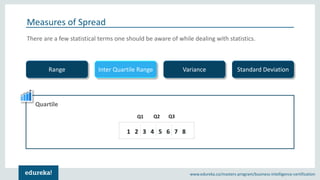
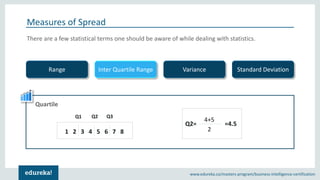
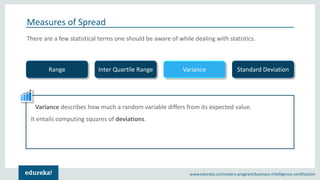
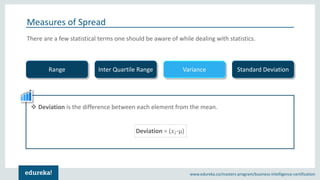
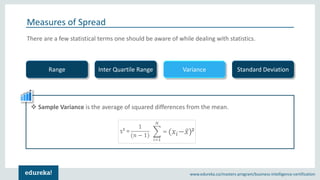
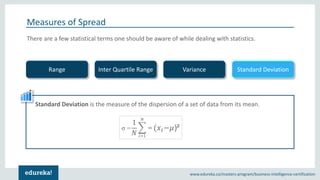
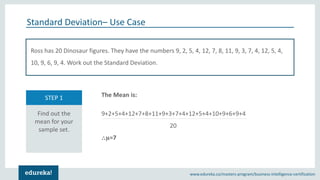
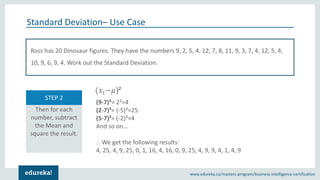
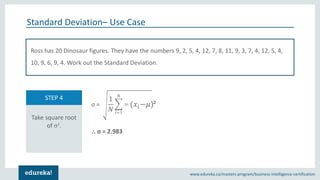
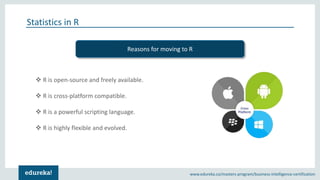
Introduction to Statistics
Terminology
Categories in Statistics
Descriptive & Inferential
Statistics
Statistics in R
Descriptive Statistics in R
Inferential Statistics in R
Agenda
Introduction to Statistics
Terminology
Categories in Statistics
Descriptive & Inferential
Statistics
Statistics in R
Descriptive Statistics in R
Inferential Statistics in R
Agenda
Introduction to Statistics
Terminology
Categories in Statistics
Descriptive & Inferential
Statistics
Statistics in R
Descriptive Statistics in R
Inferential Statistics in R
Agenda
Introduction to Statistics
Terminology
Categories in Statistics
Descriptive & Inferential
Statistics
Statistics in R
Descriptive Statistics in R
Inferential Statistics in R
Agenda
Introduction to Statistics
Terminology
Categories in Statistics
Descriptive & Inferential
Statistics
Statistics in R
Descriptive Statistics in R
Inferential Statistics in R
Agenda
Introduction to Statistics
Terminology
Categories in Statistics
Descriptive & Inferential
Statistics
Statistics in R
Descriptive Statistics in R
Inferential Statistics in R
Agenda
Introduction to Statistics
Terminology
Categories in Statistics
Descriptive & Inferential
Statistics
Statistics in R
Descriptive Statistics in R
Inferential Statistics in R
Agenda
Introduction to Statistics
Terminology
Categories in Statistics
Descriptive & Inferential
Statistics
Statistics in R
Descriptive Statistics in R
Inferential Statistics in R
Agenda
Introduction to Statistics
Copyright Š 2018, edureka and/or its affiliates. All rights reserved.www.edureka.co/masters-program/business-intelligence-certification
Introduction to Statistics
Statistics is a branch of mathematics dealing with data collection and organization, analysis,
interpretation and presentation.
Copyright Š 2018, edureka and/or its affiliates. All rights reserved.www.edureka.co/masters-program/business-intelligence-certification
Introduction to Statistics
Statistics is a branch of mathematics dealing with data collection and organization, analysis,
interpretation and presentation.
Copyright Š 2018, edureka and/or its affiliates. All rights reserved.www.edureka.co/masters-program/business-intelligence-certification
Introduction to Statistics
Statistics is a branch of mathematics dealing with data collection and organization, analysis,
interpretation and presentation.
Analyse Data
Build a Model
Infer Result
Copyright Š 2018, edureka and/or its affiliates. All rights reserved.www.edureka.co/masters-program/business-intelligence-certification
Introduction to Statistics
Statistics is a branch of mathematics dealing with data collection and organization, analysis,
interpretation and presentation.
Statistics
Stock
Market
Life
Sciences
Weather
Retail
Insurance
Education
Terminology
Copyright Š 2018, edureka and/or its affiliates. All rights reserved.www.edureka.co/masters-program/business-intelligence-certification
Basic Terminology
There are a few statistical terms one should be aware of while dealing with statistics.
Population ParameterSample Variable
Copyright Š 2018, edureka and/or its affiliates. All rights reserved.www.edureka.co/masters-program/business-intelligence-certification
Basic Terminology
There are a few statistical terms one should be aware of while dealing with statistics.
Population ParameterSample Variable
Population is the set of sources from which data has to be
collected.
Copyright Š 2018, edureka and/or its affiliates. All rights reserved.www.edureka.co/masters-program/business-intelligence-certification
Basic Terminology
There are a few statistical terms one should be aware of while dealing with statistics.
Population ParameterSample Variable
A Sample is a subset of the Population.
Copyright Š 2018, edureka and/or its affiliates. All rights reserved.www.edureka.co/masters-program/business-intelligence-certification
Basic Terminology
There are a few statistical terms one should be aware of while dealing with statistics.
Population ParameterSample Variable
A variable is any characteristics, number, or quantity that can
be measured or counted.
A variable may also be called a data item.
Gender Age Region
Height
Weight
Income
Blood Group Ethnicity
Degree
Time
Language
Copyright Š 2018, edureka and/or its affiliates. All rights reserved.www.edureka.co/masters-program/business-intelligence-certification
Basic Terminology
There are a few statistical terms one should be aware of while dealing with statistics.
Population ParameterSample Variable
Also known as a statistical model, A statistical
Parameter or population parameter is a quantity that
indexes a family of probability distributions.
Âľ
∑
х
Copyright Š 2018, edureka and/or its affiliates. All rights reserved.www.edureka.co/masters-program/business-intelligence-certification
Types of Analysis
An analysis can be done in one of two ways.
Analysis
Quantitative Qualitative
Copyright Š 2018, edureka and/or its affiliates. All rights reserved.www.edureka.co/masters-program/business-intelligence-certification
Types of Analysis
An analysis can be done in one of two ways.
Also known as Statistical Analysis,
it is the science of collecting &
interpreting objects with numbers.
Also known as Non-statistical
Analysis, it mostly deals with
generic data using text, media, etc
Analysis
Quantitative Qualitative
Categories in Statistics
Copyright Š 2018, edureka and/or its affiliates. All rights reserved.www.edureka.co/masters-program/business-intelligence-certification
Inferential statistics makes inferences and predictions about a
population based on a sample of data taken from the population in
question.
Descriptive statistics uses the data to provide descriptions of the
population, either through numerical calculations or graphs or
tables.
Categories in Statistics
There are two major categories in Statistics.
Descriptive
InferentialInferential
Copyright Š 2018, edureka and/or its affiliates. All rights reserved.www.edureka.co/masters-program/business-intelligence-certification
Descriptive Statistics
This method, is mainly focused upon the main characteristics of data. It provides graphical
summary of the data.
Characteristics of Data
Descriptive Statistics
Copyright Š 2018, edureka and/or its affiliates. All rights reserved.www.edureka.co/masters-program/business-intelligence-certification
Descriptive Statistics
Maximum
Minimum
Average
This method, is mainly focused upon the main characteristics of data. It provides graphical
summary of the data.
Copyright Š 2018, edureka and/or its affiliates. All rights reserved.www.edureka.co/masters-program/business-intelligence-certification
Inferential Statistics
This method, generalizes a large dataset and applies probability to draw a conclusion. It allows us
to infer data parameters based on a statistical model using a sample data.
Statistical Model
Start
Process Step
Decision
Answer
Choice I
Choice II
Inferential Statistics
Copyright Š 2018, edureka and/or its affiliates. All rights reserved.www.edureka.co/masters-program/business-intelligence-certification
Inferential Statistics
Tall
Short
Average
This method, generalizes a large dataset and applies probability to draw a conclusion. It allows us
to infer data parameters based on a statistical model using a sample data.
Descriptive Statistics – Statistical Measures
Copyright Š 2018, edureka and/or its affiliates. All rights reserved.www.edureka.co/masters-program/business-intelligence-certification
Descriptive Statistics – Use Case
Here is a sample dataset of cars containing
the variables: Cars, Mileage per
Gallon(mpg), Cylinder Type (cyl),
Displacement (disp), Horse Power(hp) &
Real Axle Ratio(drat).
Using descriptive Analysis, you can analyse
each of the variables in the dataset for
mean, standard deviation, minimum and
maximum.
Cars mpg cyl disp hp drat
A 21 6 160 110 3.9
B 21 6 160 110 3.9
C 22.8 4 108 93 3.85
D 21.3 6 108 96 3
E 23 4 150 90 4
F 23 6 108 110 3.9
G 23 4 160 110 3.9
H 23 6 160 110 3.9
Copyright Š 2018, edureka and/or its affiliates. All rights reserved.www.edureka.co/masters-program/business-intelligence-certification
Measures of the Centre
There are a few statistical terms one should be aware of while dealing with statistics.
Mean Median Mode
Copyright Š 2018, edureka and/or its affiliates. All rights reserved.www.edureka.co/masters-program/business-intelligence-certification
Descriptive Statistics – Use Case
If we want to find out the average
horsepower of the cars among the
population of cars, we will check and
calculate the average of all values. In this
case,
Cars mpg cyl disp hp drat
A 21 6 160 110 3.9
B 21 6 160 110 3.9
C 22.8 4 108 93 3.85
D 21.3 6 108 96 3
E 23 4 150 90 4
F 23 6 108 110 3.9
G 23 4 160 110 3.9
H 23 6 160 110 3.9
110 + 110 + 93 + 96 + 90 + 110 + 110 + 110
8
= 103.625
Copyright Š 2018, edureka and/or its affiliates. All rights reserved.www.edureka.co/masters-program/business-intelligence-certification
Measures of the Centre
There are a few statistical terms one should be aware of while dealing with statistics.
Mean Median Mode
Measure of average of all the values in a sample is called Mean.
Copyright Š 2018, edureka and/or its affiliates. All rights reserved.www.edureka.co/masters-program/business-intelligence-certification
Descriptive Statistics – Use Case
If we want to find out the centre value of
mpg among the population of cars, we will
arrange the mpg values in ascending order
to choose the middle value. In this case,
21,21,21.3,22.8,23,23,23,23
But in case of even entries, we take
average of the two middle values. In this
case,
22.8+23
2
= 22.9
Cars mpg cyl disp hp drat
A 21 6 160 110 3.9
B 21 6 160 110 3.9
C 22.8 4 108 93 3.85
D 21.3 6 108 96 3
E 23 4 150 90 4
F 23 6 108 110 3.9
G 23 4 160 110 3.9
H 23 6 160 110 3.9
Copyright Š 2018, edureka and/or its affiliates. All rights reserved.www.edureka.co/masters-program/business-intelligence-certification
Measures of the Centre
There are a few statistical terms one should be aware of while dealing with statistics.
Mean Median Mode
Measure of the central value of the sample set is called Median.
Copyright Š 2018, edureka and/or its affiliates. All rights reserved.www.edureka.co/masters-program/business-intelligence-certification
Descriptive Statistics – Use Case
If we want to find out the most common
type of cylinder among the population of
cars, we will check the value which is
repeated most number of times.
4 6
4 6
Cars mpg cyl disp hp drat
A 21 6 160 110 3.9
B 21 6 160 110 3.9
C 22.8 4 108 93 3.85
D 21.3 6 108 96 3
E 23 4 150 90 4
F 23 6 108 110 3.9
G 23 4 160 110 3.9
H 23 6 160 110 3.9
Copyright Š 2018, edureka and/or its affiliates. All rights reserved.www.edureka.co/masters-program/business-intelligence-certification
Measures of the Centre
There are a few statistical terms one should be aware of while dealing with statistics.
Mean Median Mode
The value most recurrent in the sample set is known as Mode.
Copyright Š 2018, edureka and/or its affiliates. All rights reserved.www.edureka.co/masters-program/business-intelligence-certification
Measures of the Spread
There are a few statistical terms one should be aware of while dealing with statistics.
Range Standard DeviationInter Quartile Range Variance
Copyright Š 2018, edureka and/or its affiliates. All rights reserved.www.edureka.co/masters-program/business-intelligence-certification
Measures of Spread
There are a few statistical terms one should be aware of while dealing with statistics.
Range Standard DeviationInter Quartile Range Variance
Range is the given measure of how spread apart the values in a dataset are.
Range = Max(𝑥𝑖) - Min(𝑥𝑖)
Copyright Š 2018, edureka and/or its affiliates. All rights reserved.www.edureka.co/masters-program/business-intelligence-certification
Measures of Spread
There are a few statistical terms one should be aware of while dealing with statistics.
Range Standard DeviationInter Quartile Range Variance
Inter Quartile Range(IQR) is the measure of variability, based on dividing a dataset into
quartiles.
1 2 3 4 5 6 7 8
Copyright Š 2018, edureka and/or its affiliates. All rights reserved.www.edureka.co/masters-program/business-intelligence-certification
Measures of Spread
There are a few statistical terms one should be aware of while dealing with statistics.
Range Standard DeviationInter Quartile Range Variance
Quartile
1 2 3 4 5 6 7 8
Q1 Q2 Q3
Q1=
2+3
2
=2.5
Copyright Š 2018, edureka and/or its affiliates. All rights reserved.www.edureka.co/masters-program/business-intelligence-certification
Measures of Spread
There are a few statistical terms one should be aware of while dealing with statistics.
Range Standard DeviationInter Quartile Range Variance
Quartile
1 2 3 4 5 6 7 8
Q1 Q2 Q3
Q2=
4+5
2
=4.5
Copyright Š 2018, edureka and/or its affiliates. All rights reserved.www.edureka.co/masters-program/business-intelligence-certification
Measures of Spread
There are a few statistical terms one should be aware of while dealing with statistics.
Range Standard DeviationInter Quartile Range Variance
Quartile
1 2 3 4 5 6 7 8
Q1 Q2 Q3
Q3=
6+7
2
=6.5
Copyright Š 2018, edureka and/or its affiliates. All rights reserved.www.edureka.co/masters-program/business-intelligence-certification
Measures of Spread
There are a few statistical terms one should be aware of while dealing with statistics.
Range Standard DeviationInter Quartile Range Variance
Inter Quartile Range
1 2 3 4 5 6 7 8
Q1 Q3
Copyright Š 2018, edureka and/or its affiliates. All rights reserved.www.edureka.co/masters-program/business-intelligence-certification
Measures of Spread
There are a few statistical terms one should be aware of while dealing with statistics.
Range Standard DeviationInter Quartile Range Variance
Variance describes how much a random variable differs from its expected value.
It entails computing squares of deviations.
Copyright Š 2018, edureka and/or its affiliates. All rights reserved.www.edureka.co/masters-program/business-intelligence-certification
Measures of Spread
There are a few statistical terms one should be aware of while dealing with statistics.
Range Standard DeviationInter Quartile Range Variance
❖ Deviation is the difference between each element from the mean.
Deviation = (𝑥𝑖-µ)
Copyright Š 2018, edureka and/or its affiliates. All rights reserved.www.edureka.co/masters-program/business-intelligence-certification
Measures of Spread
There are a few statistical terms one should be aware of while dealing with statistics.
Range Standard DeviationInter Quartile Range Variance
❖ Population Variance is the average of squared deviations.
σ² = ෍
𝑖=1
𝑁
= (𝑥𝑖−𝜇)²
1
𝑁
Copyright Š 2018, edureka and/or its affiliates. All rights reserved.www.edureka.co/masters-program/business-intelligence-certification
Measures of Spread
There are a few statistical terms one should be aware of while dealing with statistics.
Range Standard DeviationInter Quartile Range Variance
❖ Sample Variance is the average of squared differences from the mean.
s² = ෍
𝑖=1
𝑁
= (𝑥𝑖− ҧ𝑥)²
1
(𝑛 − 1)
Copyright Š 2018, edureka and/or its affiliates. All rights reserved.www.edureka.co/masters-program/business-intelligence-certification
Measures of Spread
There are a few statistical terms one should be aware of while dealing with statistics.
Range Standard DeviationInter Quartile Range Variance
Standard Deviation is the measure of the dispersion of a set of data from its mean.
σ = ෍
𝑖=1
𝑁
= (𝑥𝑖−𝜇)²
1
𝑁
Copyright Š 2018, edureka and/or its affiliates. All rights reserved.www.edureka.co/masters-program/business-intelligence-certification
Standard Deviation– Use Case
Ross has 20 Dinosaur figures. They have the numbers 9, 2, 5, 4, 12, 7, 8, 11, 9, 3, 7, 4, 12, 5, 4,
10, 9, 6, 9, 4. Work out the Standard Deviation.
Find out the
mean for your
sample set.
STEP 1 The Mean is:
9+2+5+4+12+7+8+11+9+3+7+4+12+5+4+10+9+6+9+4
20
⸍¾=7
Copyright Š 2018, edureka and/or its affiliates. All rights reserved.www.edureka.co/masters-program/business-intelligence-certification
Standard Deviation– Use Case
Ross has 20 Dinosaur figures. They have the numbers 9, 2, 5, 4, 12, 7, 8, 11, 9, 3, 7, 4, 12, 5, 4,
10, 9, 6, 9, 4. Work out the Standard Deviation.
Then for each
number, subtract
the Mean and
square the result.
STEP 2
(𝑥𝑖−𝜇)²
(9-7)²= 2²=4
(2-7)²= (-5)²=25
(5-7)²= (-2)²=4
And so on…
⸍ We get the following results:
4, 25, 4, 9, 25, 0, 1, 16, 4, 16, 0, 9, 25, 4, 9, 9, 4, 1, 4, 9
Copyright Š 2018, edureka and/or its affiliates. All rights reserved.www.edureka.co/masters-program/business-intelligence-certification
Standard Deviation– Use Case
Ross has 20 Dinosaur figures. They have the numbers 9, 2, 5, 4, 12, 7, 8, 11, 9, 3, 7, 4, 12, 5, 4,
10, 9, 6, 9, 4. Work out the Standard Deviation.
Then work out the
mean of those
squared
differences.
STEP 3 ෍
𝑖=1
𝑁
= (𝑥𝑖−𝜇)²
1
𝑁
4+25+4+9+25+0+1+16+4+16+0+9+25+4+9+9+4+1+4+9
20
⸍ σ² = 8.9
Copyright Š 2018, edureka and/or its affiliates. All rights reserved.www.edureka.co/masters-program/business-intelligence-certification
Standard Deviation– Use Case
Ross has 20 Dinosaur figures. They have the numbers 9, 2, 5, 4, 12, 7, 8, 11, 9, 3, 7, 4, 12, 5, 4,
10, 9, 6, 9, 4. Work out the Standard Deviation.
Take square root
of σ².
STEP 4
⸍ σ = 2.983
෍
𝑖=1
𝑁
= (𝑥𝑖−𝜇)²
1
𝑁
σ =
Statistics in R
Copyright Š 2018, edureka and/or its affiliates. All rights reserved.www.edureka.co/masters-program/business-intelligence-certification
Statistics in R
❖ R is open-source and freely available.
❖ R is cross-platform compatible.
❖ R is a powerful scripting language.
❖ R is highly flexible and evolved.
Reasons for moving to R
Descriptive statistics in R
Inferential Statistics – Hypothesis Testing
Copyright Š 2018, edureka and/or its affiliates. All rights reserved.www.edureka.co/masters-program/business-intelligence-certification
Hypothesis Testing
Statisticians use hypothesis testing to formally check whether the hypothesis is accepted or
rejected.
Hypothesis testing is conducted in the following manner:
❖ State the Hypotheses – This stage involves stating the null and alternative hypotheses.
❖ Formulate an Analysis Plan – This stage involves the construction of an analysis plan.
❖ Analyse Sample Data – This stage involves the calculation and interpretation of the test
statistic as described in the analysis plan.
❖ Interpret Results – This stage involves the application of the decision rule described in the
analysis plan.
Copyright Š 2018, edureka and/or its affiliates. All rights reserved.www.edureka.co/masters-program/business-intelligence-certification
Hypothesis Testing
Nick John Bob Harry
Assume the event is free of bias.
So, what is the probability of John not cheating?
Copyright Š 2018, edureka and/or its affiliates. All rights reserved.www.edureka.co/masters-program/business-intelligence-certification
Hypothesis Testing
Nick John Bob Harry
P(John not picked for a day) =
3
4
P(John not picked for 3 days) =
3
4
×
3
4
×
3
4
= 0.42 (approx)
P(John not picked for 12 days) = (
3
4
) 12
= 0.032 < 𝟎. 𝟎𝟓
Copyright Š 2018, edureka and/or its affiliates. All rights reserved.www.edureka.co/masters-program/business-intelligence-certification
Hypothesis Testing
Nick John Bob Harry
Null Hypothesis (𝑯 𝟎) : Result is no different from assumption.
Alternate Hypothesis (𝑯 𝒂) : Result disproves the assumption.
Probability of Event < 𝟎. 𝟎𝟓 (5%)
Inferential Statistics in R
www.edureka.co/masters-program/business-intelligence-certification

Statistics For Data Science | Statistics Using R Programming Language | Hypothesis Testing | Edureka

  • 2.
    Introduction to Statistics Terminology Categoriesin Statistics Descriptive & Inferential Statistics Statistics in R Descriptive Statistics in R Inferential Statistics in R Agenda
  • 3.
    Introduction to Statistics Terminology Categoriesin Statistics Descriptive & Inferential Statistics Statistics in R Descriptive Statistics in R Inferential Statistics in R Agenda
  • 4.
    Introduction to Statistics Terminology Categoriesin Statistics Descriptive & Inferential Statistics Statistics in R Descriptive Statistics in R Inferential Statistics in R Agenda
  • 5.
    Introduction to Statistics Terminology Categoriesin Statistics Descriptive & Inferential Statistics Statistics in R Descriptive Statistics in R Inferential Statistics in R Agenda
  • 6.
    Introduction to Statistics Terminology Categoriesin Statistics Descriptive & Inferential Statistics Statistics in R Descriptive Statistics in R Inferential Statistics in R Agenda
  • 7.
    Introduction to Statistics Terminology Categoriesin Statistics Descriptive & Inferential Statistics Statistics in R Descriptive Statistics in R Inferential Statistics in R Agenda
  • 8.
    Introduction to Statistics Terminology Categoriesin Statistics Descriptive & Inferential Statistics Statistics in R Descriptive Statistics in R Inferential Statistics in R Agenda
  • 9.
    Introduction to Statistics Terminology Categoriesin Statistics Descriptive & Inferential Statistics Statistics in R Descriptive Statistics in R Inferential Statistics in R Agenda
  • 10.
  • 11.
    Copyright Š 2018,edureka and/or its affiliates. All rights reserved.www.edureka.co/masters-program/business-intelligence-certification Introduction to Statistics Statistics is a branch of mathematics dealing with data collection and organization, analysis, interpretation and presentation.
  • 12.
    Copyright Š 2018,edureka and/or its affiliates. All rights reserved.www.edureka.co/masters-program/business-intelligence-certification Introduction to Statistics Statistics is a branch of mathematics dealing with data collection and organization, analysis, interpretation and presentation.
  • 13.
    Copyright Š 2018,edureka and/or its affiliates. All rights reserved.www.edureka.co/masters-program/business-intelligence-certification Introduction to Statistics Statistics is a branch of mathematics dealing with data collection and organization, analysis, interpretation and presentation. Analyse Data Build a Model Infer Result
  • 14.
    Copyright Š 2018,edureka and/or its affiliates. All rights reserved.www.edureka.co/masters-program/business-intelligence-certification Introduction to Statistics Statistics is a branch of mathematics dealing with data collection and organization, analysis, interpretation and presentation. Statistics Stock Market Life Sciences Weather Retail Insurance Education
  • 15.
  • 16.
    Copyright Š 2018,edureka and/or its affiliates. All rights reserved.www.edureka.co/masters-program/business-intelligence-certification Basic Terminology There are a few statistical terms one should be aware of while dealing with statistics. Population ParameterSample Variable
  • 17.
    Copyright Š 2018,edureka and/or its affiliates. All rights reserved.www.edureka.co/masters-program/business-intelligence-certification Basic Terminology There are a few statistical terms one should be aware of while dealing with statistics. Population ParameterSample Variable Population is the set of sources from which data has to be collected.
  • 18.
    Copyright Š 2018,edureka and/or its affiliates. All rights reserved.www.edureka.co/masters-program/business-intelligence-certification Basic Terminology There are a few statistical terms one should be aware of while dealing with statistics. Population ParameterSample Variable A Sample is a subset of the Population.
  • 19.
    Copyright Š 2018,edureka and/or its affiliates. All rights reserved.www.edureka.co/masters-program/business-intelligence-certification Basic Terminology There are a few statistical terms one should be aware of while dealing with statistics. Population ParameterSample Variable A variable is any characteristics, number, or quantity that can be measured or counted. A variable may also be called a data item. Gender Age Region Height Weight Income Blood Group Ethnicity Degree Time Language
  • 20.
    Copyright © 2018,edureka and/or its affiliates. All rights reserved.www.edureka.co/masters-program/business-intelligence-certification Basic Terminology There are a few statistical terms one should be aware of while dealing with statistics. Population ParameterSample Variable Also known as a statistical model, A statistical Parameter or population parameter is a quantity that indexes a family of probability distributions. µ ∑ х
  • 21.
    Copyright Š 2018,edureka and/or its affiliates. All rights reserved.www.edureka.co/masters-program/business-intelligence-certification Types of Analysis An analysis can be done in one of two ways. Analysis Quantitative Qualitative
  • 22.
    Copyright Š 2018,edureka and/or its affiliates. All rights reserved.www.edureka.co/masters-program/business-intelligence-certification Types of Analysis An analysis can be done in one of two ways. Also known as Statistical Analysis, it is the science of collecting & interpreting objects with numbers. Also known as Non-statistical Analysis, it mostly deals with generic data using text, media, etc Analysis Quantitative Qualitative
  • 23.
  • 24.
    Copyright Š 2018,edureka and/or its affiliates. All rights reserved.www.edureka.co/masters-program/business-intelligence-certification Inferential statistics makes inferences and predictions about a population based on a sample of data taken from the population in question. Descriptive statistics uses the data to provide descriptions of the population, either through numerical calculations or graphs or tables. Categories in Statistics There are two major categories in Statistics. Descriptive InferentialInferential
  • 25.
    Copyright Š 2018,edureka and/or its affiliates. All rights reserved.www.edureka.co/masters-program/business-intelligence-certification Descriptive Statistics This method, is mainly focused upon the main characteristics of data. It provides graphical summary of the data. Characteristics of Data Descriptive Statistics
  • 26.
    Copyright Š 2018,edureka and/or its affiliates. All rights reserved.www.edureka.co/masters-program/business-intelligence-certification Descriptive Statistics Maximum Minimum Average This method, is mainly focused upon the main characteristics of data. It provides graphical summary of the data.
  • 27.
    Copyright Š 2018,edureka and/or its affiliates. All rights reserved.www.edureka.co/masters-program/business-intelligence-certification Inferential Statistics This method, generalizes a large dataset and applies probability to draw a conclusion. It allows us to infer data parameters based on a statistical model using a sample data. Statistical Model Start Process Step Decision Answer Choice I Choice II Inferential Statistics
  • 28.
    Copyright Š 2018,edureka and/or its affiliates. All rights reserved.www.edureka.co/masters-program/business-intelligence-certification Inferential Statistics Tall Short Average This method, generalizes a large dataset and applies probability to draw a conclusion. It allows us to infer data parameters based on a statistical model using a sample data.
  • 29.
    Descriptive Statistics –Statistical Measures
  • 30.
    Copyright © 2018,edureka and/or its affiliates. All rights reserved.www.edureka.co/masters-program/business-intelligence-certification Descriptive Statistics – Use Case Here is a sample dataset of cars containing the variables: Cars, Mileage per Gallon(mpg), Cylinder Type (cyl), Displacement (disp), Horse Power(hp) & Real Axle Ratio(drat). Using descriptive Analysis, you can analyse each of the variables in the dataset for mean, standard deviation, minimum and maximum. Cars mpg cyl disp hp drat A 21 6 160 110 3.9 B 21 6 160 110 3.9 C 22.8 4 108 93 3.85 D 21.3 6 108 96 3 E 23 4 150 90 4 F 23 6 108 110 3.9 G 23 4 160 110 3.9 H 23 6 160 110 3.9
  • 31.
    Copyright Š 2018,edureka and/or its affiliates. All rights reserved.www.edureka.co/masters-program/business-intelligence-certification Measures of the Centre There are a few statistical terms one should be aware of while dealing with statistics. Mean Median Mode
  • 32.
    Copyright © 2018,edureka and/or its affiliates. All rights reserved.www.edureka.co/masters-program/business-intelligence-certification Descriptive Statistics – Use Case If we want to find out the average horsepower of the cars among the population of cars, we will check and calculate the average of all values. In this case, Cars mpg cyl disp hp drat A 21 6 160 110 3.9 B 21 6 160 110 3.9 C 22.8 4 108 93 3.85 D 21.3 6 108 96 3 E 23 4 150 90 4 F 23 6 108 110 3.9 G 23 4 160 110 3.9 H 23 6 160 110 3.9 110 + 110 + 93 + 96 + 90 + 110 + 110 + 110 8 = 103.625
  • 33.
    Copyright Š 2018,edureka and/or its affiliates. All rights reserved.www.edureka.co/masters-program/business-intelligence-certification Measures of the Centre There are a few statistical terms one should be aware of while dealing with statistics. Mean Median Mode Measure of average of all the values in a sample is called Mean.
  • 34.
    Copyright © 2018,edureka and/or its affiliates. All rights reserved.www.edureka.co/masters-program/business-intelligence-certification Descriptive Statistics – Use Case If we want to find out the centre value of mpg among the population of cars, we will arrange the mpg values in ascending order to choose the middle value. In this case, 21,21,21.3,22.8,23,23,23,23 But in case of even entries, we take average of the two middle values. In this case, 22.8+23 2 = 22.9 Cars mpg cyl disp hp drat A 21 6 160 110 3.9 B 21 6 160 110 3.9 C 22.8 4 108 93 3.85 D 21.3 6 108 96 3 E 23 4 150 90 4 F 23 6 108 110 3.9 G 23 4 160 110 3.9 H 23 6 160 110 3.9
  • 35.
    Copyright Š 2018,edureka and/or its affiliates. All rights reserved.www.edureka.co/masters-program/business-intelligence-certification Measures of the Centre There are a few statistical terms one should be aware of while dealing with statistics. Mean Median Mode Measure of the central value of the sample set is called Median.
  • 36.
    Copyright © 2018,edureka and/or its affiliates. All rights reserved.www.edureka.co/masters-program/business-intelligence-certification Descriptive Statistics – Use Case If we want to find out the most common type of cylinder among the population of cars, we will check the value which is repeated most number of times. 4 6 4 6 Cars mpg cyl disp hp drat A 21 6 160 110 3.9 B 21 6 160 110 3.9 C 22.8 4 108 93 3.85 D 21.3 6 108 96 3 E 23 4 150 90 4 F 23 6 108 110 3.9 G 23 4 160 110 3.9 H 23 6 160 110 3.9
  • 37.
    Copyright Š 2018,edureka and/or its affiliates. All rights reserved.www.edureka.co/masters-program/business-intelligence-certification Measures of the Centre There are a few statistical terms one should be aware of while dealing with statistics. Mean Median Mode The value most recurrent in the sample set is known as Mode.
  • 38.
    Copyright Š 2018,edureka and/or its affiliates. All rights reserved.www.edureka.co/masters-program/business-intelligence-certification Measures of the Spread There are a few statistical terms one should be aware of while dealing with statistics. Range Standard DeviationInter Quartile Range Variance
  • 39.
    Copyright © 2018,edureka and/or its affiliates. All rights reserved.www.edureka.co/masters-program/business-intelligence-certification Measures of Spread There are a few statistical terms one should be aware of while dealing with statistics. Range Standard DeviationInter Quartile Range Variance Range is the given measure of how spread apart the values in a dataset are. Range = Max(𝑥𝑖) - Min(𝑥𝑖)
  • 40.
    Copyright Š 2018,edureka and/or its affiliates. All rights reserved.www.edureka.co/masters-program/business-intelligence-certification Measures of Spread There are a few statistical terms one should be aware of while dealing with statistics. Range Standard DeviationInter Quartile Range Variance Inter Quartile Range(IQR) is the measure of variability, based on dividing a dataset into quartiles. 1 2 3 4 5 6 7 8
  • 41.
    Copyright Š 2018,edureka and/or its affiliates. All rights reserved.www.edureka.co/masters-program/business-intelligence-certification Measures of Spread There are a few statistical terms one should be aware of while dealing with statistics. Range Standard DeviationInter Quartile Range Variance Quartile 1 2 3 4 5 6 7 8 Q1 Q2 Q3
  • 42.
    Copyright Š 2018,edureka and/or its affiliates. All rights reserved.www.edureka.co/masters-program/business-intelligence-certification Measures of Spread There are a few statistical terms one should be aware of while dealing with statistics. Range Standard DeviationInter Quartile Range Variance Quartile 1 2 3 4 5 6 7 8 Q1 Q2 Q3 Q1= 2+3 2 =2.5
  • 43.
    Copyright Š 2018,edureka and/or its affiliates. All rights reserved.www.edureka.co/masters-program/business-intelligence-certification Measures of Spread There are a few statistical terms one should be aware of while dealing with statistics. Range Standard DeviationInter Quartile Range Variance Quartile 1 2 3 4 5 6 7 8 Q1 Q2 Q3 Q2= 4+5 2 =4.5
  • 44.
    Copyright Š 2018,edureka and/or its affiliates. All rights reserved.www.edureka.co/masters-program/business-intelligence-certification Measures of Spread There are a few statistical terms one should be aware of while dealing with statistics. Range Standard DeviationInter Quartile Range Variance Quartile 1 2 3 4 5 6 7 8 Q1 Q2 Q3 Q3= 6+7 2 =6.5
  • 45.
    Copyright Š 2018,edureka and/or its affiliates. All rights reserved.www.edureka.co/masters-program/business-intelligence-certification Measures of Spread There are a few statistical terms one should be aware of while dealing with statistics. Range Standard DeviationInter Quartile Range Variance Inter Quartile Range 1 2 3 4 5 6 7 8 Q1 Q3
  • 46.
    Copyright Š 2018,edureka and/or its affiliates. All rights reserved.www.edureka.co/masters-program/business-intelligence-certification Measures of Spread There are a few statistical terms one should be aware of while dealing with statistics. Range Standard DeviationInter Quartile Range Variance Variance describes how much a random variable differs from its expected value. It entails computing squares of deviations.
  • 47.
    Copyright © 2018,edureka and/or its affiliates. All rights reserved.www.edureka.co/masters-program/business-intelligence-certification Measures of Spread There are a few statistical terms one should be aware of while dealing with statistics. Range Standard DeviationInter Quartile Range Variance ❖ Deviation is the difference between each element from the mean. Deviation = (𝑥𝑖-µ)
  • 48.
    Copyright © 2018,edureka and/or its affiliates. All rights reserved.www.edureka.co/masters-program/business-intelligence-certification Measures of Spread There are a few statistical terms one should be aware of while dealing with statistics. Range Standard DeviationInter Quartile Range Variance ❖ Population Variance is the average of squared deviations. σ² = ෍ 𝑖=1 𝑁 = (𝑥𝑖−𝜇)² 1 𝑁
  • 49.
    Copyright © 2018,edureka and/or its affiliates. All rights reserved.www.edureka.co/masters-program/business-intelligence-certification Measures of Spread There are a few statistical terms one should be aware of while dealing with statistics. Range Standard DeviationInter Quartile Range Variance ❖ Sample Variance is the average of squared differences from the mean. s² = ෍ 𝑖=1 𝑁 = (𝑥𝑖− ҧ𝑥)² 1 (𝑛 − 1)
  • 50.
    Copyright © 2018,edureka and/or its affiliates. All rights reserved.www.edureka.co/masters-program/business-intelligence-certification Measures of Spread There are a few statistical terms one should be aware of while dealing with statistics. Range Standard DeviationInter Quartile Range Variance Standard Deviation is the measure of the dispersion of a set of data from its mean. σ = ෍ 𝑖=1 𝑁 = (𝑥𝑖−𝜇)² 1 𝑁
  • 51.
    Copyright © 2018,edureka and/or its affiliates. All rights reserved.www.edureka.co/masters-program/business-intelligence-certification Standard Deviation– Use Case Ross has 20 Dinosaur figures. They have the numbers 9, 2, 5, 4, 12, 7, 8, 11, 9, 3, 7, 4, 12, 5, 4, 10, 9, 6, 9, 4. Work out the Standard Deviation. Find out the mean for your sample set. STEP 1 The Mean is: 9+2+5+4+12+7+8+11+9+3+7+4+12+5+4+10+9+6+9+4 20 ⸫µ=7
  • 52.
    Copyright © 2018,edureka and/or its affiliates. All rights reserved.www.edureka.co/masters-program/business-intelligence-certification Standard Deviation– Use Case Ross has 20 Dinosaur figures. They have the numbers 9, 2, 5, 4, 12, 7, 8, 11, 9, 3, 7, 4, 12, 5, 4, 10, 9, 6, 9, 4. Work out the Standard Deviation. Then for each number, subtract the Mean and square the result. STEP 2 (𝑥𝑖−𝜇)² (9-7)²= 2²=4 (2-7)²= (-5)²=25 (5-7)²= (-2)²=4 And so on… ⸫ We get the following results: 4, 25, 4, 9, 25, 0, 1, 16, 4, 16, 0, 9, 25, 4, 9, 9, 4, 1, 4, 9
  • 53.
    Copyright © 2018,edureka and/or its affiliates. All rights reserved.www.edureka.co/masters-program/business-intelligence-certification Standard Deviation– Use Case Ross has 20 Dinosaur figures. They have the numbers 9, 2, 5, 4, 12, 7, 8, 11, 9, 3, 7, 4, 12, 5, 4, 10, 9, 6, 9, 4. Work out the Standard Deviation. Then work out the mean of those squared differences. STEP 3 ෍ 𝑖=1 𝑁 = (𝑥𝑖−𝜇)² 1 𝑁 4+25+4+9+25+0+1+16+4+16+0+9+25+4+9+9+4+1+4+9 20 ⸫ σ² = 8.9
  • 54.
    Copyright © 2018,edureka and/or its affiliates. All rights reserved.www.edureka.co/masters-program/business-intelligence-certification Standard Deviation– Use Case Ross has 20 Dinosaur figures. They have the numbers 9, 2, 5, 4, 12, 7, 8, 11, 9, 3, 7, 4, 12, 5, 4, 10, 9, 6, 9, 4. Work out the Standard Deviation. Take square root of σ². STEP 4 ⸫ σ = 2.983 ෍ 𝑖=1 𝑁 = (𝑥𝑖−𝜇)² 1 𝑁 σ =
  • 55.
  • 56.
    Copyright © 2018,edureka and/or its affiliates. All rights reserved.www.edureka.co/masters-program/business-intelligence-certification Statistics in R ❖ R is open-source and freely available. ❖ R is cross-platform compatible. ❖ R is a powerful scripting language. ❖ R is highly flexible and evolved. Reasons for moving to R
  • 57.
    Copyright © 2018,edureka and/or its affiliates. All rights reserved.www.edureka.co/masters-program/business-intelligence-certification Statistics in R ❖ R is open-source and freely available. ❖ R is cross-platform compatible. ❖ R is a powerful scripting language. ❖ R is highly flexible and evolved. Reasons for moving to R
  • 58.
    Copyright © 2018,edureka and/or its affiliates. All rights reserved.www.edureka.co/masters-program/business-intelligence-certification Statistics in R ❖ R is open-source and freely available. ❖ R is cross-platform compatible. ❖ R is a powerful scripting language. ❖ R is highly flexible and evolved. Reasons for moving to R
  • 59.
    Copyright © 2018,edureka and/or its affiliates. All rights reserved.www.edureka.co/masters-program/business-intelligence-certification Statistics in R ❖ R is open-source and freely available. ❖ R is cross-platform compatible. ❖ R is a powerful scripting language. ❖ R is highly flexible and evolved. Reasons for moving to R
  • 60.
  • 61.
  • 62.
    Copyright © 2018,edureka and/or its affiliates. All rights reserved.www.edureka.co/masters-program/business-intelligence-certification Hypothesis Testing Statisticians use hypothesis testing to formally check whether the hypothesis is accepted or rejected. Hypothesis testing is conducted in the following manner: ❖ State the Hypotheses – This stage involves stating the null and alternative hypotheses. ❖ Formulate an Analysis Plan – This stage involves the construction of an analysis plan. ❖ Analyse Sample Data – This stage involves the calculation and interpretation of the test statistic as described in the analysis plan. ❖ Interpret Results – This stage involves the application of the decision rule described in the analysis plan.
  • 63.
    Copyright Š 2018,edureka and/or its affiliates. All rights reserved.www.edureka.co/masters-program/business-intelligence-certification Hypothesis Testing Nick John Bob Harry Assume the event is free of bias. So, what is the probability of John not cheating?
  • 64.
    Copyright © 2018,edureka and/or its affiliates. All rights reserved.www.edureka.co/masters-program/business-intelligence-certification Hypothesis Testing Nick John Bob Harry P(John not picked for a day) = 3 4 P(John not picked for 3 days) = 3 4 × 3 4 × 3 4 = 0.42 (approx) P(John not picked for 12 days) = ( 3 4 ) 12 = 0.032 < 𝟎. 𝟎𝟓
  • 65.
    Copyright © 2018,edureka and/or its affiliates. All rights reserved.www.edureka.co/masters-program/business-intelligence-certification Hypothesis Testing Nick John Bob Harry Null Hypothesis (𝑯 𝟎) : Result is no different from assumption. Alternate Hypothesis (𝑯 𝒂) : Result disproves the assumption. Probability of Event < 𝟎. 𝟎𝟓 (5%)
  • 66.
  • 67.