R is a free programming language and software environment for statistical analysis and graphics. It contains functions for data manipulation, calculation, and graphical displays. Some key features of R include being free, running on multiple platforms, and having extensive statistical and graphical capabilities. Common object types in R include vectors, matrices, data frames, and lists. R also has packages that add additional functions.

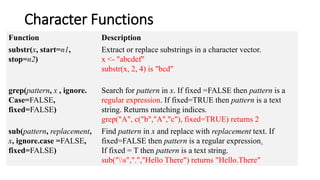
![Factors
> temp <- c("low", "high", "medium", "high", "low", "medium", "high")
> factor(temp)
[1] low high medium high low medium high
>levels(factor(temp))
[1] "high" "low" "medium"
> factor(temp,order=TRUE,levels=c("low","medium","high"))
Levels: low < medium < high
>tempfact<-factor(temp,order=TRUE,levels=c("low","medium","high"))
> summary(tempfact)
low medium high
2 2 3](https://image.slidesharecdn.com/rintroduction-201130104341/85/R-Introduction-12-320.jpg)
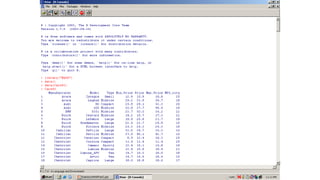
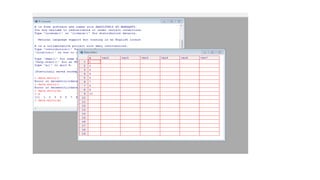
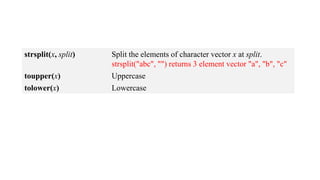
![R Attach Packages
To attach another package to the system you can use the menu or the library
function.
Via the menu:
`Packages' → `Load package...',
Via the library function:
> library(MASS)
> shoes
$A
[1] 13.2 8.2 10.9 14.3 10.7 6.6 9.5 10.8 8.8 13.3
$B
[1] 14.0 8.8 11.2 14.2 11.8 6.4 9.8 11.3 9.3 13.6
Functions and datasets to support Venables and Ripley,
"Modern Applied Statistics with S" (4th edition, 2002)](https://image.slidesharecdn.com/rintroduction-201130104341/85/R-Introduction-16-320.jpg)
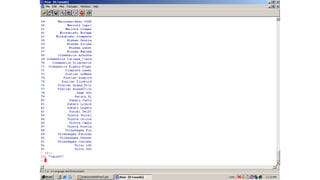
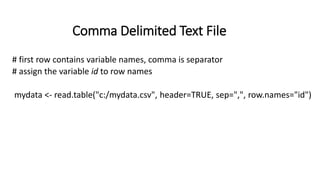
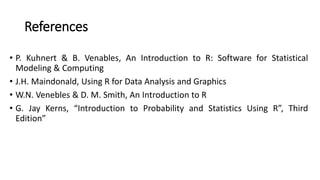
![Subsetting iris data
As with vectors, you can "subset" data frames.
df[rows,cols]](https://image.slidesharecdn.com/rintroduction-201130104341/85/R-Introduction-23-320.jpg)
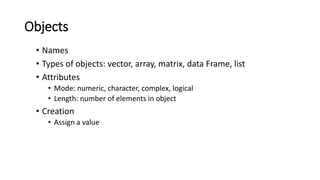
![Data Frame
• A data frame is more general than a matrix, in that different columns
can have different modes (numeric, character, factor, etc.).
• Just like a table in a database or excel sheet.
• Can be created using data.Frame()
L <-letters[1:4] #a b c d
X <-1:4 #1 2 3 4
data.frame(x,l) #create data frame](https://image.slidesharecdn.com/rintroduction-201130104341/85/R-Introduction-27-320.jpg)
![Data Elements
• select only one element
• x[2]
• select range of elements
• x[1:3]
• select all but one element
• x[-3]
• slicing: including only part of the object
• x[c(1,2,5)]
• select elements based on logical operator
• x(x>3)
In R, array indexes start at 1](https://image.slidesharecdn.com/rintroduction-201130104341/85/R-Introduction-28-320.jpg)


![Introduction to Pandas and Time Series Analysis [PyCon DE]](https://cdn.slidesharecdn.com/ss_thumbnails/introductiontopandasandtimeseriesanalysispyconde-170617163724-thumbnail.jpg?width=640&height=640&fit=bounds)