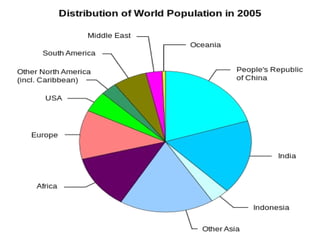
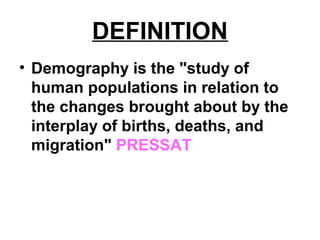
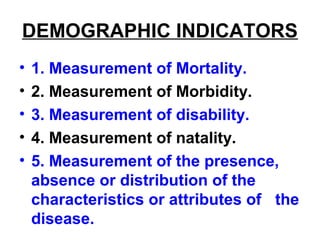
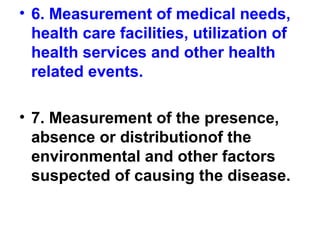
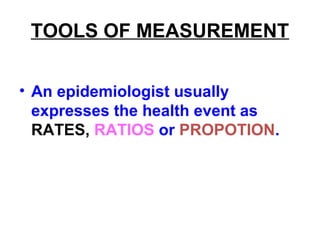
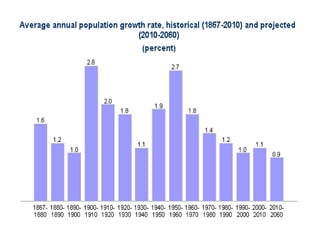
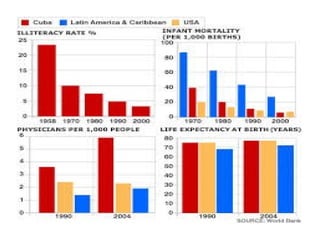
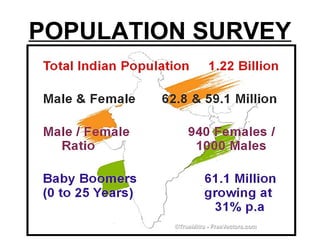
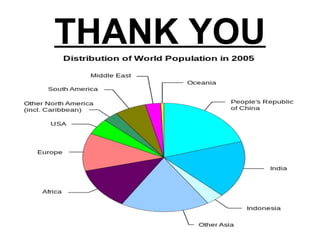
Demography is the statistical study of human populations. It examines the size, structure, and distribution of populations, as well as changes to them over time due to births, deaths, and migration. Key demographic indicators include birth rates, death rates, fertility rates, and life expectancy. Demographic data helps analyze population growth and structure.
Demography as the statistical study of human population with regard to their size & structure, their composition by sex, age, marital status and ethnic origin, and the changes to these population, like changes in their birth rates, death rates and immigration.
Demography is the branch of social size, structure, which deals with the study of size, structure and distribution of populations, along with the spatial and temporal changes in them in response to birth, migration, ageing and death.
In demography the following three elements of population are given special attention:
Change in the size of population (increase or decrease)
Structure of population (on the basis of sex or age groups)
Geographical distribution of population (on the basis of state or territory).
Unit: 6 Demographic Rates and Ratios vital statistics SMVDCoN ,J&K
Rate measures the occurrence of some particular event in a population during a given period of time. It indicates the change in some event that take place in a population over a period of time like death rate or birth rate.A ratio is a relationship between two numbers indicating how many times the first number contains the second.
Demographic characteristics of a country provide an overview of its population size, composition, territorial distribution, changes therein and the components of changes such as natality, mortality and social mobility
These comprehensive slides on demography provide a deep understanding of the science of population dynamics. Covering essential concepts, methodologies, and key demographic indicators, these notes offer insights into the study of population growth, distribution, and composition. Explore topics such as fertility, mortality, migration, and population projections, as well as their implications for society and policy. With this resource, you'll gain a strong foundation in demography, making it an invaluable reference for students, researchers, and anyone interested in the dynamics of human populations.
Population growth is one of the major issues that the human species are facing no matter where on the earth it is occurring in the world. The impact of increasing population has got an adverse effect on the national economy. Moreover increasing number of births has got a deleterious effect on the health of the mother and child and hinders social and economic upliftment of the family.
Population dynamic refers to the study and measurement of population change and components of change over time.
The factors involved in the population dynamics are-
• Deaths
• Births
• Migration
The population may increase or remain stationary or may decline.
The respective tools to analyze the influence of these changes on the population are as follows-
• Rate
• Ratio
• Proportions
Report Back from SGO 2024: What’s the Latest in Cervical Cancer?bkling
Are you curious about what’s new in cervical cancer research or unsure what the findings mean? Join Dr. Emily Ko, a gynecologic oncologist at Penn Medicine, to learn about the latest updates from the Society of Gynecologic Oncology (SGO) 2024 Annual Meeting on Women’s Cancer. Dr. Ko will discuss what the research presented at the conference means for you and answer your questions about the new developments.
These simplified slides by Dr. Sidra Arshad present an overview of the non-respiratory functions of the respiratory tract.
Learning objectives:
1. Enlist the non-respiratory functions of the respiratory tract
2. Briefly explain how these functions are carried out
3. Discuss the significance of dead space
4. Differentiate between minute ventilation and alveolar ventilation
5. Describe the cough and sneeze reflexes
Study Resources:
1. Chapter 39, Guyton and Hall Textbook of Medical Physiology, 14th edition
2. Chapter 34, Ganong’s Review of Medical Physiology, 26th edition
3. Chapter 17, Human Physiology by Lauralee Sherwood, 9th edition
4. Non-respiratory functions of the lungs https://academic.oup.com/bjaed/article/13/3/98/278874
NVBDCP.pptx Nation vector borne disease control programSapna Thakur
NVBDCP was launched in 2003-2004 . Vector-Borne Disease: Disease that results from an infection transmitted to humans and other animals by blood-feeding arthropods, such as mosquitoes, ticks, and fleas. Examples of vector-borne diseases include Dengue fever, West Nile Virus, Lyme disease, and malaria.
Title: Sense of Taste
Presenter: Dr. Faiza, Assistant Professor of Physiology
Qualifications:
MBBS (Best Graduate, AIMC Lahore)
FCPS Physiology
ICMT, CHPE, DHPE (STMU)
MPH (GC University, Faisalabad)
MBA (Virtual University of Pakistan)
Learning Objectives:
Describe the structure and function of taste buds.
Describe the relationship between the taste threshold and taste index of common substances.
Explain the chemical basis and signal transduction of taste perception for each type of primary taste sensation.
Recognize different abnormalities of taste perception and their causes.
Key Topics:
Significance of Taste Sensation:
Differentiation between pleasant and harmful food
Influence on behavior
Selection of food based on metabolic needs
Receptors of Taste:
Taste buds on the tongue
Influence of sense of smell, texture of food, and pain stimulation (e.g., by pepper)
Primary and Secondary Taste Sensations:
Primary taste sensations: Sweet, Sour, Salty, Bitter, Umami
Chemical basis and signal transduction mechanisms for each taste
Taste Threshold and Index:
Taste threshold values for Sweet (sucrose), Salty (NaCl), Sour (HCl), and Bitter (Quinine)
Taste index relationship: Inversely proportional to taste threshold
Taste Blindness:
Inability to taste certain substances, particularly thiourea compounds
Example: Phenylthiocarbamide
Structure and Function of Taste Buds:
Composition: Epithelial cells, Sustentacular/Supporting cells, Taste cells, Basal cells
Features: Taste pores, Taste hairs/microvilli, and Taste nerve fibers
Location of Taste Buds:
Found in papillae of the tongue (Fungiform, Circumvallate, Foliate)
Also present on the palate, tonsillar pillars, epiglottis, and proximal esophagus
Mechanism of Taste Stimulation:
Interaction of taste substances with receptors on microvilli
Signal transduction pathways for Umami, Sweet, Bitter, Sour, and Salty tastes
Taste Sensitivity and Adaptation:
Decrease in sensitivity with age
Rapid adaptation of taste sensation
Role of Saliva in Taste:
Dissolution of tastants to reach receptors
Washing away the stimulus
Taste Preferences and Aversions:
Mechanisms behind taste preference and aversion
Influence of receptors and neural pathways
Impact of Sensory Nerve Damage:
Degeneration of taste buds if the sensory nerve fiber is cut
Abnormalities of Taste Detection:
Conditions: Ageusia, Hypogeusia, Dysgeusia (parageusia)
Causes: Nerve damage, neurological disorders, infections, poor oral hygiene, adverse drug effects, deficiencies, aging, tobacco use, altered neurotransmitter levels
Neurotransmitters and Taste Threshold:
Effects of serotonin (5-HT) and norepinephrine (NE) on taste sensitivity
Supertasters:
25% of the population with heightened sensitivity to taste, especially bitterness
Increased number of fungiform papillae
Ozempic: Preoperative Management of Patients on GLP-1 Receptor Agonists Saeid Safari
Preoperative Management of Patients on GLP-1 Receptor Agonists like Ozempic and Semiglutide
ASA GUIDELINE
NYSORA Guideline
2 Case Reports of Gastric Ultrasound
Acute scrotum is a general term referring to an emergency condition affecting the contents or the wall of the scrotum.
There are a number of conditions that present acutely, predominantly with pain and/or swelling
A careful and detailed history and examination, and in some cases, investigations allow differentiation between these diagnoses. A prompt diagnosis is essential as the patient may require urgent surgical intervention
Testicular torsion refers to twisting of the spermatic cord, causing ischaemia of the testicle.
Testicular torsion results from inadequate fixation of the testis to the tunica vaginalis producing ischemia from reduced arterial inflow and venous outflow obstruction.
The prevalence of testicular torsion in adult patients hospitalized with acute scrotal pain is approximately 25 to 50 percent
Title: Sense of Smell
Presenter: Dr. Faiza, Assistant Professor of Physiology
Qualifications:
MBBS (Best Graduate, AIMC Lahore)
FCPS Physiology
ICMT, CHPE, DHPE (STMU)
MPH (GC University, Faisalabad)
MBA (Virtual University of Pakistan)
Learning Objectives:
Describe the primary categories of smells and the concept of odor blindness.
Explain the structure and location of the olfactory membrane and mucosa, including the types and roles of cells involved in olfaction.
Describe the pathway and mechanisms of olfactory signal transmission from the olfactory receptors to the brain.
Illustrate the biochemical cascade triggered by odorant binding to olfactory receptors, including the role of G-proteins and second messengers in generating an action potential.
Identify different types of olfactory disorders such as anosmia, hyposmia, hyperosmia, and dysosmia, including their potential causes.
Key Topics:
Olfactory Genes:
3% of the human genome accounts for olfactory genes.
400 genes for odorant receptors.
Olfactory Membrane:
Located in the superior part of the nasal cavity.
Medially: Folds downward along the superior septum.
Laterally: Folds over the superior turbinate and upper surface of the middle turbinate.
Total surface area: 5-10 square centimeters.
Olfactory Mucosa:
Olfactory Cells: Bipolar nerve cells derived from the CNS (100 million), with 4-25 olfactory cilia per cell.
Sustentacular Cells: Produce mucus and maintain ionic and molecular environment.
Basal Cells: Replace worn-out olfactory cells with an average lifespan of 1-2 months.
Bowman’s Gland: Secretes mucus.
Stimulation of Olfactory Cells:
Odorant dissolves in mucus and attaches to receptors on olfactory cilia.
Involves a cascade effect through G-proteins and second messengers, leading to depolarization and action potential generation in the olfactory nerve.
Quality of a Good Odorant:
Small (3-20 Carbon atoms), volatile, water-soluble, and lipid-soluble.
Facilitated by odorant-binding proteins in mucus.
Membrane Potential and Action Potential:
Resting membrane potential: -55mV.
Action potential frequency in the olfactory nerve increases with odorant strength.
Adaptation Towards the Sense of Smell:
Rapid adaptation within the first second, with further slow adaptation.
Psychological adaptation greater than receptor adaptation, involving feedback inhibition from the central nervous system.
Primary Sensations of Smell:
Camphoraceous, Musky, Floral, Pepperminty, Ethereal, Pungent, Putrid.
Odor Detection Threshold:
Examples: Hydrogen sulfide (0.0005 ppm), Methyl-mercaptan (0.002 ppm).
Some toxic substances are odorless at lethal concentrations.
Characteristics of Smell:
Odor blindness for single substances due to lack of appropriate receptor protein.
Behavioral and emotional influences of smell.
Transmission of Olfactory Signals:
From olfactory cells to glomeruli in the olfactory bulb, involving lateral inhibition.
Primitive, less old, and new olfactory systems with different path
New Drug Discovery and Development .....NEHA GUPTA
The "New Drug Discovery and Development" process involves the identification, design, testing, and manufacturing of novel pharmaceutical compounds with the aim of introducing new and improved treatments for various medical conditions. This comprehensive endeavor encompasses various stages, including target identification, preclinical studies, clinical trials, regulatory approval, and post-market surveillance. It involves multidisciplinary collaboration among scientists, researchers, clinicians, regulatory experts, and pharmaceutical companies to bring innovative therapies to market and address unmet medical needs.
These lecture slides, by Dr Sidra Arshad, offer a quick overview of physiological basis of a normal electrocardiogram.
Learning objectives:
1. Define an electrocardiogram (ECG) and electrocardiography
2. Describe how dipoles generated by the heart produce the waveforms of the ECG
3. Describe the components of a normal electrocardiogram of a typical bipolar leads (limb II)
4. Differentiate between intervals and segments
5. Enlist some common indications for obtaining an ECG
Study Resources:
1. Chapter 11, Guyton and Hall Textbook of Medical Physiology, 14th edition
2. Chapter 9, Human Physiology - From Cells to Systems, Lauralee Sherwood, 9th edition
3. Chapter 29, Ganong’s Review of Medical Physiology, 26th edition
4. Electrocardiogram, StatPearls - https://www.ncbi.nlm.nih.gov/books/NBK549803/
5. ECG in Medical Practice by ABM Abdullah, 4th edition
6. ECG Basics, http://www.nataliescasebook.com/tag/e-c-g-basics
Ethanol (CH3CH2OH), or beverage alcohol, is a two-carbon alcohol
that is rapidly distributed in the body and brain. Ethanol alters many
neurochemical systems and has rewarding and addictive properties. It
is the oldest recreational drug and likely contributes to more morbidity,
mortality, and public health costs than all illicit drugs combined. The
5th edition of the Diagnostic and Statistical Manual of Mental Disorders
(DSM-5) integrates alcohol abuse and alcohol dependence into a single
disorder called alcohol use disorder (AUD), with mild, moderate,
and severe subclassifications (American Psychiatric Association, 2013).
In the DSM-5, all types of substance abuse and dependence have been
combined into a single substance use disorder (SUD) on a continuum
from mild to severe. A diagnosis of AUD requires that at least two of
the 11 DSM-5 behaviors be present within a 12-month period (mild
AUD: 2–3 criteria; moderate AUD: 4–5 criteria; severe AUD: 6–11 criteria).
The four main behavioral effects of AUD are impaired control over
drinking, negative social consequences, risky use, and altered physiological
effects (tolerance, withdrawal). This chapter presents an overview
of the prevalence and harmful consequences of AUD in the U.S.,
the systemic nature of the disease, neurocircuitry and stages of AUD,
comorbidities, fetal alcohol spectrum disorders, genetic risk factors, and
pharmacotherapies for AUD.
Prix Galien International 2024 Forum ProgramLevi Shapiro
June 20, 2024, Prix Galien International and Jerusalem Ethics Forum in ROME. Detailed agenda including panels:
- ADVANCES IN CARDIOLOGY: A NEW PARADIGM IS COMING
- WOMEN’S HEALTH: FERTILITY PRESERVATION
- WHAT’S NEW IN THE TREATMENT OF INFECTIOUS,
ONCOLOGICAL AND INFLAMMATORY SKIN DISEASES?
- ARTIFICIAL INTELLIGENCE AND ETHICS
- GENE THERAPY
- BEYOND BORDERS: GLOBAL INITIATIVES FOR DEMOCRATIZING LIFE SCIENCE TECHNOLOGIES AND PROMOTING ACCESS TO HEALTHCARE
- ETHICAL CHALLENGES IN LIFE SCIENCES
- Prix Galien International Awards Ceremony
5. ETYMOLOGY
• 1. DEMOS - People.
• 2. GRAPHO - To write.
• The word was coined by JOHN
GRUNT
6. DEFINITION
• Demography is the "study of
human populations in relation to
the changes brought about by the
interplay of births, deaths, and
migration" PRESSAT
8. • Demography is the "statistical and
mathematical study of the size,
composition and spatial
distribution of human populations,
and of the changes over time, in
these aspects through the
operation of the five processess of
fertility, mortality, marriage,
migration and social mobility" -
BOGUE
9. CONCEPT & SCOPE
• Demography is the branch of
social size, structure, which deals
with the study of size, structure
and distribution of populations,
along with the spatial and temporal
changes in them in response to
birth, migration, ageing and death.
11. • Life expectancy. (LE)
• Total Fertility Rate. (TFR)
• Gross Reproduction Rate.(GRR)
• Net Reproduction Rate. (NRR)
12. SCOPE OF DEMOGRAPHY
• Demography is the science of
population. In it's most general
meaning, a population is a set of
people who live in a specific land
area : a commune, a district, a
country or a continent,etc.
• A formal demography is concerned
with the size, distribution, structure
and changes of population
13. SIZE
• Is the number of units (inhabitants)
in the population
14. DISTRIBUTION
• Is the arrangement of the
population at a given time,
geographically or among various
types of residential areas.
15. STUCTURE
• Is the distribution of characteristics
such as age, gender groups etc
among the population.
• Additional characteristics of the
uinits such as marital status,
occupation educational level, ethnic
characteristics, socio economic
status etc.
16. CHANGE
• Is the increase or decrease of
the total population or of the
one of it's structural units.
17. NARROW SCOPE
• Population is constantly
changing over time.
• The components of change in a
population are births, deaths
and migration.
18. • Thus one generation will be
replaced by another younger
generation by birth and death
process.
• This is a natural change or
demographic reproduction.
19. BROADER SCOPE
• The broader scope of
demographic reproduction
includes migration. It means
the movement of people from
place to place.
• Migration has great influence
on population change.
20. • Within a country or an area, this
movement does not affect the total
size of the population.
• It changes the structure of the
population and area as well as the
living conditions of immigrants and
out-migrants.
21. • This process may also influence
the behaviour of the inhabitants,
especially out migrants.
• Migrations have great influence on
population change.
22. • A balancing equation of population
change in time that involves the
relationship between birth, death
and migration is as follows.
• P1 = P0 + (B - D) + (I - O):
• where, P1 & P0 : Population at the
ending & begening point.
• B = # of Births in a period.
• D = # of Deaths in a period.
• I = # of In - migrants.
• O = # 0f Out - migrants
23. DEMOGRAPHIC CYCLE
• Demography cycle has five stages:
• HIGH STATIONARY.
• EARLY EXPANDING.
• LATE EXPANDING.
• LOW STATIONARY.
• DECLINING.
25. DEMOGRAPHY CYCLE
HIGH STATIONARY.
EARLY EXPANDING.
LATE EXPANDING.
LOW STATIONARY.
DECLINING.
High Birth Rate
High Death Rate
Unchanged Birth Rate
Decline Death Rate
Fall in Birth Rate
Death Rate further
Low Birth Rate
Low Death Rate
Birth rate lower than
Death Rate
26. STAGES OF DEMOGRAPHY
CYCLE & COUNTRIES
High Stationary High High India (1920)
Early Expanding Unchanged Decline
South Asia,
Africa
Late Expanding Fall
Further
Decline
China,
Singapore, India
Low Stationary Low Low
Austria (1980-
1985)
Declining Further lowers Unchanged
Germany,
Hungary
STAGE BIRTH RATE DEATH RATE COUNTRIES
27. DEMOGRAPHIC INDICATORS
• 1. Measurement of Mortality.
• 2. Measurement of Morbidity.
• 3. Measurement of disability.
• 4. Measurement of natality.
• 5. Measurement of the presence,
absence or distribution of the
characteristics or attributes of the
disease.
28. • 6. Measurement of medical needs,
health care facilities, utilization of
health services and other health
related events.
• 7. Measurement of the presence,
absence or distributionof the
environmental and other factors
suspected of causing the disease.
30. TOOLS OF MEASUREMENT
• An epidemiologist usually
expresses the health event as
RATES, RATIOS or PROPOTION.
31. RATE
• A rate measures the occurence
of some particular event in a
population during a given
period of time period.
• It is the statement of the risk of
of developing a condition.
32. • It indicates the change in some event
that takes place in a population over a
period of time.
•
X 1000
DEATH RATE = NUMBER OF DEATHS
MID YEAR POP
X 1000
34. • A rate comprises the following
elements.
• 1. Numerator.
• 2. Denominator.
• 3. Multiplier.
35. The time dimension is usually a
calender year.
The rate is expresses per 1000 or
some round figure.(selected
according to convenience or
convention to avoid fraction).
36. RATIO
• Ratio expresses a relation in
size between two random
quantities.
E.g., x : y (or) x/y.
37. • The numerator is not a component
of the denominator.
• The numerator and denominator
may involve an interval of time or
may be simultaneous in time.
The number of children with scabies at a
certain time.
The number of children with malnutrition
at a certain time
38. PROPORTION
• A Proportion is a ratio which
indicates the relation in magnitude
of a part of the whole.
• The numerator is always included
in the denominator.
• A Proportion is usually expressed
as percentage.
39. Example
The number of children with
scabies at a certain time.
The total number of children in
the village at the same time
x 100
40. MEASUREMENTS OF
MORTALITY
• Mortality refers to the number of
deaths in a given time or a place or
a proportion odf deaths in relation
to a population.
• E.g., : 1. Crude Death Rate.
2. Infant Mortality Rate.
3. Maternal Mortality Rate
4. Life Expectancy.
41. MEASUREMENTS OF
MORBIDITY
• It refers to diseases and illness,
injuries and disabilities in a
population.
• Data on the frequency and
distribution of a disease helps in
controlling its spread, and in some
cases it may lead to the
identification of cases.
42. Example
• 1. Case Rate : The case rate is
the number of reported cases
of a specific disease or illness
per 100,000 population during a
given year.
43. • 2. Case Fatality Rate : The Case
Fatality Rate is the proportion
of persons contacting a
disease who die of that disease
during a specified time period.
44. MEASUREMENT OF
DISABILITY
• Dependancy Ratio : The ratio of the
economically dependent part of the
population to the productive part;
arbitrarily defined as the ratio of
the elderly ( ages 65 and older)
plus the young (under age 15) to
the population in the "working
ages".
45. MEASUREMENTS OF
NATALITY
• Natality in population ecology is
the scientific term for Birth Rate.
• Along with mortality rate, natality
rate is used to calculate the
dynamics of a population.
46. • They are the key factors in
determining whether a population
is increasing, decreasing or
staying the same in size.
• Natality is the greatest influence on
a population’s increase.
47. • Natality is shown as a crude birth rate
or specific birth rate. Crude Birth Rate
is used when calculating population
size (number of births per 1000
population/year).
• whereas Specific Birth Rate is used
relative to a specific criterion such as
age. By calculating specific birth rate,
the results are seen in an age-specific
schedule of births.
51. GENERAL MARITAL
FERTILITY RATE (GMFR)
NUMBER OF LIVE BIRTHS
DURING A YEAR.
MID YEAR MARRIED FEMALE
POP (15-49) YRS
GMFR = X 1000
52. AGE SPECIFIC FERTILITY
RATE (ASFR)
NUMBER OF LIVE BIRTHS IN A
PARTICULAR AGE GROUP.
MID YEAR POP OF THE
SAME AGE GROUP
ASFR = X 1000
53. AGE SPECIFIC MARITAL
FERTILITY RATE (ASMFR)
NUMBER OF LIVE BIRTHS IN A
PARTICULAR AGE GROUP.
MID YAER POP OF THE SAME AGE
GROUP.
ASMFR = X 1000
54. TOTAL FERTILITY RATE
(TFR)
• It is the average number of children
a women can give birth throughout
the reproductive period.
• It is represented by summing the
age specific fertility rates for all
ages; if 5 - year age groups are
used, the sum of the rates is
multiplied by 5.
56. TOTAL MARITAL
FERTILITY RATE (TMFR)
Average number of children
that would be born to a married
women if she experiences the
current fertility pattern through
her reproductive span.
58. GROSS REPRODUCTION
RATE (GFR)
• Average number of girls that would
be borne to a women if she
experiences the curent fertility
pattern throught her reproductive
span (15 - 49 years) having no
mortality.
59. NET REPRODUCTIVE
RATE (NRR)
• NRR is defined as the number of
daughters a new borne girl will
bear during her lifetime assuming
fixed age-specific fertility and
mortality rates.
• At presesnt in India NRR is about
1.5
60. • If NRR is < 1, then the reproductive
performance of the population is
said to be below replacement level.
61. MARRIAGE RATES
• The marriage rate (CRUDE
MARRIAGE RATE) is the
number of marriages per 1000
total population in a given year.
63. CHILD WOMAN RATIO
• Is the number of children 0 - 4
yrs of age per 1000 women of
child bearing age.
64. PREGNANCY RATE.
• It is the ratio of number of
pregnancies in a year to married
women in the ages 15-49 yrs.
• The "number of pregnancies"
includes all pregnancies, whether
or had terminated as live births,
stillbirths or abortions or had not
yet terminated.
65. ABORTION RATE
• The annual number of all types
of abortions, usually per 1000
women of child bearing age
(15-19 yrs).
66. ABORTION RATIO
• This is calculated by dividing
the number of abortions
performed during a particular
time period by the number of
live births over the same
period.
69. SPECIFIC DEATH RATE IN
AGE GROUP 15-20 YRS
NUMBER OF DEATHS OF
PERSONS AGED 15-20
DURING A CALENDER
YEAR.
MID YEAR POPULATION OF
PERSONS AGED 15-20
SPECIFIC DEATH
RATE (15-20 YRS) = X 1000
76. INFANT MORTALITY RATE
(IMR)
NUMBER OF DEATHS OF
CHILDREN LESS THAN 1
YEAR OF AGE IN A YEAR
NUMBER OF LIVE BIRTHS
IN THE SAME YEAR
X 1000IMR =
77. ATTACK RATE
NUMBER OF NEW CASES OF
A SPECIFIED DISEASE
DURING A SPECIFIED TIME
INTERVAL
TOTAL POPULATION AT RISK
DURING THE SAME
INTERVAL
X 100AR =
78. STILL BIRTH RATE (SBR)
FOETAL DEATHS WEIGHING
OVER 1000g AT BIRTH
DURING THE YEAR
TOTAL LIVE + STILL BIRTHS
WEIGHING OVER 1000g AT
BIRTH DURING THE YEAR
X 1000SBR =
79. PERINATAL MORTALITY
RATE (PMR)
LATE FOETAL AND EARLY
NEO NATAL DEATHS
WEIGHING OVER 1000g
AT BIRTH
TOTAL LIVE BIRTHS
WEIGHING OVER 1000g
AT BIRTH
X 1000PMR =
81. POST NEONATAL
MORTALITY RATE
NUMBER OF DEATHS OF
CHILDREN BETWEEN 28
DAYS AND ONE YEAR OF
AGE IN A GIVEN YEAR
TOTAL LIVE BIRTHS IN THE
SAME YEAR
X 1000PNMR =
82. CHILD DEATH RATE
NUMBER OF DEATHS OF
CHILDREN AGED 1-4
YEARS DURING A YEAR
TOTAL NUMBER OF
CHILDREN AGED 1-4
YEARS AT THE MIDDLE
OF THE YEAR
X 1000CDR =
83. CHILD MORTALITY RATE
NUMBER OF DEATHS OF
CHILDREN LESS THAN 5
YEARS OF AGE IN A
GIVEN YEAR
NUMBER OF LIVE BIRTHS
IN THE SAME YEAR
X 1000CMR =
85. MATERNAL MORTALITY
RATIO
TOTAL NUMBER OF FEMALE DEATHS
DUE TO COMPLICATIONS OF
PREGNANCY, CHILDBIRTH OR
WITHIN 42 DAYS OF DELIVERY
FROM PUERPERAL CAUSES IN AN
AREA DURING A GIVEN YEAR
TOTAL NUMBER OF LIVE BIRTHS IN
THE SAME AREA AND YEAR
X 1000 /
100000MMR =
86. DISABILITY RATES
• INDICATORS USED TO MEASURE
DISABILITY :
1. SULLIVAN INDEX
2. HEALTH ADJUSTED LIFE
EXPECTANCY (HALE).
3. DISABILITY ADJUSTED LIFE
YEAR
88. HEALTH ADJUSTED LIFE
EXPECTANCY (HALE)
• Is an indicator of health which
measures healthy life expectancy.
• HALE is equivalent to the number
of years newborn child expected to
live with full health.
89. DISABILITY ADJUSTED LIFE
YEAR (DALE)
• Is used to express the years of life
lost to premature death and years
lived with disability for severity of
disability.
• ONE DALY = ONE LOST YEAR OF
HEALTHY LIFE
90. CASE RATE
Number of reported
cases of a specific
disease or illness
100,000 population
during a given year
91. EMIGRATION RATE
NUMBER OF EMIGRANTS
DEPARTING AN AREA OF
ORIGIN
1000 POPULATION AT THAT
AREA OF ORIGIN IN A GIVEN
YEAR
92. NET EMIGRATION RATE
The net effect of immigration and
emigration on an area's population
(increase or decrease) is refered to
as net migration.
The net migration shows the net
effect of immigration & emigration
on an area's population of the area
in a given year.
93. GROWTH RATE
The growth rate is the rate at which a
population is increasing (or
decreasing) in a given year due to
natural increase and net migration,
expressed as a percentage of the base
population.
• The growth rate takes in to account all
components of population growth:
births, deaths and migration.
94. LIFE EXPECTANCY
The number of years which an
individual at a given age could
expect to live, at present
mortality levels
95. USES OF DEMOGRAPHIC
DATA
• Analysis patterns and trends
related to human religion,
nationality, education and
ethnicity.
• Estimates are reliable standards
for judging the accuracy of the
census information gathered at
any time.
96. • Estimates size and flow of
populations of workers; in
population ecology, the focus is on
birth, death and movement of firms
and institutional forms.
• Uses administrative records to
develop an independent estimate
of the population.
97. • Provides insight into the links
between these characteristics and
cultural, economic, geographic and
other social attributes present in a
given area.
• Demographic analysis is a
powerful tool that can explain a
number of sociological
phenomena.
98. • Used to estabilish the percentage
of the total population involved in a
particular resource use activity,
such as fishing or tourism.
• Apply to whole societies or to
groups defined by criteria such as
education, nationality, religion and
ethnicity.
99. • Analyzes the relationship between
economic, social, cultural and
biological proceses influencing a
population.
• Time and age have special
relationships in popultion studies,
from which cross sectional and
cohort analysis are developed.
100. • Relates to whole societies or to a
smaller groups defined bycriteria
such as education, religion or
ethnicity.
• Develops targeted outreach and
training activities for local
communities.
102. DEFINITION
• Heath Information or Medical
Statistics refers to any quantifyable
and non quantifiable information
that can be used by health decision
makers and clinicians to better
understand disease process and
health care issues, and to prevent,
diagnose or treat health problems.
103. • Medical statistics deals with the
application of bio statistics to
medicine and the health sciences,
including epidemiology, public
health, forensic medicine and
clinical research.
104. • A HIS system refers to inter
related component parts for
acquiring and analysing data and
providing information for the
management of a health
programme or system and for
monitoring health services
105.
106.
107. SOURCES OF HEALTH
INFORMATION
• The main population based
sources of health information are
as follows :
• 1. Census.
• 2. Household Surveys.
• 3. Sample Registration System.
• 4. Notification of Diseases'.
• 5. Hospital Records.
112. • 6. Disease Registers.
• 7. Record Linkage.
• 8. Epidemiological Surveillence.
• 9. Other Health Service Records.
• 10. Environmental Health Data.
• 11. Population Surveys.
• 12. Other routine statistics related
to health.
• 13. Non quantifiable information.
124. DIRECT METHOD
1. VITAL STATISTICS REGISTRIES:
A. BIRTHS & DEATHS.
B. CENSUS.
C. LEGAL STATUS (Marriage,
divorce and migration)
125. CENSUS
• Census is taken typically every 10
yrs.
• Census are also used as direct
source of information about
fertility and mortality.
126. • The census is commonly
performed by a government
agency and the methodology used
is the individual or household
enumeration.
• In India the first census was taken
in the year 1901 on March 1st.
• The latest census was taken in the
year 2001 on March 1st.
127. The purposes for census include :
1. As a basis for taxation.
2. As a basis for political
representation.
128.
129. INDIRECT METHOD
• THERE ARE SEVERAL METHODS
AS FOLLOWS:
• 1. SISTER METHOD: The survey
researchers ask women how many
of their sisters have died or had
children and at what age.
130. • 2. OTHER INDIRECT METHOD
include asking people about
siblings, parents and
children.
• 3. RESEARCH SURVEY.
• 4. NATIONAL SAMPLE SURVEY
• 5. SAMPLE REGISTRATION
SURVEY.
131. • 6. DEMOGRAPHIC METHODS :
• MODELS OF MORTALITY - Life
table, Gompertz models, hazards
models, multiple decrement life
tables, Brass relational logits.
MODELS OF FERTILITY - Hernes
model, Coal-Trussell models,
parity progression ratios.
132. • MODELS OF MARRIAGE :
Singulate Mean at marriage, Page
model.
• MODELS OF DISABILITY :
SAULLIVAN'S METHOD,
MULTISTATE LIFE TABLES.
134. APPLICATION-METHODS
OF DATA COLLECTION
I. PRIMARY DATA
collection is done by the individual
using:
1. Interviews.
2. Observation.
3. Questionnaires.
4. Diaries.
5. Critical incidents.
135. • SECONDARY DATA collection is
done by :
1.Census.
2. National Survey.
3. Registration of vital events.
4. Demographic studies.
5. Records.
141. INTERVIEWS
• Interviews are undertaken on
personal, one to one basis or in a
group.The advantages of interview
method are as follows.
1.It is the best means to collect an
indepth information.
2.The feedback and response rate is
good.
142. 3.The information is recorded
immediately and complete.
4. Help can be provided immediately.
143. DISADVANTAGES OF
INTERVIEW
1. It is expensive and time
consuming.
2. Training is required in case of
employing many interviewers.
3. Pre fixed questionnaire are
required.
144. TYPES OF INTERVIEWS
• An interview can be of three types:
1. STRUCTURED.
2. SEMI STRUCTURED
3. UNSTRUCTURED.
145. OBSERVATION
• Is a method to record behavioural
pattern of people in a systematic
manner.
• The methods of observation
include: structured, un structured,
natural, personal, mechanical,
participant or non participant
observations.
146. • Observation method provides
information on what is actually
observed.
• Bias in observation method can be
eliminated by two observers.
• Hence this method has limitations
in eliciting accurate information.
147. QUESTIONNAIRES
• Questionnaire is a common
method of data collection.
• It takes time and expertise to
prepare a structured questionnaire.
148. • The questionnaire can be used to
interview for a direct data
collection or a telephonic survey
could be conducted.
• It can be posted, emailed or faxed.
• The main advantage of this method
is that there is no bias.
149. • The use of questionnaire is simple
but requires a certain level of
education and skill from
respondents.
150. DIARIES
• Diaries are used to record data
obtained from the individuals.
• The data expressed in the diaries
are an indepth information and can
be used for reseaech purposes.
151. CRITICAL INCIDENTS
• The critical incidents relating to
health - illness event is recorded
and used for arriving desicions
and policies regarding health
matters.
152. II.SECONDARY DATA
• The secondary data is collected
indirectly (not from inviduals) from
other sources such as hospital
records, census data etc.
153. SOURCES OF
DEMOGRAHIC DATA
• Census.
• Natioal Survey.
• Registration of vital events.
• Demographic studies.
• Records.
155. CENSUS
• Census is the direct method of
collection of demographic data.
• Census is conducted by the
government every 10 yrs.
156. • Census is an attempt to contact
every member of the population in
a country.
• Census not only provides
information regarding the number
of people, but other relevant
information (age, gender, marital
status, occupation, education,
employment status, migration,
language, religion etc.)
157. • A census covers social &
economic aspects of a population.
• It is conducted at the end of first
quarter of each decade.
• The census commisioner of India
guides, operates, and directs the
census.
158. REGISTRATION OF VITAL
EVENTS
• Registration of vital events is the
basis of vital statistics.
• Vital events refers to births, death,
migration, marriages, divorces,
foetal deaths are registration in
India.
159. • In 1873, Govt of India passed the
Birth, Deaths & Marriage
Registration Act.
• Indian states such as Karnataka,
Tamil Nadu etc have passed their
own acrs related to registration of
vital events.
160. • The main drawback in this
registration process is that it has
the provision only for voluntary
registration.
• So data is not accurate and
complete as people do not
voluntarily get the birth, death or
marriages registered.
• The data tends to be unreliable.
161. • The other reasons for
incompleteness include :
1. Illiteracy.
2. Ignorance.
3. Lack of concern.
4. Lack of motivation.
5. Lack of uniformity.
6. Multiple registration agencies.
162. NATIONAL SURVEY
• National Survey refers to the
survey conducted at central level
to collect the information related to
population from various states.
163. DEMOGRAPHIC STUDIES
• Studies conducted on demography
also provide data regarding the
population's education, occupation
etc.
• The demographic studies provide
information about the latest
demographic changes occuring
from time to time.
164. RECORDS
• Records available in hospitals
constitute the basic and primary
source of information about births
and deaths due to specific illness.
• Hospital data provides the
numerator. (not the denominator &
hence is incomplete)
165. ANALYSIS &
INTERPRETATION OF DATA
• The data thus collected should be
aranged in tables, charts,
diagrams, graphs, picture & curves
to stress important points.
• The data presented should be
based on the principles designed
to meet the criteria.
170. CHARACTERISTICS OF A
TABLE
• A table has a title, table number,
rows, coloums, row head, coloum
head.
• The data is presented as discrete
variables or as class intervals or
according to chronological order
or in alphabetical order.
171. CHARTS
• The data collected could be
represented in the form of a chart.
• The data contained in a chart is
more easy to understand and
retained easily than a table.
172. TYPES OF CHARTS :
1. BAR CHARTS. (simple. Compound,
Histogram)
2. LINE DIAGRAMS.
3. PIE CHARTS.
4. PICTOGRAM.
6. STATISTICAL MAP.
7. STATISTICAL AVERAGES &
DISPERSION OF MEASURES OF
VARIATION
174. • Bar charts are easy to prepare.
• They enable values to be
compared at a glance.
• In bar charts, bars proportional to
the magnitude are presented.
175. TYPES OF BAR CHARTS
1. Simple Bar
Chart.
2. Component
Bar Chart.
3. Histogram.
176. SIMPLE CHART
• The simple bar
chart represents
observations
proportional to
the magnitude.
• 2. The bars can
be either vertical
or horizontal.
177. COMPONENT BAR CHART
1. The component
bar chart represents
many components.
2. The representation
could be either as
vertical or as
horizontal bars.
178. HISTOGRAM
1.Histogram is a pictorical
diagram which consists
of series of blocks.
2.If the mid point of
histogrms blocks is
joined, then a line with
fluctuation is seen
3.frequency polygon is
obtained by joining the
mid points of histogram
blocks.
179. LINE DIAGRAM
• Line Diagram show the trend of
events occuring over a pasage of
time in continuation such as rise or
fall of AIDS cases over a period of
5 years.
• i.e. during the year
2000,2001,2002,2003 & 2004,
181. PIE CHART
• Pie charts are diagramatically
represenred in circles with the
radius "O". and at radius angle 360
degree.
• The area of the circle in the form of
segment which depends upon the
angle.
182. • These segments within the circle
are comparable.
• The segments are indicated in
percentages.
• To find out the angle at radius "O"
from the data, can be calculated
using a formula.
184. Example
• 75% of people are literate & 25% of
people are illiterate.
• Angle for literate = 75 /100 x 360 =
270.
• Angle for illiterate = 25 / 100 x 360 =
90.
194. • When there is a
need to indicate the
relationship of two
variables, scattered
diagrams are used.
• A linear relationship
is evident if the dots
are near or around a
straight line.
SCATERRED DIAGRAM
195. STATISTICAL AVERAGES
• Statistical averages refers to the
values in distribution, around
which other values are distributed
such as mean, median & mode.
• These are commonly used
averages which provide an
information of about central value.
198. NORMAL DISTRIBUTION CURVE
• Normal distribution curve is used
to represent the values for a very
large number of people after
creating narrow class intervals
with frequency distribution.
• The shape of the curve is based on
mean and standard deviation.
202. CORRELATION
• A correlation test is
used to find out the
relationship
between two
variables.
• E.g., Relationship
between level of
knowledge and
practice.
203. REGRESSION TEST
• Regression test
is used to find
out the
estimated value
of one variable
from value of
another.
204. INTERPRETATION OF
DATA
• The data collected is analyzed and
interpreted.
• The interpretations are then
generalized to public.
205. • The values interpreted should be in
simple so as to make it
understandable.
• While interpreting, the maximum &
minimum values should be shown
so as to have an estimation in
between.
206. • The data represented shoul be
presents as rates, ratios,
proportions, percentage, mean,
median, mode and normal curve.
• The demographic data are usually
analyzed and interpreted by tables,
charts, diagrams, pie charts,
pictogram etc.