SlideShare a Scribd company logo
Dr.S.Kalpana
Dept of Epidemiology
TNMGRMU
• 1. DEMOS - People.
• 2. GRAPHO - To write.
• The word was coined by JOHN GRUNT
Demography—The study of a population
in its static and dynamic aspects
Demography is the branch of social
size, structure, which deals with
the study of size, structure and
distribution of populations, along
with the spatial and temporal
changes in them in response to
birth, migration, ageing and death.
• Demography is the science of population. In
it's most general meaning, a population is a
set of people who live in a specific land area
: a commune, a district, a country or a
continent,etc.
• A formal demography is concerned with the
size, distribution, structure and changes of
population
DEMOGRAPHY
CYCLE
HIGH STATIONARY.
EARLY EXPANDING.
LATE EXPANDING.
LOW STATIONARY.
DECLINING.
HIGH STATIONARY.
EARLY EXPANDING.
LATE EXPANDING.
LOW STATIONARY.
DECLINING.
High Birth Rate
High Death Rate
Unchanged Birth Rate
Decline Death Rate
Fall in Birth Rate
Death Rate further
Low Birth Rate
Low Death Rate
Birth rate lower than
Death Rate
Static aspects include characteristics at a
point in time such as composition by:
– Age
– Sex
– Race
– Marital status
– Economic characteristics
• 1. Measurement of Mortality.
• 2. Measurement of Morbidity.
• 3. Measurement of disability.
• 4. Measurement of natality.
• 5. Measurement of the presence,
absence or distribution of the
characteristics or attributes of the
disease.
Dynamic aspects are:
– Fertility
– Mortality
– Nuptiality
– Migration
– Growth
1
Demographic Analysis — The study of
components of variation and change in
demographic variables and the
relationships between them
This is also called formal demography
or demographic methods
1
Population Studies—The study of the
relationships between demographic
variables and other variables such as social
and economic variables
An epidemiologist usually expresses
the health event as RATES, RATIOS
or PROPOTION.
• A rate measures the occurrence of
some particular event in a
population during a given period of
time period.
• It is the statement of the risk of of
developing a condition.
It indicates the change in some event
that takes place in a population over a
period of time.
DEATH RATE = NUMBER OF DEATHS
MID YEAR POP
X 1000
Weekly death rate = Deaths in a week x 52
Mid year population
x 1000
• A rate comprises the following
elements.
1. Numerator.
2. Denominator.
3. Multiplier.
The time dimension is usually a
calender year.
The rate is expresses per
1000 or some round
figure.(selected according to
convenience or convention to
avoid fraction).
• Ratio expresses a relation in
size between two random
quantities.
E.g., x : y (or) x/y.
• The numerator is not a component
of the denominator.
• The numerator and denominator
may involve an interval of time or
may be simultaneous in time.
The number of children with scabies at a certain
time.
The number of children with malnutrition at a
certain time
• A Proportion is a ratio which indicates
the relation in magnitude of a part of
the whole.
• The numerator is always included in
the denominator.
• A Proportion is usually expressed as
percentage.
The number of children with scabies
at a certain time.
x 100
The total number of children in the
village at the same time
• Mortality refers to the number of
deaths in a given time or a place
or a proportion odf deaths in
relation to a population.
• E.g., : 1. Crude Death Rate.
2. Infant Mortality Rate.
3. Maternal Mortality Rate
4. Life Expectancy.
• It refers to diseases and illness, injuries
and disabilities in a population.
• Data on the frequency and distribution of a
disease helps in controlling its spread, and
in some cases it may lead to the
identification of cases.
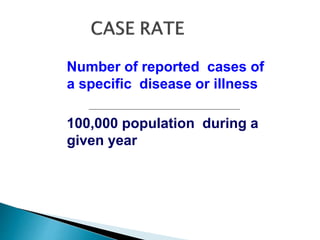
Case Rate :
The case rate is the number of reported
cases of a specific disease or illness
per 100,000 population during a given
year.
Case Fatality Rate : The Case
Fatality Rate is the proportion
of persons contacting a
disease who die of that disease
during a specified time
period.
• Dependancy Ratio : The ratio of the
economically dependent part of the
population to the productive part; arbitrarily
defined as the ratio of the elderly ( ages 65
and older) plus the young (under age 15) to
the population in the "working ages".
• Natality in population ecology is
the scientific term for Birth Rate.
• Along with mortality rate,
natality rate is used to calculate
the dynamics of a population.
• They are the key factors in determining
whether a population is increasing,
decreasing or staying the same in size.
• Natality is the greatest influence on a
population’s increase.
• Natality is shown as a crude birth rate or specific
birth rate.
• Crude Birth Rate is used when calculating
population size (number of births per 1000
population/year).
• whereas Specific Birth Rate is used relative to
a specific criterion such as age.
• By calculating specific birth rate, the results are
seen in an age-specific schedule of births.
NUMBER IF LIVE BIRTHS DURING
THE YEAR.
ESTIMATED MID YEAR
POPULATION
X 1000BIRTH RATE =
NUMBER OF LIVE BIRTHS
DURING A YEAR.
MID YEAR FEMALE POP (15-49)
IN THE SAME YEAR
X 1000GFR =
NUMBER OF LIVE
BIRTHS DURING A
YEAR.
MID YEAR MARRIED FEMALE
POP (15-49) YRS
GMFR = X 1000
NUMBER OF LIVE BIRTHS IN A
PARTICULAR AGE GROUP.
MID YEAR POP OF THE
SAME AGE GROUP
ASFR = X 1000
NUMBER OF LIVE BIRTHS IN A
PARTICULAR AGE GROUP.
MID YAER POP OF THE SAME AGE
GROUP.
ASMFR = X 1000
• It is the average number of children a
women can give birth throughout the
reproductive period.
• It is represented by summing the age
specific fertility rates for all ages; if 5 - year
age groups are used, the sum of the rates is
multiplied by 5.
45 - 49
15 - 19
1000
TFR =
5 X ∑ ASFR
Average number of children that would be
born to a married women if she experiences
the current fertility pattern through her
reproductive span.
45 - 49
15 -19
1000
5 X ∑ ASMFRTMFR =
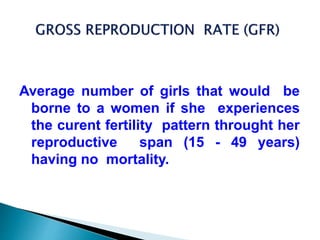
Average number of girls that would be
borne to a women if she experiences
the curent fertility pattern throught her
reproductive span (15 - 49 years)
having no mortality.
• NRR is defined as the number of daughters a
new borne girl will bear during her lifetime
assuming fixed age-specific fertility and
mortality rates.
• If NRR is < 1, then the reproductive
performance of the population is
said to be below replacement
level.
• The marriage rate (CRUDE MARRIAGE
RATE) is the number of marriages per 1000
total population in a given year.
NUMBER OF MARRIAGES IN
THE YEAR
MID YEAR POPULATION
MR = X 1000
• Is the number of children 0 -
4 yrs of age per 1000 women
of child bearing age.
• It is the ratio of number of
pregnancies in a year to married
women in the ages 15-49 yrs.
• The "number of pregnancies"
includes all pregnancies, whether
or had terminated as live births,
stillbirths or abortions or had not
yet terminated.
• The annual number of all
types of abortions, usually
per 1000 women of child
bearing age (15-19 yrs).
• This is calculated by dividing
the number of abortions
performed during a
particular timeperiod by
the number of live births
over the same
period.
NUMBER OF DEATHS DURING A
YEAR
X 1000
MID YEAR POPULATION
CDR =
NUMBER OF DEATHS FROM TB DURING A
CALENDER YEAR.
MID YEAR POPULATION
SDR = X 1000
NUMBER OF DEATHS OF
PERSONS AGED 15-20
DURING A CALENDER
MID YEAR POPULATION OF
PERSONS AGED 15-20
SPECIFIC DEATH
RATE (15-20 YRS) = YEAR. X 1000
TOTAL NUMBER OF DEATHS
DUE TO A PARTICULAR
DISEASE
CFR = X 100
TOTAL NUMBER OF CASES
DUE TO THE SAME DISEASE
NUMBER OF DEATHS
FROM THE SPECIFIC
DISEASE IN A YEAR
TOTAL DEATHS FROM
ALL CAUSES IN THAT
YEAR
X 100PMR =
TOTAL NUMBER OF PATIENTS
ALIVE AFTER 5 YEARS
TOTAL NUMBER OF PATIENTS
DIAGNOSED OR TREATED
SURVIVAL
RATE = X 100
OBSERVED DEATHS
EXPECTED DEATHS
SMR = X 100
NUMBER OF DEATHS OF
CHILDREN LESS THAN 1
YEAR OF AGE IN A YEAR
NUMBER OF LIVE BIRTHS
IN THE SAME YEAR
X 1000IMR =
NUMBER OF NEW CASES OF
A SPECIFIED DISEASE
DURING A SPECIFIED TIME
INTERVAL
TOTAL POPULATION AT RISK
DURING THE SAME
INTERVAL
X 100AR =
FOETAL DEATHS WEIGHING
OVER 1000g AT BIRTH
DURING THE YEAR
TOTAL LIVE + STILL BIRTHS
WEIGHING OVER 1000g AT
BIRTH DURING THE YEAR
X 1000SBR =
LATE FOETAL AND EARLY
NEO NATAL DEATHS
WEIGHING OVER 1000g
AT BIRTH
TOTAL LIVE BIRTHS
WEIGHING OVER 1000g
AT BIRTH
X 1000PMR =
NUMBER OF DEATHS
OF CHILDREN
UNDER 28 DAYS OF
AGE IN A YEAR
TOTAL LIVE BIRTHS IN
THE SAME YEAR
X 1000NMR =
NUMBER OF DEATHS OF
CHILDREN BETWEEN 28
DAYS AND ONE YEAR OF
AGE IN A GIVEN YEAR
TOTAL LIVE BIRTHS IN THE
SAME YEAR
X 1000PNMR =
NUMBER OF DEATHS OF
CHILDREN AGED 1-4
YEARS DURING A YEAR
TOTAL NUMBER OF
CHILDREN AGED 1-4
YEARS AT THE MIDDLE
OF THE YEAR
X 1000CDR =
NUMBER OF DEATHS OF
CHILDREN LESS THAN 5
YEARS OF AGE IN A
GIVEN YEAR
NUMBER OF LIVE BIRTHS
IN THE SAME YEAR
X 1000CMR =
1000 - UNDER 5
MORTALITY RATE
10
TOTAL NUMBER OF FEMALE DEATHS DUE TO COMPLICATIONS
OF PREGNANCY, CHILDBIRTH OR WITHIN 42 DAYS OF
DELIVERY FROM PUERPERAL CAUSES IN AN AREA
DURING A GIVEN YEAR
TOTAL NUMBER OF LIVE BIRTHS IN THE SAME AREA
AND YEAR
X 1000 /
100000
MMR =
INDICATORS USED TO MEASURE DISABILITY :
1. SULLIVAN INDEX
2. HEALTH ADJUSTED LIFE EXPECTANCY (HALE).
3. DISABILITY ADJUSTED LIFE YEAR
SULLIVAN INDEX
LIFE EXPECTANCY - (PROBABLE DURATION
OF BED DISABILITY + INABILITY TO
PERFORM MAJOR ACTIVITIES)
• Is an indicator of health which
measures healthy life expectancy.
• HALE is equivalent to the number
of years newborn child expected
to live with full health.
• Is used to express the years of
life lost to premature death and
years lived with disability for
severity of disability.
• ONE DALY = ONE LOST YEAR OF
HEALTHY LIFE
Number of reported cases of
a specific disease or illness
100,000 population during a
given year
NUMBER OF EMIGRANTS DEPARTING
AN AREA OF ORIGIN
1000 POPULATION AT THAT AREA OF
ORIGIN IN A GIVEN YEAR
The net effect of immigration and
emigration on an area's population
(increase or decrease) is refered to as
net migration.
The net migration shows the net effect
of immigration & emigration on an
area's population of the area in a given
year.
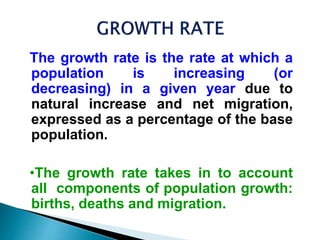
The growth rate is the rate at which a
population is increasing (or
decreasing) in a given year due to
natural increase and net migration,
expressed as a percentage of the base
population.
•The growth rate takes in to account
all components of population growth:
births, deaths and migration.
The number of years which an
individual at a given age could
expect to live, at present
mortality levels
• Analysis patterns and trends related to human religion,
nationality, education and ethnicity.
• Estimates are reliable standards for judging the accuracy of
the census information gathered at any time.
• Estimates size and flow of populations of workers; in
population ecology, the focus is on birth, death and movement
of firms and institutional forms.
• Uses administrative records to develop an independent
estimate of the population.
• Provides insight into the links between these
characteristics and cultural, economic, geographic
and other social attributes present in a given area.
• Demographic analysis is a powerful tool that can
explain a number of sociological phenomena.
All live-born infants should be
registered and counted as such
irrespective of gestational age or
whether alive or dead at time of
registration, and if they die at any
time following birth they should also
be registered and counted as deaths
The United Nations recommends that
the following be collected at a
minimum for live birth registration:
– Data on event
•Date of occurrence
•Date of registration
•Place of occurrence
•Type of birth/delivery
•Attendance at birth
Data on infant:
– Sex
– Legitimacy status
– Weight at birth
81
Data on mother:
– Age or date of birth
– Number of previous children born alive
– Date of marriage or duration of
marriage
– Place of usual residence
Death—Permanent disappearance of
all evidence of life at any time after
live birth has taken place (post-natal
cessation of vital functions without
capability of resuscitation)
This definition excludes fetal deaths
83
Fetal Death—Death prior to the
complete expulsion or extraction from
its mother of a product of conception,
irrespective of the duration of
pregnancy
 Three major categories of fetal deaths
recommended by WHO:
– Early fetal death: < 20 completed weeks of
gestation
– Intermediate fetal death:  20 but  28
weeks
– Late fetal death:  28 weeks
Stillbirth—Late fetal death
To be used only if essential for national
purposes
 The following be collected at the minimum for
death registration
– Data on event:
• Date of occurrence
• Date of registration
• Place of occurrence
• Cause of death
• Certifier
 Data on decedent:
– Age or date of birth
– Sex
– Marital status
– Occupation
– Place of usual residence
 Knowledge of certifier
 Certifier may never see deceased
 “Garbage codes”: missing, senility, etc . . .
 Heart versus brain function loss in the definition of
death
 Bleeding
 Burnt and scalded
 Drowned
 Excessive drinking
 Frightened
 Grief
 Hanging
 Killed by several
accidents
 Murdered
 Poisoned
 Smothered
 Shot
 Starved
 Vomiting
 Note: causes of death can be regrouped in smaller
categories than in ICD
– e.g., Preston’s classification of causes of death in 12
categories
 Marriage—Ceremony or process by which the legal
relationship of husband and wife is constituted
 The legality of the union may be established by civil,
religious, or other means as recognized by the laws of each
country
 The following be collected at a minimum for marriage
registration:
– Data on event
• Date of occurrence
• Date of registration
• Place of occurrence
• Type of marriage—civil, religious, customary
34
 Data on bride and groom
– Age or date of birth
– Previous marital status
– Place of usual residence
 Divorce—Final legal dissolution of a marriage, that is,
that separation of husband and wife which confers
on the parties the right to remarriage under civil,
religious and/or other provisions, according to the
laws of each country
 Demography is the study of a population in its
static and dynamic aspects
 Civil registration is a system developed to collect
data on vital events (live births, deaths,
marriages and divorces) happening to a
population
 Civil registration is continuous and universal (it
should give small area data)
 There are advantages and disadvantages to the
system and its completeness varies widely
between countries and continents
Censuses
Census—The total process of collecting, compiling,
analyzing, and publishing or otherwise disseminating
demographic, economic, and social data pertaining to all
persons in a country or in a well-delineated part of a
country at a specified time
99
Universality
Simultaneity
Individual enumeration
A census contains:
– Demographic data (at least age and
sex)
– Economic data (e.g., occupation and
income)
– Social (e.g., education and housing)
100-percent component
– Household relationship
– Sex
– Race
– Age
– Marital status
– Hispanic origin
Sample component
Social characteristics
– Education (enrollment and attainment)
– Place of birth, citizenship, and year of
entry into the United States
Social characteristics
– Ancestry
– Language spoken at home
– Migration
– Disability
– Fertility
– Veteran status
Economic characteristics
– Labor force
– Occupation, industry, and class of
worker
– Place of work and journey to work
– Work experience
– Income
– Year last worked
A census can be conducted:
– Legal or customary attachment to an
area (you are registered where you
usually reside)
– Physical residence (you are registered
where you are currently
staying/residing at the time of the
census)
 Establish administrative tree (census officers,
supervisors, enumerators)
 Develop questionnaire(s)
 Cartography
 Define enumeration areas
 Pretest enumeration processes
 Design data processing system
 Enumeration (postal with follow-up, general
canvas)
Estimation of undercounts
– Post-enumeration survey
– Demographic evaluation
Net Population Undercount (In Millions)
In The Census By Demographic Analysis, 1980-2020
Race 1980 2000 2020
Total
Population
Undercount Numbers
Non-blacks
Population
Undercount Numbers
Blacks
Population
Undercount Numbers
 Universal, hence small area data available
 National effort
 Provides frame for later sample surveys
 Provides population denominators
Size limits content and quality control
efforts
Cost limits frequency
Delay between field work and results
 Population definition
 Coverage change between censuses
 Treatment of non-response
 Censuses are universal, simultaneous and
require individual enumeration
 A census can be conducted de jure, de facto
or some combination
 Preparing a census is a meticulous process
including many steps
 Censuses should give small area data, although
coverage is not always certain
 The cost is high, but not having the
information may be more costly
 Censuses should be evaluated to estimate the
quality of the data; several techniques exist for
that purpose
 There are advantages and disadvantages to
the system
Surveys
 Purpose
– Obtain information from a sample
representative of some population
 Content
– Varies widely
– e.g., fertility, child mortality, migration
 Representative sample of some population
 Smaller size than census allows collection of
more in-depth information that can then be
generalized
 Single-round retrospective
– Census-type household surveys
– Focused, (e.g., Contraceptive Prevalence
Survey (CPS))
– Birth/Maternity history (World Fertility
Survey (WFS), Demographic and Health
Survey (DHS))
– Health monitoring
118
Multi-round follow-up (prospective)
 Sampling frame, generally from census
 Separate strata are often defined for sampling
– The provinces of a country could be strata or
urban and rural areas
– There may be multiple strata
 Census enumeration areas or sections of them
may constitute a cluster from which households
are sampled (clusters are typically sampled
within strata and then households within
clusters)
 Sample size may range from one to four
thousand women to hundreds of thousands of
people
 Sampled clusters may range from 20 to 400 or
more
 Single-round retrospective
– Can be quick
– Relatively inexpensive
– Flexible
– Can include detailed data
– Needs little continuity effort
 Multi-round prospective
– Some control on coverage and content
errors
– Follow-up allows control for sampling
distortion
123
 Single-round retrospective
– Coverage and content errors
– Misses certain types of events
 Multi-round prospective
– Slow
– Needs continuity of effort over
(extended) time
– High cost
 Surveys are done to obtain information from a
sample representative of some population
 Surveys are of a smaller size than a census,
which allows for collection of more in-depth
information that can then be generalized
 There are many types of surveys
 The sampling method used in surveys is often
multistage (e.g., household within cluster,
themselves taken within strata)
 Surveys are less expensive than censuses and
civil registration (smaller size allows for quick
collection of more in-depth information than any
of the other two systems)
 They have advantages and disadvantages

More Related Content

What's hot

Demography
DemographyDemography
Demography
Dalia El-Shafei
 
Measures of mortality
Measures of mortalityMeasures of mortality
Measures of mortality
Southern Range, Berhampur, Odisha
 
Measurement of morbidity
Measurement of morbidityMeasurement of morbidity
Measurement of morbidity
drjagannath
 
Measures of fertility
Measures of fertilityMeasures of fertility
Measures of fertility
Mmedsc Hahm
 
Session 9 migration techniques
Session 9  migration techniquesSession 9  migration techniques
Session 9 migration techniques
Papiya Mazumdar
 
DEFINITIONS
DEFINITIONSDEFINITIONS
DEFINITIONS
Shahzaib Khan
 
Measures of mortality
Measures of mortalityMeasures of mortality
Measures of mortality
Mmedsc Hahm
 
Demography
DemographyDemography
Demography
Marwa Salem
 
1.6 standardization
1.6 standardization1.6 standardization
1.6 standardization
A M
 
Fundamentals of demography
Fundamentals of demographyFundamentals of demography
Fundamentals of demography
nium
 
Standardization of rates
Standardization of ratesStandardization of rates
Standardization of rates
Halyna Lugova
 
Life expectancy and infant mortality
Life expectancy and infant mortalityLife expectancy and infant mortality
Life expectancy and infant mortality
SOHAILAHAMED1
 
Population pyramids
Population pyramidsPopulation pyramids
Population pyramids
Andy Dorn
 
Population Composition & Structure
Population Composition & StructurePopulation Composition & Structure
Population Composition & Structure
kdjw
 
Demography uph
Demography uphDemography uph
Demography uph
Mmedsc Hahm
 
Factors Affecting Fertility and Public Health Interventions
Factors Affecting Fertility and Public Health InterventionsFactors Affecting Fertility and Public Health Interventions
Factors Affecting Fertility and Public Health Interventions
Mohammad Aslam Shaiekh
 
Population Studies / Demography Introduction
Population Studies / Demography IntroductionPopulation Studies / Demography Introduction
Population Studies / Demography Introduction
Muteeullah
 
Demography slides
Demography slidesDemography slides
Demography slides
Raj Wali
 
Demography
DemographyDemography
Demography
DrChetanSharma5
 
Sources of population data
Sources of  population dataSources of  population data
Sources of population data
Manish Kothe
 

What's hot (20)

Demography
DemographyDemography
Demography
 
Measures of mortality
Measures of mortalityMeasures of mortality
Measures of mortality
 
Measurement of morbidity
Measurement of morbidityMeasurement of morbidity
Measurement of morbidity
 
Measures of fertility
Measures of fertilityMeasures of fertility
Measures of fertility
 
Session 9 migration techniques
Session 9  migration techniquesSession 9  migration techniques
Session 9 migration techniques
 
DEFINITIONS
DEFINITIONSDEFINITIONS
DEFINITIONS
 
Measures of mortality
Measures of mortalityMeasures of mortality
Measures of mortality
 
Demography
DemographyDemography
Demography
 
1.6 standardization
1.6 standardization1.6 standardization
1.6 standardization
 
Fundamentals of demography
Fundamentals of demographyFundamentals of demography
Fundamentals of demography
 
Standardization of rates
Standardization of ratesStandardization of rates
Standardization of rates
 
Life expectancy and infant mortality
Life expectancy and infant mortalityLife expectancy and infant mortality
Life expectancy and infant mortality
 
Population pyramids
Population pyramidsPopulation pyramids
Population pyramids
 
Population Composition & Structure
Population Composition & StructurePopulation Composition & Structure
Population Composition & Structure
 
Demography uph
Demography uphDemography uph
Demography uph
 
Factors Affecting Fertility and Public Health Interventions
Factors Affecting Fertility and Public Health InterventionsFactors Affecting Fertility and Public Health Interventions
Factors Affecting Fertility and Public Health Interventions
 
Population Studies / Demography Introduction
Population Studies / Demography IntroductionPopulation Studies / Demography Introduction
Population Studies / Demography Introduction
 
Demography slides
Demography slidesDemography slides
Demography slides
 
Demography
DemographyDemography
Demography
 
Sources of population data
Sources of  population dataSources of  population data
Sources of population data
 

Similar to Demogaphy

INDICATORS OF HEALTH
INDICATORS OF HEALTHINDICATORS OF HEALTH
INDICATORS OF HEALTH
MAHESWARI JAIKUMAR
 
INDICATORS OF HEALTH
INDICATORS OF HEALTHINDICATORS OF HEALTH
INDICATORS OF HEALTH
MAHESWARI JAIKUMAR
 
INDICATORS OF HEALTH
INDICATORS OF HEALTHINDICATORS OF HEALTH
INDICATORS OF HEALTH
MAHESWARI JAIKUMAR
 
DEMOGRAPHY
DEMOGRAPHYDEMOGRAPHY
Demography
DemographyDemography
Demography
KULDEEP VYAS
 
Population Dynamic.pptx
Population Dynamic.pptxPopulation Dynamic.pptx
Population Dynamic.pptx
itisha prasad
 
Demography
DemographyDemography
Demography
sasirekha krishnan
 
Community and Public Health (Week 4)
Community and Public Health (Week 4)Community and Public Health (Week 4)
Community and Public Health (Week 4)
Ana Anastacio
 
Basic Measures.pptx
Basic Measures.pptxBasic Measures.pptx
Basic Measures.pptx
Shumaila Jameel
 
Demography,unit 5
Demography,unit 5Demography,unit 5
Demography,unit 5
MohitShrestha7
 
Demography
Demography Demography
Demography
pramod kumar
 
Disease occurrence measurment lec-4.pptx
Disease occurrence measurment lec-4.pptxDisease occurrence measurment lec-4.pptx
Disease occurrence measurment lec-4.pptx
SaeedAbdiali
 
Biostatistics 4-6.pptx
Biostatistics 4-6.pptxBiostatistics 4-6.pptx
Biostatistics 4-6.pptx
agripamusic
 
Lecture demography 2019
Lecture demography 2019Lecture demography 2019
Lecture demography 2019
Rizwan Saeed
 
Data and epidemiology 2.pptx
Data and epidemiology 2.pptxData and epidemiology 2.pptx
Data and epidemiology 2.pptx
AbdallahAlasal1
 
Data and epidemiology 2.pptx
Data and epidemiology 2.pptxData and epidemiology 2.pptx
Data and epidemiology 2.pptx
AbdallahAlasal1
 
Unit: 6 Demographic Rates and Ratios vital statistics
Unit: 6 Demographic Rates and Ratios vital statistics Unit: 6 Demographic Rates and Ratios vital statistics
Unit: 6 Demographic Rates and Ratios vital statistics
SMVDCoN ,J&K
 
HealthIndicators for the national TB program .ppt
HealthIndicators for the national TB program .pptHealthIndicators for the national TB program .ppt
HealthIndicators for the national TB program .ppt
Esam43
 
ASSESSMENT OF NUTRITIONAL STATUS BASED ON VITAL STATISTICS
ASSESSMENT OF NUTRITIONAL STATUS BASED ON VITAL STATISTICSASSESSMENT OF NUTRITIONAL STATUS BASED ON VITAL STATISTICS
ASSESSMENT OF NUTRITIONAL STATUS BASED ON VITAL STATISTICS
jas maan
 
Vital ASSESSMENT OF NUTRITIONAL STATUS BASED ON VITAL STATISTICSppt
Vital ASSESSMENT OF NUTRITIONAL STATUS BASED ON VITAL STATISTICSpptVital ASSESSMENT OF NUTRITIONAL STATUS BASED ON VITAL STATISTICSppt
Vital ASSESSMENT OF NUTRITIONAL STATUS BASED ON VITAL STATISTICSppt
jas maan
 

Similar to Demogaphy (20)

INDICATORS OF HEALTH
INDICATORS OF HEALTHINDICATORS OF HEALTH
INDICATORS OF HEALTH
 
INDICATORS OF HEALTH
INDICATORS OF HEALTHINDICATORS OF HEALTH
INDICATORS OF HEALTH
 
INDICATORS OF HEALTH
INDICATORS OF HEALTHINDICATORS OF HEALTH
INDICATORS OF HEALTH
 
DEMOGRAPHY
DEMOGRAPHYDEMOGRAPHY
DEMOGRAPHY
 
Demography
DemographyDemography
Demography
 
Population Dynamic.pptx
Population Dynamic.pptxPopulation Dynamic.pptx
Population Dynamic.pptx
 
Demography
DemographyDemography
Demography
 
Community and Public Health (Week 4)
Community and Public Health (Week 4)Community and Public Health (Week 4)
Community and Public Health (Week 4)
 
Basic Measures.pptx
Basic Measures.pptxBasic Measures.pptx
Basic Measures.pptx
 
Demography,unit 5
Demography,unit 5Demography,unit 5
Demography,unit 5
 
Demography
Demography Demography
Demography
 
Disease occurrence measurment lec-4.pptx
Disease occurrence measurment lec-4.pptxDisease occurrence measurment lec-4.pptx
Disease occurrence measurment lec-4.pptx
 
Biostatistics 4-6.pptx
Biostatistics 4-6.pptxBiostatistics 4-6.pptx
Biostatistics 4-6.pptx
 
Lecture demography 2019
Lecture demography 2019Lecture demography 2019
Lecture demography 2019
 
Data and epidemiology 2.pptx
Data and epidemiology 2.pptxData and epidemiology 2.pptx
Data and epidemiology 2.pptx
 
Data and epidemiology 2.pptx
Data and epidemiology 2.pptxData and epidemiology 2.pptx
Data and epidemiology 2.pptx
 
Unit: 6 Demographic Rates and Ratios vital statistics
Unit: 6 Demographic Rates and Ratios vital statistics Unit: 6 Demographic Rates and Ratios vital statistics
Unit: 6 Demographic Rates and Ratios vital statistics
 
HealthIndicators for the national TB program .ppt
HealthIndicators for the national TB program .pptHealthIndicators for the national TB program .ppt
HealthIndicators for the national TB program .ppt
 
ASSESSMENT OF NUTRITIONAL STATUS BASED ON VITAL STATISTICS
ASSESSMENT OF NUTRITIONAL STATUS BASED ON VITAL STATISTICSASSESSMENT OF NUTRITIONAL STATUS BASED ON VITAL STATISTICS
ASSESSMENT OF NUTRITIONAL STATUS BASED ON VITAL STATISTICS
 
Vital ASSESSMENT OF NUTRITIONAL STATUS BASED ON VITAL STATISTICSppt
Vital ASSESSMENT OF NUTRITIONAL STATUS BASED ON VITAL STATISTICSpptVital ASSESSMENT OF NUTRITIONAL STATUS BASED ON VITAL STATISTICSppt
Vital ASSESSMENT OF NUTRITIONAL STATUS BASED ON VITAL STATISTICSppt
 

Recently uploaded

CCSN_June_06 2024_jones. Cancer Rehabpptx
CCSN_June_06 2024_jones. Cancer RehabpptxCCSN_June_06 2024_jones. Cancer Rehabpptx
CCSN_June_06 2024_jones. Cancer Rehabpptx
Canadian Cancer Survivor Network
 
How Effective is Homeopathic Medicine for Anxiety and Stress Relief.pdf
How Effective is Homeopathic Medicine for Anxiety and Stress Relief.pdfHow Effective is Homeopathic Medicine for Anxiety and Stress Relief.pdf
How Effective is Homeopathic Medicine for Anxiety and Stress Relief.pdf
Dharma Homoeopathy
 
Hypertension and it's role of physiotherapy in it.
Hypertension and it's role of physiotherapy in it.Hypertension and it's role of physiotherapy in it.
Hypertension and it's role of physiotherapy in it.
Vishal kr Thakur
 
Stem Cell Solutions: Dr. David Greene's Path to Non-Surgical Cardiac Care
Stem Cell Solutions: Dr. David Greene's Path to Non-Surgical Cardiac CareStem Cell Solutions: Dr. David Greene's Path to Non-Surgical Cardiac Care
Stem Cell Solutions: Dr. David Greene's Path to Non-Surgical Cardiac Care
Dr. David Greene Arizona
 
Top massage center in ajman chandrima Spa
Top massage center in ajman chandrima  SpaTop massage center in ajman chandrima  Spa
Top massage center in ajman chandrima Spa
Chandrima Spa Ajman
 
Hypotension and role of physiotherapy in it
Hypotension and role of physiotherapy in itHypotension and role of physiotherapy in it
Hypotension and role of physiotherapy in it
Vishal kr Thakur
 
KEY Points of Leicester travel clinic In London doc.docx
KEY Points of Leicester travel clinic In London doc.docxKEY Points of Leicester travel clinic In London doc.docx
KEY Points of Leicester travel clinic In London doc.docx
NX Healthcare
 
Deep Leg Vein Thrombosis (DVT): Meaning, Causes, Symptoms, Treatment, and Mor...
Deep Leg Vein Thrombosis (DVT): Meaning, Causes, Symptoms, Treatment, and Mor...Deep Leg Vein Thrombosis (DVT): Meaning, Causes, Symptoms, Treatment, and Mor...
Deep Leg Vein Thrombosis (DVT): Meaning, Causes, Symptoms, Treatment, and Mor...
The Lifesciences Magazine
 
Under Pressure : Kenneth Kruk's Strategy
Under Pressure : Kenneth Kruk's StrategyUnder Pressure : Kenneth Kruk's Strategy
Under Pressure : Kenneth Kruk's Strategy
Kenneth Kruk
 
Empowering ACOs: Leveraging Quality Management Tools for MIPS and Beyond
Empowering ACOs: Leveraging Quality Management Tools for MIPS and BeyondEmpowering ACOs: Leveraging Quality Management Tools for MIPS and Beyond
Empowering ACOs: Leveraging Quality Management Tools for MIPS and Beyond
Health Catalyst
 
Can coffee help me lose weight? Yes, 25,422 users in the USA use it for that ...
Can coffee help me lose weight? Yes, 25,422 users in the USA use it for that ...Can coffee help me lose weight? Yes, 25,422 users in the USA use it for that ...
Can coffee help me lose weight? Yes, 25,422 users in the USA use it for that ...
nirahealhty
 
TEST BANK FOR Health Assessment in Nursing 7th Edition by Weber Chapters 1 - ...
TEST BANK FOR Health Assessment in Nursing 7th Edition by Weber Chapters 1 - ...TEST BANK FOR Health Assessment in Nursing 7th Edition by Weber Chapters 1 - ...
TEST BANK FOR Health Assessment in Nursing 7th Edition by Weber Chapters 1 - ...
rightmanforbloodline
 
The Power of Superfoods and Exercise.pdf
The Power of Superfoods and Exercise.pdfThe Power of Superfoods and Exercise.pdf
The Power of Superfoods and Exercise.pdf
Dr Rachana Gujar
 
Unlocking the Secrets to Safe Patient Handling.pdf
Unlocking the Secrets to Safe Patient Handling.pdfUnlocking the Secrets to Safe Patient Handling.pdf
Unlocking the Secrets to Safe Patient Handling.pdf
Lift Ability
 
Luxurious Spa In Ajman Chandrima Massage Center
Luxurious Spa In Ajman Chandrima Massage CenterLuxurious Spa In Ajman Chandrima Massage Center
Luxurious Spa In Ajman Chandrima Massage Center
Chandrima Spa Ajman
 
MBC Support Group for Black Women – Insights in Genetic Testing.pdf
MBC Support Group for Black Women – Insights in Genetic Testing.pdfMBC Support Group for Black Women – Insights in Genetic Testing.pdf
MBC Support Group for Black Women – Insights in Genetic Testing.pdf
bkling
 
Letter to MREC - application to conduct study
Letter to MREC - application to conduct studyLetter to MREC - application to conduct study
Letter to MREC - application to conduct study
Azreen Aj
 
Gemma Wean- Nutritional solution for Artemia
Gemma Wean- Nutritional solution for ArtemiaGemma Wean- Nutritional solution for Artemia
Gemma Wean- Nutritional solution for Artemia
smuskaan0008
 
CANSA support - Caring for Cancer Patients' Caregivers
CANSA support - Caring for Cancer Patients' CaregiversCANSA support - Caring for Cancer Patients' Caregivers
CANSA support - Caring for Cancer Patients' Caregivers
CANSA The Cancer Association of South Africa
 
Vicarious movements or trick movements_AB.pdf
Vicarious movements or trick movements_AB.pdfVicarious movements or trick movements_AB.pdf
Vicarious movements or trick movements_AB.pdf
Arunima620542
 

Recently uploaded (20)

CCSN_June_06 2024_jones. Cancer Rehabpptx
CCSN_June_06 2024_jones. Cancer RehabpptxCCSN_June_06 2024_jones. Cancer Rehabpptx
CCSN_June_06 2024_jones. Cancer Rehabpptx
 
How Effective is Homeopathic Medicine for Anxiety and Stress Relief.pdf
How Effective is Homeopathic Medicine for Anxiety and Stress Relief.pdfHow Effective is Homeopathic Medicine for Anxiety and Stress Relief.pdf
How Effective is Homeopathic Medicine for Anxiety and Stress Relief.pdf
 
Hypertension and it's role of physiotherapy in it.
Hypertension and it's role of physiotherapy in it.Hypertension and it's role of physiotherapy in it.
Hypertension and it's role of physiotherapy in it.
 
Stem Cell Solutions: Dr. David Greene's Path to Non-Surgical Cardiac Care
Stem Cell Solutions: Dr. David Greene's Path to Non-Surgical Cardiac CareStem Cell Solutions: Dr. David Greene's Path to Non-Surgical Cardiac Care
Stem Cell Solutions: Dr. David Greene's Path to Non-Surgical Cardiac Care
 
Top massage center in ajman chandrima Spa
Top massage center in ajman chandrima  SpaTop massage center in ajman chandrima  Spa
Top massage center in ajman chandrima Spa
 
Hypotension and role of physiotherapy in it
Hypotension and role of physiotherapy in itHypotension and role of physiotherapy in it
Hypotension and role of physiotherapy in it
 
KEY Points of Leicester travel clinic In London doc.docx
KEY Points of Leicester travel clinic In London doc.docxKEY Points of Leicester travel clinic In London doc.docx
KEY Points of Leicester travel clinic In London doc.docx
 
Deep Leg Vein Thrombosis (DVT): Meaning, Causes, Symptoms, Treatment, and Mor...
Deep Leg Vein Thrombosis (DVT): Meaning, Causes, Symptoms, Treatment, and Mor...Deep Leg Vein Thrombosis (DVT): Meaning, Causes, Symptoms, Treatment, and Mor...
Deep Leg Vein Thrombosis (DVT): Meaning, Causes, Symptoms, Treatment, and Mor...
 
Under Pressure : Kenneth Kruk's Strategy
Under Pressure : Kenneth Kruk's StrategyUnder Pressure : Kenneth Kruk's Strategy
Under Pressure : Kenneth Kruk's Strategy
 
Empowering ACOs: Leveraging Quality Management Tools for MIPS and Beyond
Empowering ACOs: Leveraging Quality Management Tools for MIPS and BeyondEmpowering ACOs: Leveraging Quality Management Tools for MIPS and Beyond
Empowering ACOs: Leveraging Quality Management Tools for MIPS and Beyond
 
Can coffee help me lose weight? Yes, 25,422 users in the USA use it for that ...
Can coffee help me lose weight? Yes, 25,422 users in the USA use it for that ...Can coffee help me lose weight? Yes, 25,422 users in the USA use it for that ...
Can coffee help me lose weight? Yes, 25,422 users in the USA use it for that ...
 
TEST BANK FOR Health Assessment in Nursing 7th Edition by Weber Chapters 1 - ...
TEST BANK FOR Health Assessment in Nursing 7th Edition by Weber Chapters 1 - ...TEST BANK FOR Health Assessment in Nursing 7th Edition by Weber Chapters 1 - ...
TEST BANK FOR Health Assessment in Nursing 7th Edition by Weber Chapters 1 - ...
 
The Power of Superfoods and Exercise.pdf
The Power of Superfoods and Exercise.pdfThe Power of Superfoods and Exercise.pdf
The Power of Superfoods and Exercise.pdf
 
Unlocking the Secrets to Safe Patient Handling.pdf
Unlocking the Secrets to Safe Patient Handling.pdfUnlocking the Secrets to Safe Patient Handling.pdf
Unlocking the Secrets to Safe Patient Handling.pdf
 
Luxurious Spa In Ajman Chandrima Massage Center
Luxurious Spa In Ajman Chandrima Massage CenterLuxurious Spa In Ajman Chandrima Massage Center
Luxurious Spa In Ajman Chandrima Massage Center
 
MBC Support Group for Black Women – Insights in Genetic Testing.pdf
MBC Support Group for Black Women – Insights in Genetic Testing.pdfMBC Support Group for Black Women – Insights in Genetic Testing.pdf
MBC Support Group for Black Women – Insights in Genetic Testing.pdf
 
Letter to MREC - application to conduct study
Letter to MREC - application to conduct studyLetter to MREC - application to conduct study
Letter to MREC - application to conduct study
 
Gemma Wean- Nutritional solution for Artemia
Gemma Wean- Nutritional solution for ArtemiaGemma Wean- Nutritional solution for Artemia
Gemma Wean- Nutritional solution for Artemia
 
CANSA support - Caring for Cancer Patients' Caregivers
CANSA support - Caring for Cancer Patients' CaregiversCANSA support - Caring for Cancer Patients' Caregivers
CANSA support - Caring for Cancer Patients' Caregivers
 
Vicarious movements or trick movements_AB.pdf
Vicarious movements or trick movements_AB.pdfVicarious movements or trick movements_AB.pdf
Vicarious movements or trick movements_AB.pdf
 

Demogaphy

  • 2. • 1. DEMOS - People. • 2. GRAPHO - To write. • The word was coined by JOHN GRUNT
  • 3. Demography—The study of a population in its static and dynamic aspects
  • 4. Demography is the branch of social size, structure, which deals with the study of size, structure and distribution of populations, along with the spatial and temporal changes in them in response to birth, migration, ageing and death.
  • 5. • Demography is the science of population. In it's most general meaning, a population is a set of people who live in a specific land area : a commune, a district, a country or a continent,etc. • A formal demography is concerned with the size, distribution, structure and changes of population
  • 6. DEMOGRAPHY CYCLE HIGH STATIONARY. EARLY EXPANDING. LATE EXPANDING. LOW STATIONARY. DECLINING.
  • 7. HIGH STATIONARY. EARLY EXPANDING. LATE EXPANDING. LOW STATIONARY. DECLINING. High Birth Rate High Death Rate Unchanged Birth Rate Decline Death Rate Fall in Birth Rate Death Rate further Low Birth Rate Low Death Rate Birth rate lower than Death Rate
  • 8. Static aspects include characteristics at a point in time such as composition by: – Age – Sex – Race – Marital status – Economic characteristics
  • 9. • 1. Measurement of Mortality. • 2. Measurement of Morbidity. • 3. Measurement of disability. • 4. Measurement of natality. • 5. Measurement of the presence, absence or distribution of the characteristics or attributes of the disease.
  • 10. Dynamic aspects are: – Fertility – Mortality – Nuptiality – Migration – Growth
  • 11. 1 Demographic Analysis — The study of components of variation and change in demographic variables and the relationships between them This is also called formal demography or demographic methods
  • 12. 1 Population Studies—The study of the relationships between demographic variables and other variables such as social and economic variables
  • 13. An epidemiologist usually expresses the health event as RATES, RATIOS or PROPOTION.
  • 14. • A rate measures the occurrence of some particular event in a population during a given period of time period. • It is the statement of the risk of of developing a condition.
  • 15. It indicates the change in some event that takes place in a population over a period of time. DEATH RATE = NUMBER OF DEATHS MID YEAR POP X 1000
  • 16. Weekly death rate = Deaths in a week x 52 Mid year population x 1000
  • 17. • A rate comprises the following elements. 1. Numerator. 2. Denominator. 3. Multiplier.
  • 18. The time dimension is usually a calender year. The rate is expresses per 1000 or some round figure.(selected according to convenience or convention to avoid fraction).
  • 19. • Ratio expresses a relation in size between two random quantities. E.g., x : y (or) x/y.
  • 20. • The numerator is not a component of the denominator. • The numerator and denominator may involve an interval of time or may be simultaneous in time. The number of children with scabies at a certain time. The number of children with malnutrition at a certain time
  • 21. • A Proportion is a ratio which indicates the relation in magnitude of a part of the whole. • The numerator is always included in the denominator. • A Proportion is usually expressed as percentage.
  • 22. The number of children with scabies at a certain time. x 100 The total number of children in the village at the same time
  • 23. • Mortality refers to the number of deaths in a given time or a place or a proportion odf deaths in relation to a population. • E.g., : 1. Crude Death Rate. 2. Infant Mortality Rate. 3. Maternal Mortality Rate 4. Life Expectancy.
  • 24. • It refers to diseases and illness, injuries and disabilities in a population. • Data on the frequency and distribution of a disease helps in controlling its spread, and in some cases it may lead to the identification of cases.
  • 25. Case Rate : The case rate is the number of reported cases of a specific disease or illness per 100,000 population during a given year.
  • 26. Case Fatality Rate : The Case Fatality Rate is the proportion of persons contacting a disease who die of that disease during a specified time period.
  • 27. • Dependancy Ratio : The ratio of the economically dependent part of the population to the productive part; arbitrarily defined as the ratio of the elderly ( ages 65 and older) plus the young (under age 15) to the population in the "working ages".
  • 28. • Natality in population ecology is the scientific term for Birth Rate. • Along with mortality rate, natality rate is used to calculate the dynamics of a population.
  • 29. • They are the key factors in determining whether a population is increasing, decreasing or staying the same in size. • Natality is the greatest influence on a population’s increase.
  • 30. • Natality is shown as a crude birth rate or specific birth rate. • Crude Birth Rate is used when calculating population size (number of births per 1000 population/year). • whereas Specific Birth Rate is used relative to a specific criterion such as age. • By calculating specific birth rate, the results are seen in an age-specific schedule of births.
  • 31.
  • 32. NUMBER IF LIVE BIRTHS DURING THE YEAR. ESTIMATED MID YEAR POPULATION X 1000BIRTH RATE =
  • 33. NUMBER OF LIVE BIRTHS DURING A YEAR. MID YEAR FEMALE POP (15-49) IN THE SAME YEAR X 1000GFR =
  • 34. NUMBER OF LIVE BIRTHS DURING A YEAR. MID YEAR MARRIED FEMALE POP (15-49) YRS GMFR = X 1000
  • 35. NUMBER OF LIVE BIRTHS IN A PARTICULAR AGE GROUP. MID YEAR POP OF THE SAME AGE GROUP ASFR = X 1000
  • 36. NUMBER OF LIVE BIRTHS IN A PARTICULAR AGE GROUP. MID YAER POP OF THE SAME AGE GROUP. ASMFR = X 1000
  • 37. • It is the average number of children a women can give birth throughout the reproductive period. • It is represented by summing the age specific fertility rates for all ages; if 5 - year age groups are used, the sum of the rates is multiplied by 5.
  • 38. 45 - 49 15 - 19 1000 TFR = 5 X ∑ ASFR
  • 39. Average number of children that would be born to a married women if she experiences the current fertility pattern through her reproductive span.
  • 40. 45 - 49 15 -19 1000 5 X ∑ ASMFRTMFR =
  • 41. Average number of girls that would be borne to a women if she experiences the curent fertility pattern throught her reproductive span (15 - 49 years) having no mortality.
  • 42. • NRR is defined as the number of daughters a new borne girl will bear during her lifetime assuming fixed age-specific fertility and mortality rates.
  • 43. • If NRR is < 1, then the reproductive performance of the population is said to be below replacement level.
  • 44. • The marriage rate (CRUDE MARRIAGE RATE) is the number of marriages per 1000 total population in a given year.
  • 45. NUMBER OF MARRIAGES IN THE YEAR MID YEAR POPULATION MR = X 1000
  • 46. • Is the number of children 0 - 4 yrs of age per 1000 women of child bearing age.
  • 47. • It is the ratio of number of pregnancies in a year to married women in the ages 15-49 yrs. • The "number of pregnancies" includes all pregnancies, whether or had terminated as live births, stillbirths or abortions or had not yet terminated.
  • 48. • The annual number of all types of abortions, usually per 1000 women of child bearing age (15-19 yrs).
  • 49. • This is calculated by dividing the number of abortions performed during a particular timeperiod by the number of live births over the same period.
  • 50. NUMBER OF DEATHS DURING A YEAR X 1000 MID YEAR POPULATION CDR =
  • 51. NUMBER OF DEATHS FROM TB DURING A CALENDER YEAR. MID YEAR POPULATION SDR = X 1000
  • 52. NUMBER OF DEATHS OF PERSONS AGED 15-20 DURING A CALENDER MID YEAR POPULATION OF PERSONS AGED 15-20 SPECIFIC DEATH RATE (15-20 YRS) = YEAR. X 1000
  • 53. TOTAL NUMBER OF DEATHS DUE TO A PARTICULAR DISEASE CFR = X 100 TOTAL NUMBER OF CASES DUE TO THE SAME DISEASE
  • 54. NUMBER OF DEATHS FROM THE SPECIFIC DISEASE IN A YEAR TOTAL DEATHS FROM ALL CAUSES IN THAT YEAR X 100PMR =
  • 55. TOTAL NUMBER OF PATIENTS ALIVE AFTER 5 YEARS TOTAL NUMBER OF PATIENTS DIAGNOSED OR TREATED SURVIVAL RATE = X 100
  • 57. NUMBER OF DEATHS OF CHILDREN LESS THAN 1 YEAR OF AGE IN A YEAR NUMBER OF LIVE BIRTHS IN THE SAME YEAR X 1000IMR =
  • 58. NUMBER OF NEW CASES OF A SPECIFIED DISEASE DURING A SPECIFIED TIME INTERVAL TOTAL POPULATION AT RISK DURING THE SAME INTERVAL X 100AR =
  • 59. FOETAL DEATHS WEIGHING OVER 1000g AT BIRTH DURING THE YEAR TOTAL LIVE + STILL BIRTHS WEIGHING OVER 1000g AT BIRTH DURING THE YEAR X 1000SBR =
  • 60. LATE FOETAL AND EARLY NEO NATAL DEATHS WEIGHING OVER 1000g AT BIRTH TOTAL LIVE BIRTHS WEIGHING OVER 1000g AT BIRTH X 1000PMR =
  • 61. NUMBER OF DEATHS OF CHILDREN UNDER 28 DAYS OF AGE IN A YEAR TOTAL LIVE BIRTHS IN THE SAME YEAR X 1000NMR =
  • 62. NUMBER OF DEATHS OF CHILDREN BETWEEN 28 DAYS AND ONE YEAR OF AGE IN A GIVEN YEAR TOTAL LIVE BIRTHS IN THE SAME YEAR X 1000PNMR =
  • 63. NUMBER OF DEATHS OF CHILDREN AGED 1-4 YEARS DURING A YEAR TOTAL NUMBER OF CHILDREN AGED 1-4 YEARS AT THE MIDDLE OF THE YEAR X 1000CDR =
  • 64. NUMBER OF DEATHS OF CHILDREN LESS THAN 5 YEARS OF AGE IN A GIVEN YEAR NUMBER OF LIVE BIRTHS IN THE SAME YEAR X 1000CMR =
  • 65. 1000 - UNDER 5 MORTALITY RATE 10
  • 66. TOTAL NUMBER OF FEMALE DEATHS DUE TO COMPLICATIONS OF PREGNANCY, CHILDBIRTH OR WITHIN 42 DAYS OF DELIVERY FROM PUERPERAL CAUSES IN AN AREA DURING A GIVEN YEAR TOTAL NUMBER OF LIVE BIRTHS IN THE SAME AREA AND YEAR X 1000 / 100000 MMR =
  • 67. INDICATORS USED TO MEASURE DISABILITY : 1. SULLIVAN INDEX 2. HEALTH ADJUSTED LIFE EXPECTANCY (HALE). 3. DISABILITY ADJUSTED LIFE YEAR
  • 68. SULLIVAN INDEX LIFE EXPECTANCY - (PROBABLE DURATION OF BED DISABILITY + INABILITY TO PERFORM MAJOR ACTIVITIES)
  • 69. • Is an indicator of health which measures healthy life expectancy. • HALE is equivalent to the number of years newborn child expected to live with full health.
  • 70. • Is used to express the years of life lost to premature death and years lived with disability for severity of disability. • ONE DALY = ONE LOST YEAR OF HEALTHY LIFE
  • 71. Number of reported cases of a specific disease or illness 100,000 population during a given year
  • 72. NUMBER OF EMIGRANTS DEPARTING AN AREA OF ORIGIN 1000 POPULATION AT THAT AREA OF ORIGIN IN A GIVEN YEAR
  • 73. The net effect of immigration and emigration on an area's population (increase or decrease) is refered to as net migration. The net migration shows the net effect of immigration & emigration on an area's population of the area in a given year.
  • 74. The growth rate is the rate at which a population is increasing (or decreasing) in a given year due to natural increase and net migration, expressed as a percentage of the base population. •The growth rate takes in to account all components of population growth: births, deaths and migration.
  • 75. The number of years which an individual at a given age could expect to live, at present mortality levels
  • 76. • Analysis patterns and trends related to human religion, nationality, education and ethnicity. • Estimates are reliable standards for judging the accuracy of the census information gathered at any time. • Estimates size and flow of populations of workers; in population ecology, the focus is on birth, death and movement of firms and institutional forms. • Uses administrative records to develop an independent estimate of the population.
  • 77. • Provides insight into the links between these characteristics and cultural, economic, geographic and other social attributes present in a given area. • Demographic analysis is a powerful tool that can explain a number of sociological phenomena.
  • 78. All live-born infants should be registered and counted as such irrespective of gestational age or whether alive or dead at time of registration, and if they die at any time following birth they should also be registered and counted as deaths
  • 79. The United Nations recommends that the following be collected at a minimum for live birth registration: – Data on event •Date of occurrence •Date of registration •Place of occurrence •Type of birth/delivery •Attendance at birth
  • 80. Data on infant: – Sex – Legitimacy status – Weight at birth
  • 81. 81 Data on mother: – Age or date of birth – Number of previous children born alive – Date of marriage or duration of marriage – Place of usual residence
  • 82. Death—Permanent disappearance of all evidence of life at any time after live birth has taken place (post-natal cessation of vital functions without capability of resuscitation) This definition excludes fetal deaths
  • 83. 83 Fetal Death—Death prior to the complete expulsion or extraction from its mother of a product of conception, irrespective of the duration of pregnancy
  • 84.  Three major categories of fetal deaths recommended by WHO: – Early fetal death: < 20 completed weeks of gestation – Intermediate fetal death:  20 but  28 weeks – Late fetal death:  28 weeks
  • 85. Stillbirth—Late fetal death To be used only if essential for national purposes
  • 86.  The following be collected at the minimum for death registration – Data on event: • Date of occurrence • Date of registration • Place of occurrence • Cause of death • Certifier
  • 87.  Data on decedent: – Age or date of birth – Sex – Marital status – Occupation – Place of usual residence
  • 88.  Knowledge of certifier  Certifier may never see deceased  “Garbage codes”: missing, senility, etc . . .  Heart versus brain function loss in the definition of death
  • 89.  Bleeding  Burnt and scalded  Drowned  Excessive drinking  Frightened  Grief  Hanging  Killed by several accidents  Murdered  Poisoned  Smothered  Shot  Starved  Vomiting
  • 90.  Note: causes of death can be regrouped in smaller categories than in ICD – e.g., Preston’s classification of causes of death in 12 categories
  • 91.  Marriage—Ceremony or process by which the legal relationship of husband and wife is constituted  The legality of the union may be established by civil, religious, or other means as recognized by the laws of each country
  • 92.  The following be collected at a minimum for marriage registration: – Data on event • Date of occurrence • Date of registration • Place of occurrence • Type of marriage—civil, religious, customary
  • 93. 34  Data on bride and groom – Age or date of birth – Previous marital status – Place of usual residence
  • 94.  Divorce—Final legal dissolution of a marriage, that is, that separation of husband and wife which confers on the parties the right to remarriage under civil, religious and/or other provisions, according to the laws of each country
  • 95.  Demography is the study of a population in its static and dynamic aspects  Civil registration is a system developed to collect data on vital events (live births, deaths, marriages and divorces) happening to a population
  • 96.  Civil registration is continuous and universal (it should give small area data)  There are advantages and disadvantages to the system and its completeness varies widely between countries and continents
  • 98. Census—The total process of collecting, compiling, analyzing, and publishing or otherwise disseminating demographic, economic, and social data pertaining to all persons in a country or in a well-delineated part of a country at a specified time
  • 100. A census contains: – Demographic data (at least age and sex) – Economic data (e.g., occupation and income) – Social (e.g., education and housing)
  • 101. 100-percent component – Household relationship – Sex – Race – Age – Marital status – Hispanic origin
  • 102. Sample component Social characteristics – Education (enrollment and attainment) – Place of birth, citizenship, and year of entry into the United States
  • 103. Social characteristics – Ancestry – Language spoken at home – Migration – Disability – Fertility – Veteran status
  • 104. Economic characteristics – Labor force – Occupation, industry, and class of worker – Place of work and journey to work – Work experience – Income – Year last worked
  • 105. A census can be conducted: – Legal or customary attachment to an area (you are registered where you usually reside) – Physical residence (you are registered where you are currently staying/residing at the time of the census)
  • 106.  Establish administrative tree (census officers, supervisors, enumerators)  Develop questionnaire(s)  Cartography  Define enumeration areas  Pretest enumeration processes  Design data processing system  Enumeration (postal with follow-up, general canvas)
  • 107. Estimation of undercounts – Post-enumeration survey – Demographic evaluation
  • 108. Net Population Undercount (In Millions) In The Census By Demographic Analysis, 1980-2020 Race 1980 2000 2020 Total Population Undercount Numbers Non-blacks Population Undercount Numbers Blacks Population Undercount Numbers
  • 109.  Universal, hence small area data available  National effort  Provides frame for later sample surveys  Provides population denominators
  • 110. Size limits content and quality control efforts Cost limits frequency Delay between field work and results
  • 111.  Population definition  Coverage change between censuses  Treatment of non-response
  • 112.  Censuses are universal, simultaneous and require individual enumeration  A census can be conducted de jure, de facto or some combination  Preparing a census is a meticulous process including many steps  Censuses should give small area data, although coverage is not always certain
  • 113.  The cost is high, but not having the information may be more costly  Censuses should be evaluated to estimate the quality of the data; several techniques exist for that purpose  There are advantages and disadvantages to the system
  • 115.  Purpose – Obtain information from a sample representative of some population  Content – Varies widely – e.g., fertility, child mortality, migration
  • 116.  Representative sample of some population  Smaller size than census allows collection of more in-depth information that can then be generalized
  • 117.  Single-round retrospective – Census-type household surveys – Focused, (e.g., Contraceptive Prevalence Survey (CPS)) – Birth/Maternity history (World Fertility Survey (WFS), Demographic and Health Survey (DHS)) – Health monitoring
  • 119.  Sampling frame, generally from census  Separate strata are often defined for sampling – The provinces of a country could be strata or urban and rural areas – There may be multiple strata
  • 120.  Census enumeration areas or sections of them may constitute a cluster from which households are sampled (clusters are typically sampled within strata and then households within clusters)  Sample size may range from one to four thousand women to hundreds of thousands of people  Sampled clusters may range from 20 to 400 or more
  • 121.  Single-round retrospective – Can be quick – Relatively inexpensive – Flexible – Can include detailed data – Needs little continuity effort
  • 122.  Multi-round prospective – Some control on coverage and content errors – Follow-up allows control for sampling distortion
  • 123. 123  Single-round retrospective – Coverage and content errors – Misses certain types of events  Multi-round prospective – Slow – Needs continuity of effort over (extended) time – High cost
  • 124.  Surveys are done to obtain information from a sample representative of some population  Surveys are of a smaller size than a census, which allows for collection of more in-depth information that can then be generalized  There are many types of surveys
  • 125.  The sampling method used in surveys is often multistage (e.g., household within cluster, themselves taken within strata)  Surveys are less expensive than censuses and civil registration (smaller size allows for quick collection of more in-depth information than any of the other two systems)  They have advantages and disadvantages

Editor's Notes

  1. The death is indicated by the fact that after such separation the fetus does not breathe or show any other evidence of life, such as beating of the heart, pulsation of the umbilical cord, or definite movement of voluntary muscles